. 2024 May 28;43(5):114164.
doi: 10.1016/j.celrep.2024.114164. Epub 2024 Apr 27.

Selective targeting of mu opioid receptors to primary cilia

Affiliations

Selective targeting of mu opioid receptors to primary cilia

Rita R Fagan et al. Cell Rep. .

Abstract

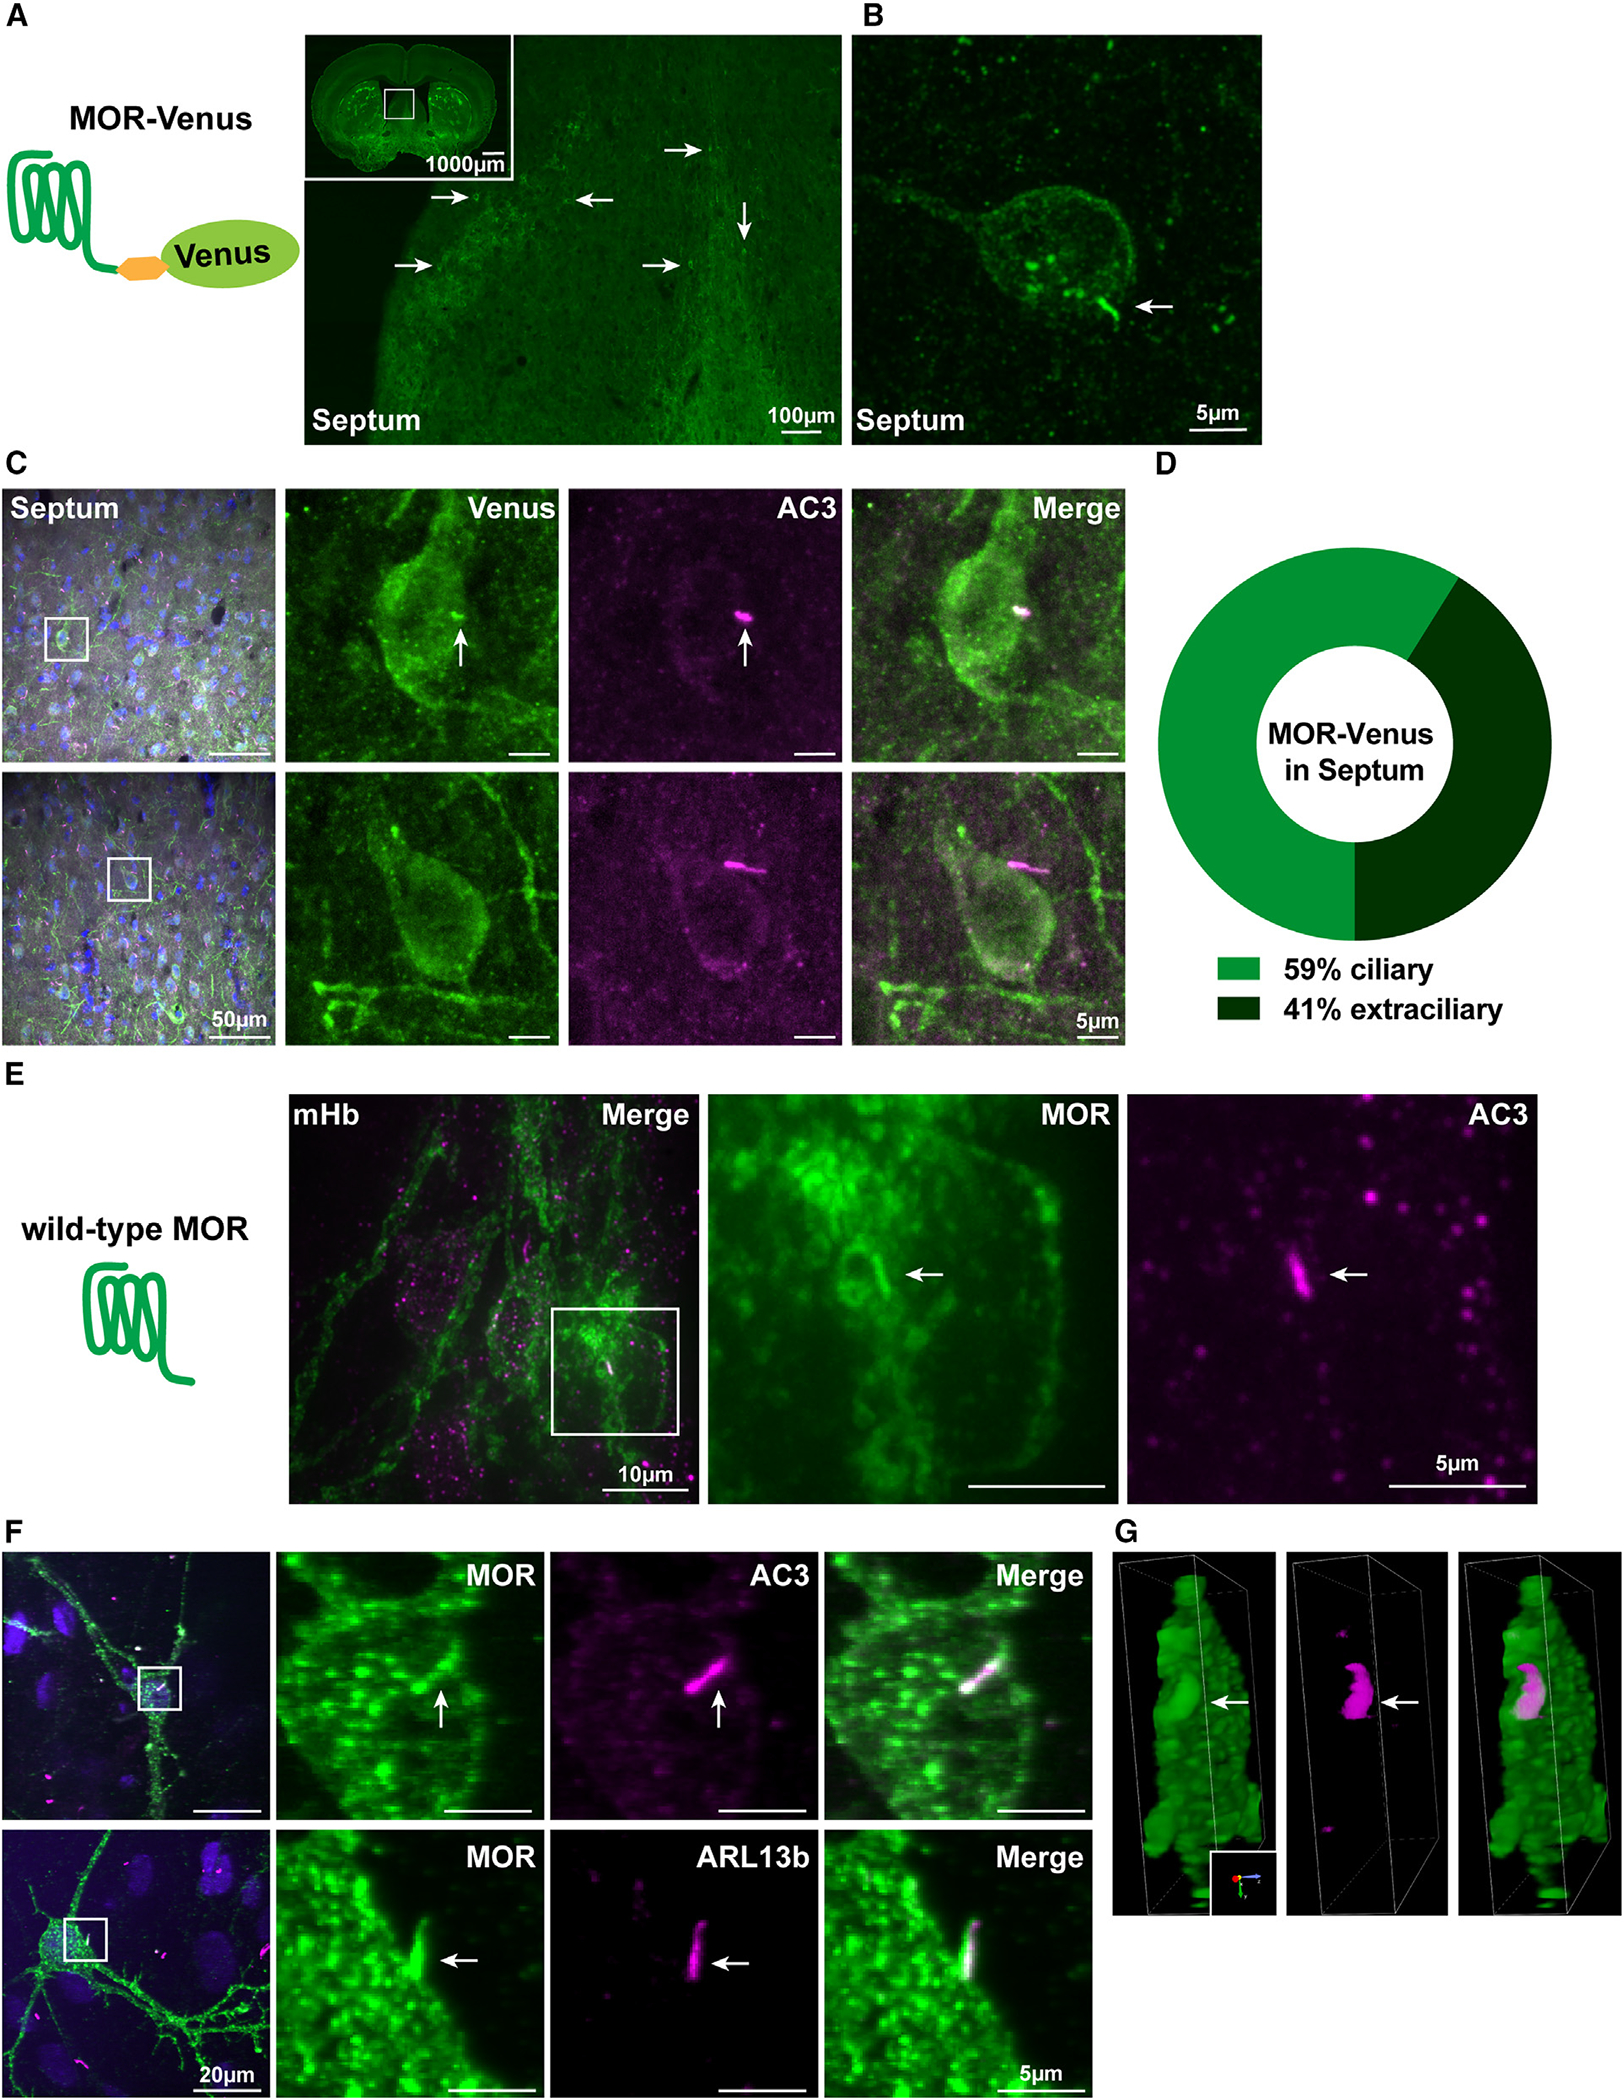
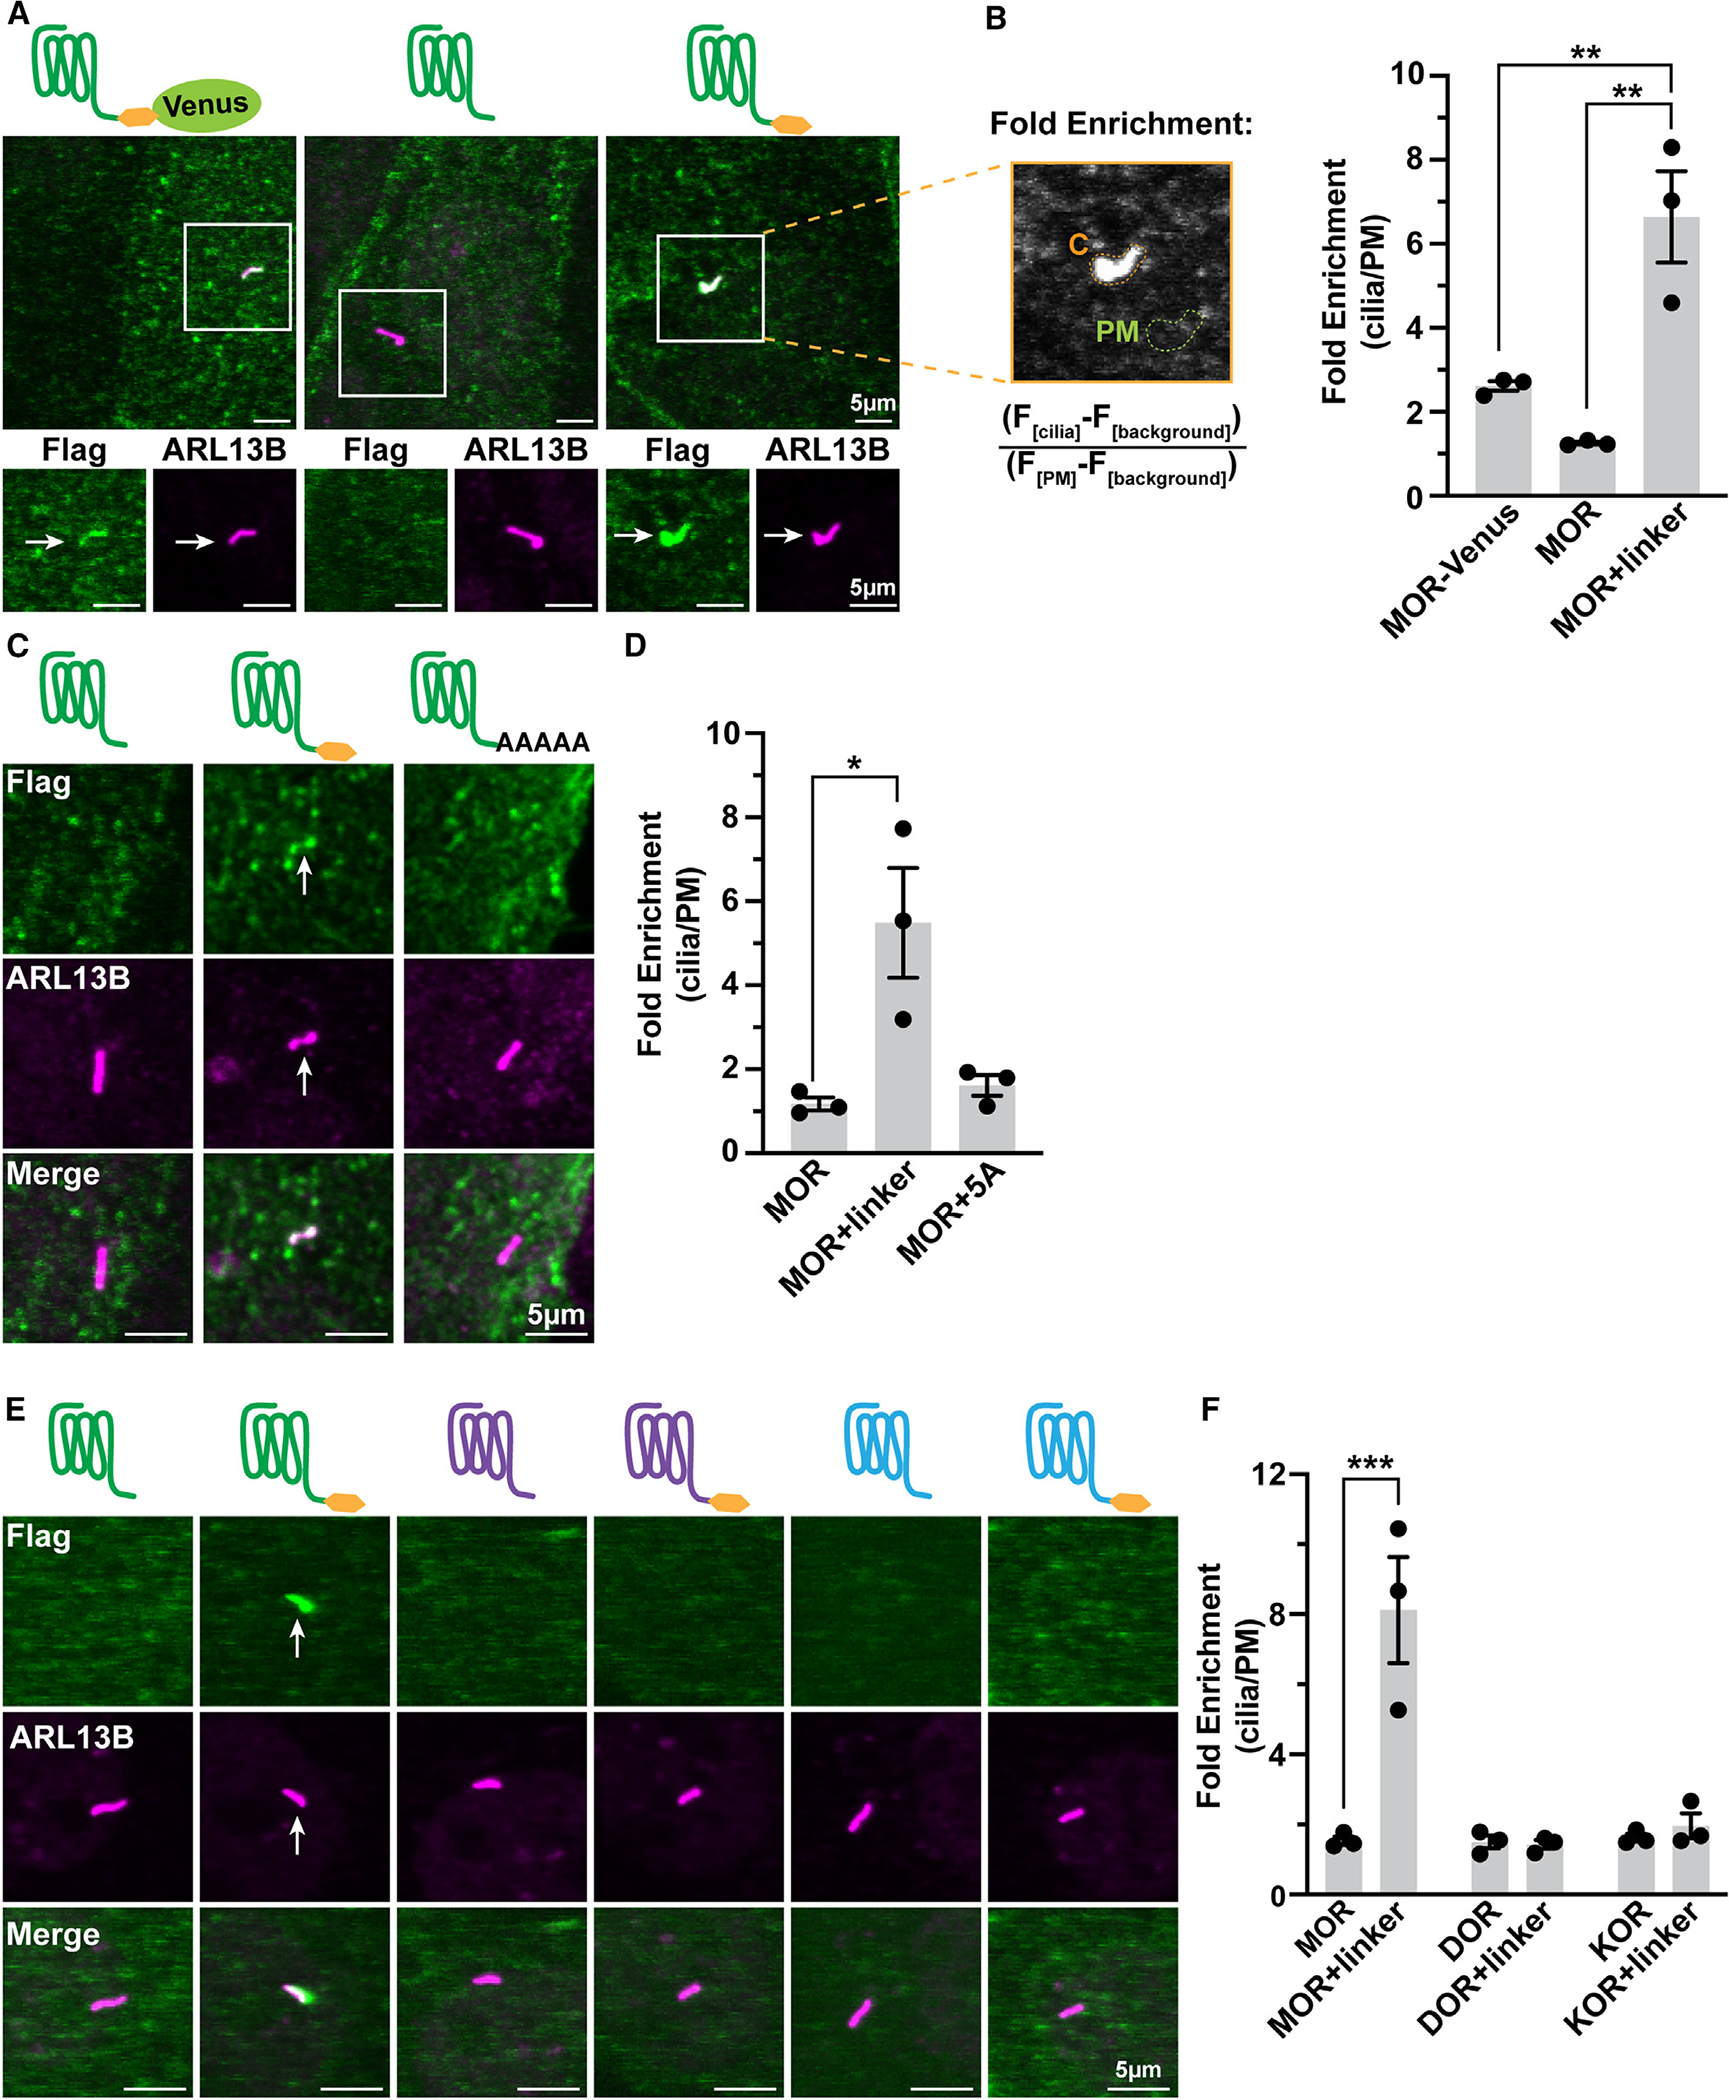
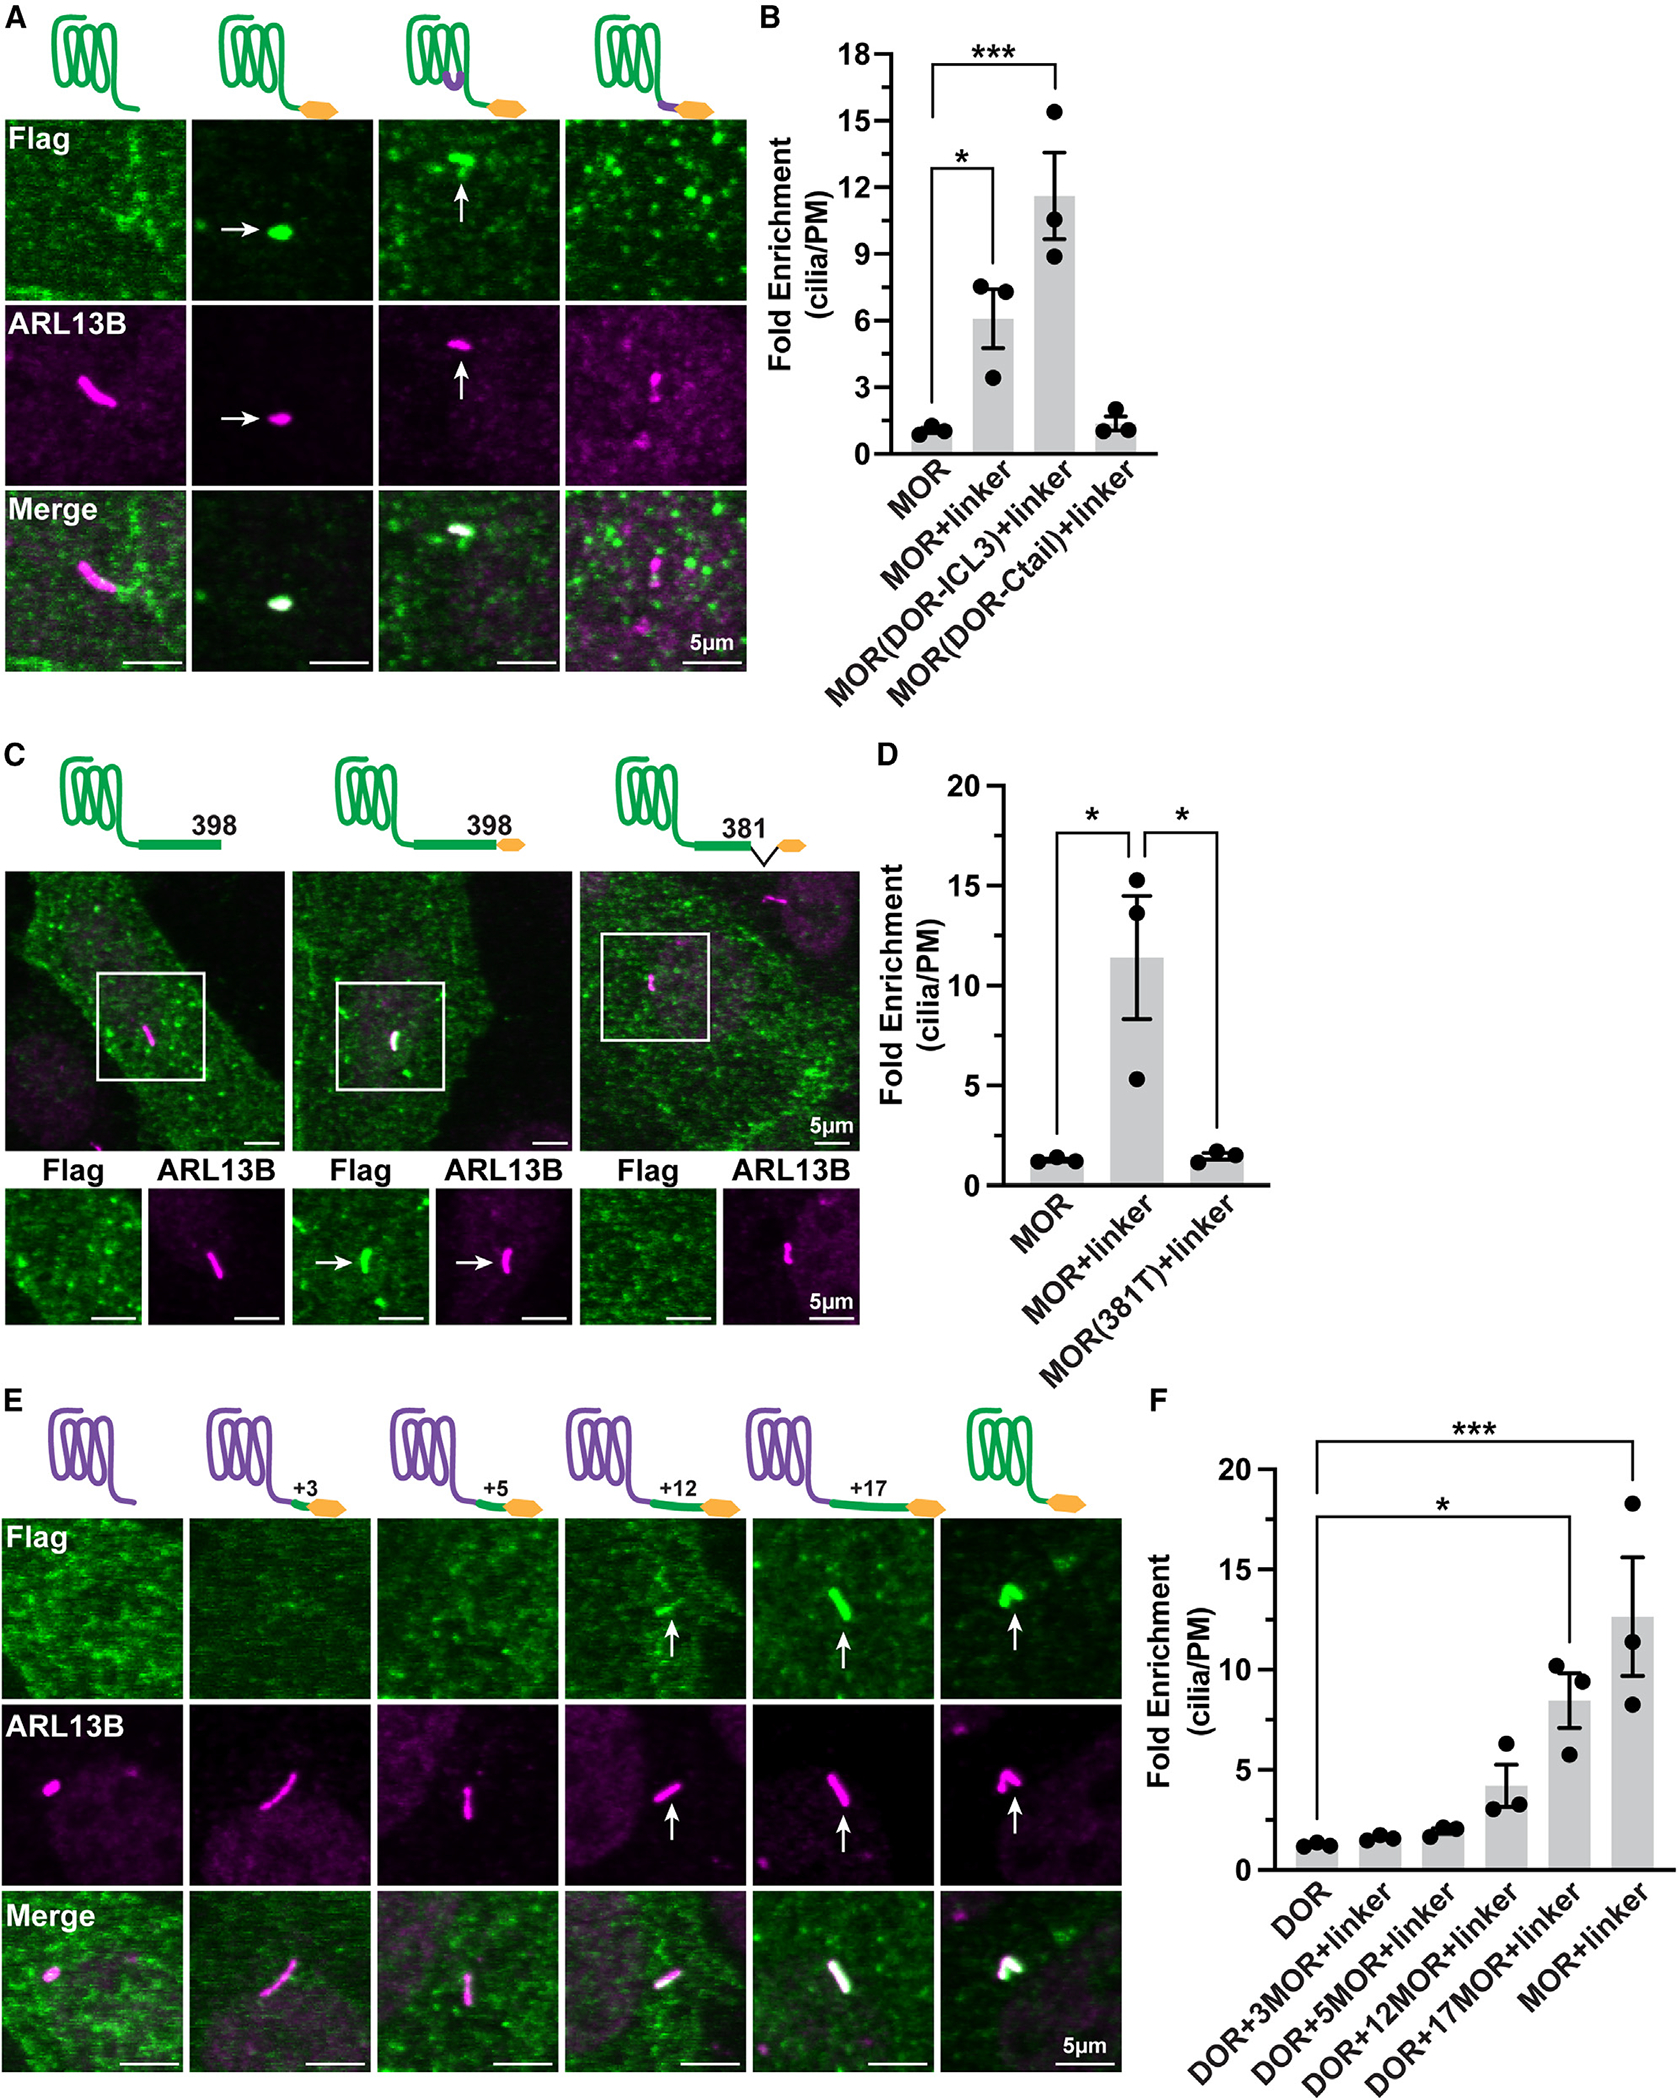
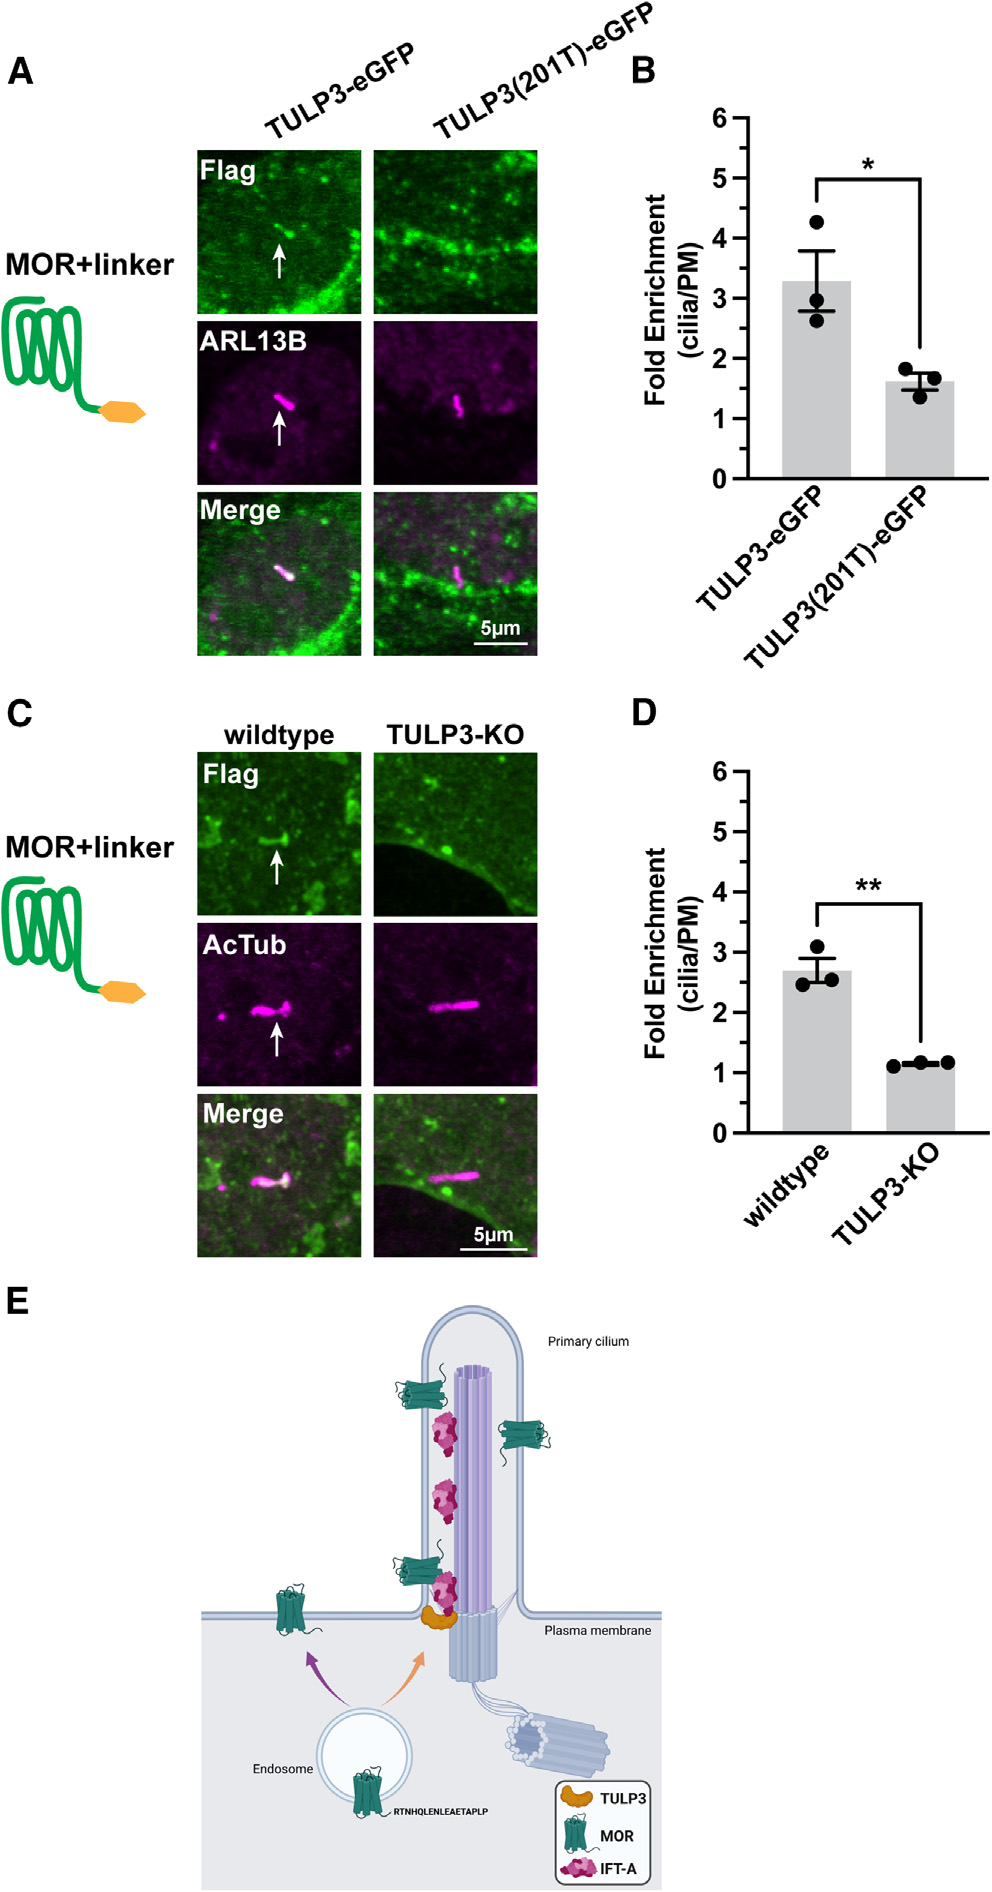
Opioid receptors are therapeutically important G protein-coupled receptors (GPCRs) with diverse neuromodulatory effects. The functional consequences of opioid receptor activation are known to depend on receptor location in the plasma membrane, but mechanisms mediating selective localization of receptors to any particular membrane domain remain elusive. Here, we demonstrate the targeting of the mu opioid receptor (MOR) to the primary cilium, a discrete microdomain of the somatic plasma membrane, both in vivo and in cultured cells. We further show that ciliary targeting is specific to MORs, requires a 17-residue sequence unique to the MOR cytoplasmic tail, and additionally requires the Tubby-like protein 3 (TULP3) ciliary adaptor protein. Our results reveal the potential for opioid receptors to undergo selective localization to the primary cilium. We propose that ciliary targeting is mediated through an elaboration of the recycling pathway, directed by a specific C-terminal recycling sequence in cis and requiring TULP3 in trans.

Keywords: CP: Cell biology; G protein-coupled receptor; MOR; TULP3; brain; mouse; neuronal; primary cilium; recycling.


Conflict of interest statement

Declaration of interests The authors declare no competing interests.

Figures

Figure 1.
Figure 1.. MOR-Venus and native, untagged MORs localize to neuronal primary cilia
(A) Schematic representation of MOR-Venus construct expressed in the knockin mouse model and presented in (A)–(D). Representative confocal image of adult MOR-Venus coronal sections containing septum and the dorsal third ventricle. Inset: image of a whole 25 μm slice. Arrows indicate MOR-Venus(+) cell bodies. Scale bar: 100 μm (inset: 1,000 μm). (B) Higher-magnification image of septal neuron positive for MOR-Venus. Arrow indicates membrane protrusion reminiscent of a primary cilium. Scale bar: 5 μm. (C) Representative images of adult MOR-Venus coronal sections containing septal neurons. MOR-Venus signal was amplified using GFP antibody, neuronal cilia were labeled with anti-adenylyl cyclase III (AC3), and cell bodies were stained with DAPI. Arrows indicate MOR-Venus(+) primary cilium. Scale bars: 50 μm (left, merge) and 5 μm (right, individual channels). For additional brain regions and the MOR-mCherry mouse model, see Figure S1. (D) Quantification of the percentage of MOR-Venus receptors localized to AC3 cilia in the septum. n = 3 mice, with approximately 9–42 neurons per animal. (E) Schematic representation of wild-type MOR analyzed in (E)–(G). (E) Representative confocal image of native (wild-type) adult mouse medial habenula. Slices were stained with anti-MOR (UMB3) antibody to label endogenous MOR and AC3. Arrow indicates MOR(+) primary cilium. Scale bars: 10 μm (left, merge) and 5 μm (right, individual channels). (F) Representative confocal images of embryonic day 18 cultured rat habenula neurons stained with antibodies against MOR and AC3 (top) or MOR and ARL13B (bottom). Arrows indicate MOR(+) primary cilia. Scale bars: 20 μm (left, merge) and 5 μm (right, individual channels). For staining controls, see Figure S1. (G) 3D-rendered visualization of ARL13B (F, bottom) rotated 90° depicts side view of primary cilium co-localized with MOR. For full visualization of 3D rendering of samples from (F), see Videos S1 and S2.
Figure 2.
Figure 2.. MOR cilia targeting in IMCD3 cells is sensitive to modification of the receptor’s C-tail and is specific to MORs
(A) Schematics and representative confocal images of IMCD3 cells transiently expressing FLAG-tagged MOR-Venus, MOR, or MOR+linker (GSIAT, yellow hexagon). Cilia were stained with anti-ARL13B antibody. Arrows indicate cilia-localized receptor. Cells were incubated with anti-M1 (FLAG) antibody conjugated to Alexa Fluor 647 to label surface receptor prior to fixation and permeabilization. (B) Fold enrichment was calculated by dividing the background-subtracted receptor ciliary fluorescence by the background-subtracted plasma membrane (PM) fluorescence. MOR+linker was significantly increased by the linker extension as compared to MOR and MOR-Venus. One-way ANOVA (**p = 0.002) with Tukey’s multiple comparisons test; data are represented as mean ± SEM from 3 independent experiments, 30–48 cells; **p < 0.01. For lower-magnification and expression controls, see Figure S2. (C) Representative confocal images of transiently transfected IMCD3 cells expressing MOR, MOR+linker, or MOR+5 alanines assessed and measured as done for (A) and (B). (D) MOR cilia enrichment is completely lost upon replacement of the linker with alanines. One-way ANOVA (*p = 0.014) with Dunnett’s multiple comparisons test; data are represented as mean ± SEM from 3 independent experiments, 32–39 cells; *p < 0.05. (E) Representative confocal images of IMCD3 cells transiently expressing FLAG-tagged MOR, DOR, and KOR ± linker assessed and measured as done for (A) and (B). (F) MOR cilia enrichment is significantly enhanced by the C-tail linker, but DOR and KOR are not. Two-way ANOVA interaction ***p = 0.0003; main effect of receptor ***p = 0.0004; main effect of linker ***p = 0.0010. Tukey’s multiple comparisons test; data are represented as mean ± SEM from 3 independent experiments, 31–53 cells; ***p = 0.0001. Scale bars: 5 μm. Arrows indicate cilia-localized receptor.
Figure 3.
Figure 3.. The MOR conditional cilia targeting determinant is in its C-tail
(A) Representative confocal images of IMCD3 cells transiently transfected with the indicated FLAG-tagged MORs. Cells were labeled with M1–647 antibody and fixed, and cilia were labeled with ARL13B. (B) Quantification of receptor cilia enrichment indicates that MOR+linker and MOR(DOR-ICL3)+linker chimera have significantly higher enrichment in cilia compared to MOR, whereas MOR(DOR-C-tail)+linker does not. One-way ANOVA (***p = 0.0007) with Dunnett’s multiple comparisons; data are represented as mean ± SEM from 3 independent experiments, 29–36 cells; *p < 0.05 and ***p < 0.001. (C) Representative confocal images of transiently transfected IMCD3 cells expressing MOR, MOR+linker, or MOR(381T)+linker. Cells were incubated with M1–647 antibody, fixed, and stained with anti-ARL13B to identify primary cilia. (D) Quantification of receptor cilia enrichment revealed that deleting the MOR distal 17 amino acids completely abolishes cilia enrichment, One-way ANOVA (*p = 0.011) with Tukey’s multiple comparisons test; data are represented as mean ± SEM from 3 independent experiments, 45–58 cells; *p < 0.05. (E) Representative confocal images of IMCD3 cells transiently expressing the indicated constructs and labeled as described above. (F) Fold enrichment quantification of receptor cilia expression determined that adding the last 17 amino acids of MOR to DOR significantly enhanced DOR cilia enrichment. See Figure S3 for plasma membrane localization validation of constructs. One-way ANOVA (***p = 0.0004) with Dunnett’s multiple comparisons test; data are represented as mean ± SEM from 3 independent experiments, 41–51 cells; *p < 0.05 and ***p < 0.001. Scale bars: 5 μm. Arrows indicate cilia-localized receptor.
Figure 4.
Figure 4.. Cilia targeting directed in cis by the MOR C-tail requires TULP3 in trans
(A) Representative confocal images of IMCD3 co-transfected with MOR+linker and either TULP3-EGFP or truncation mutant, TULP3(201T)-EGFP. Cells were fixed, permeabilized, and stained with unconjugated M1 FLAG antibody to label receptor and ARL13B antibody to mark cilia. EGFP expression was confirmed. (B) Quantification of fold receptor enrichment in cilia revealed that co-expression of the dominant-negative TULP3 mutant significantly reduced MOR+linker cilia enrichment. Student’s t test; data are represented as mean ± SEM from 3 independent experiments, 43–44 cells; *p < 0.05. (C) Representative images of wild-type (left) and TULP3-knockout (KO) #1 (right) IMCD3 cells transiently transfected with MOR+linker. Cells were fixed and stained with anti-FLAG and anti-AcTub (acetylated tubulin) antibodies. (D) MOR+linker cilia enrichment was more significantly reduced in TULP3-KO #1 IMCD3 cells than in wild-type cells (see also Figure S4). Student’s t test; **p < 0.0015; data are represented as mean ± SEM; n = 3 experiments, 33–40 cells. Scale bars: 5 μm. Arrows indicate cilia-localized receptor. (E) Proposed model depicting MOR delivery to the primary cilium. The cytoplasmic sequence “LENLEAE” that facilitates MOR recycling overlaps with the sequence “RTNHQLENLEAETAPLP” required for cilia delivery (purple arrow). TULP3 promotes entry into the cilium presumably via its interaction with IFT-A (intraflagellar transport complex A) (orange arrow).

References

    1. Kieffer BL, and Evans CJ (2009). Opioid receptors: from binding sites to visible molecules in vivo. Neuropharmacology 56 (Suppl 1), 205–212. 10.1016/j.neuropharm.2008.07.033. - DOI - PMC - PubMed
    1. Jullié D, Stoeber M, Sibarita JB, Zieger HL, Bartol TM, Arttamangkul S, Sejnowski TJ, Hosy E, and von Zastrow M (2020). A Discrete Presynaptic Vesicle Cycle for Neuromodulator Receptors. Neuron 105, 663–677.e8. 10.1016/j.neuron.2019.11.016. - DOI - PMC - PubMed
    1. Reeves KC, Shah N, Muñoz B, and Atwood BK (2022). Opioid Receptor-Mediated Regulation of Neurotransmission in the Brain. Front. Mol. Neurosci. 15, 919773. 10.3389/fnmol.2022.919773. - DOI - PMC - PubMed
    1. Stoeber M, Jullié D, Lobingier BT, Laeremans T, Steyaert J, Schiller PW, Manglik A, and von Zastrow M (2018). A Genetically Encoded Biosensor Reveals Location Bias of Opioid Drug Action. Neuron 98, 963–976.e5. 10.1016/j.neuron.2018.04.021. - DOI - PMC - PubMed
    1. Jimenez-Vargas NN, Gong J, Wisdom MJ, Jensen DD, Latorre R, Hegron A, Teng S, DiCello JJ, Rajasekhar P, Veldhuis NA, et al. (2020). Endosomal signaling of delta opioid receptors is an endogenous mechanism and therapeutic target for relief from inflammatory pain. Proc. Natl. Acad. Sci. USA 117, 15281–15292. 10.1073/pnas.2000500117. - DOI - PMC - PubMed

Publication types

Substances