. 2024 May 28;43(5):114169.
doi: 10.1016/j.celrep.2024.114169. Epub 2024 Apr 27.

Smooth muscle cell-derived Cxcl12 directs macrophage accrual and sympathetic innervation to control thermogenic adipose tissue

Affiliations

Smooth muscle cell-derived Cxcl12 directs macrophage accrual and sympathetic innervation to control thermogenic adipose tissue

Derek Lee et al. Cell Rep. .

Abstract

Sympathetic innervation of brown adipose tissue (BAT) controls mammalian adaptative thermogenesis. However, the cellular and molecular underpinnings contributing to BAT innervation remain poorly defined. Here, we show that smooth muscle cells (SMCs) support BAT growth, lipid utilization, and thermogenic plasticity. Moreover, we find that BAT SMCs express and control the bioavailability of Cxcl12. SMC deletion of Cxcl12 fosters brown adipocyte lipid accumulation, reduces energy expenditure, and increases susceptibility to diet-induced metabolic dysfunction. Mechanistically, we find that Cxcl12 stimulates CD301+ macrophage recruitment and supports sympathetic neuronal maintenance. Administering recombinant Cxcl12 to obese mice or leptin-deficient (Ob/Ob) mice is sufficient to boost macrophage presence and drive sympathetic innervation to restore BAT morphology and thermogenic responses. Altogether, our data reveal an SMC chemokine-dependent pathway linking immunological infiltration and sympathetic innervation as a rheostat for BAT maintenance and thermogenesis.

Keywords: CP: Immunology; CP: Metabolism; Cxcl2; brown adipocytes; macrophage; smooth muscle cells; sympathetic innervation; thermogenesis.


Conflict of interest statement

Declaration of interests The authors declare no competing interests.

Figures

Figure 1.
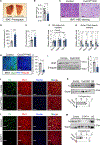
Figure 1.. Vascular SMCs are critical for BAT homeostasis and function
(A) Representative images of SMCtdTomato fate mapping within BAT sections from Sma-CreERT2/Rosa26tdTomato mice. Scale bars, 100 μm. (B) Allelic combination to generate control and DTASma mice and experimental design. Control and DTASma mice were administered one dose of tamoxifen (50 mg/kg for 2 consecutive days and analyzed 6 weeks later. (C) Flow cytometric analysis of BAT SMC number from mice described in (B) (n = 6 mice/group). (D) Photograph of BAT depots from mice described in (B). (E) BAT weight from mice described in (B) (n = 6 mice/group). (F) Representative images of H&E staining of BAT sections from mice described in (B). Scale bars, 100 μm. (G) Lipid droplet area quantification of images described in (F) (n = 3 mice/group). (H) Triglyceride levels from BAT depots from mice described in (B) (n = 6 mice/group). (I) Relative mRNA levels of thermogenic genes from mice described in (B) (n = 3 mice/group). (J) Representative images of Ucp1 immunostaining of BAT sections from mice described in (B). Scale bars, 100 μm. (K) Experimental design: control and DTASma mice were administered one dose of tamoxifen for 2 consecutive days and maintained at room temperature for 6 weeks. Subsequently, the mice were exposed to cold (6.5°C) for 24 h. (L) Intrarectal temperatures from mice described in (K) (n = 7–8 mice/group). (M) BAT weight from mice described in (K) (n = 7–8 mice/group). (N) Representative images of H&E staining of BAT sections from mice described in (K). Scale bars, 100 μm. (O) Lipid droplet area quantification of images described in (N) (n = 3 mice/group). (P) Relative mRNA levels of denoted thermogenic genes from mice described in (K) (n = 4 mice/group). Data in (C), (E), (G–I), (L), (M), (O), and (P) are represented as the mean ± SEM. Student’s unpaired t test was used to analyze denoted significance; *p < 0.03; ns, non-significant.
Figure 2.
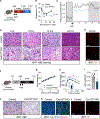
Figure 2.. BAT vascular SMCs express Cxcl12
(A) Relative mRNA levels of denoted chemokine signaling pathways in BAT from control and DTASma mice (n = 3 mice/group). (B) Cxcl12-DsRed mouse model. (C) Representative image of whole-mount DsRed immunofluorescent imaging of BAT from Cxcl12-DsRed mice. Scale bar, 100 μm. (D) Representative image of in vitro brown adipogenesis from Cxcl12-DsRed mice. Scale bar, 100 μm. (E) Representative images of Sma and DsRed immunostaining of BAT sections Cxcl12DsRed mice. Scale bars, 100 μm. (F) Representative images of in vitro brown adipogenesis treated with vehicle or recombinant murine Cxcl12 (rmCxcl12). Scale bars, 100 μm. (G) Relative mRNA levels of denoted pan-adipocyte (left) and thermogenic (right) markers from cultures described in (F) (n = 3 mice/group). (H) Experimental design for isolating and evaluating Cxcl12DsRed cells from BAT tissues. For cell culture studies, BAT SVF cells were cultured for 24 h prior to immunostaining. (I) Representative image of cultures described in (H) immunostained for Sma. Scale bar, 100 μm. (J) Quantification of Sma-Cxcl12DsRed colocalization compared to total Sma+ cells (n = 3 mice/group). (K) Representative fluorescence-activated cell sorting (FACS) plot identifying a Cxcl12DsRed/Sma+ cell population within BAT. (L) FACS analysis of Cxcl12DsRed/Sma+ cell population compared to total DsRed cell number from denoted tissues (n = 3 mice/group). (M) Cxcl12DsRed/Sma+ cell population frequency from denoted tissues (n = 3 mice/group). (N) Cxcl12DsRed/Sma+ cell population abundance from denoted tissues (n = 3 mice/group). Data in (A), (G), (J), and (L–N) are represented as the mean ± SEM. Student’s unpaired t test was used to analyze denoted significance (ns, non-significant).
Figure 3.
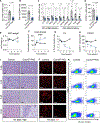
Figure 3.. SMC-derived Cxcl12 expression is necessary for BAT homeostasis
(A) Representative photograph of BAT from control and Cxcl12SmaKO mice 6 weeks post-tamoxifen. (B) BAT weight from mice described in (A) (n = 10 mice/group). (C) Representative H&E image of BAT sections from mice described in (A). Scale bars, 100 μm. (D) Lipid droplet area quantification of images described in (C) (n = 3 mice/group). (E) Triglyceride levels from BAT depots from mice described in (A) (n = 6 mice/group). (F) Relative mRNA levels of pan-adipocyte markers from BAT from mice described in (A) (n = 4 mice/group). (G) Relative mRNA levels of thermogenic genes from BAT from mice described in (A) (n = 4 mice/group). (H) Representative images of Ucp1 immunostaining of BAT sections from mice described in (A). Scale bars, 100 μm. Right: quantification of percentage Ucp1 area in BAT sections from control and Cxcl12SmaKO mice (n = 3 mice/group). (I) Representative Ucp1 immunoblot from BAT from mice described in (A). Right: quantification of immunoblot (n = 3 mice/group). (J) Representative images of TH immunostaining in BAT sections from mice described in (A). Scale bars, 100 μm. (K) Representative TH immunoblot from BAT from mice described in (A). Bottom: quantification of immunoblot (n = 3 mice/group). Adrenal gland (AG) was used as a positive TH control. (L) Representative images of TH immunostaining in BAT sections from control and DTASma male mice 6 weeks post-tamoxifen. Scale bars, 100 μm. (M) Representative TH immunoblot from BAT from mice described in (L). Bottom: quantification of immunoblot (n = 3 mice/group). AG was used as a positive TH control. Data in (B), (D–I), (K), and (M) are represented as the mean ± SEM. Student’s unpaired t test was used to analyze denoted significance. *p < 0.05; ns, non-significant.
Figure 4.
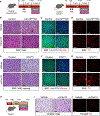
Figure 4.. Loss of Cxcl12 dampens BAT thermogenesis and susceptibility to HFD BAT remodeling
(A) Experimental design: TMX-induced control and Cxcl12SmaKO mice were maintained at room temperature for 6 weeks. Subsequently, mice were cold exposed (6.5°C) for 24 h. (B) Intrarectal temperatures from mice described in (A) (n = 8 mice/group). (C) Energy expenditure of control and Cxcl12SmaKO mice maintained at room temperature (RT) and subsequently exposed to cold (n = 8 mice/group). (D) Representative images of H&E staining of BAT sections from mice described in (A) at denoted time points throughout cold exposure. Scale bars, 100 μm. (E) Representative images of TH immunostaining of BAT sections from mice described in (A). Scale bars, 100 μm. (F) Experimental design: at P60, TMX-induced control and Cxcl12SmaKO male mice were fed an HFD for 6 weeks and phenotypically evaluated. (G) Body-weight curve from mice described in (F) (n = 8 mice/group). (H) Intraperitoneal glucose tolerance test from mice described in (F). Inset: area under the curve calculation (n = 8 mice/group). (I) BAT weight from mice described in (F) (n = 8 mice/group). (J) Representative images of H&E staining from BAT sections from mice described in (F). Scale bars, 100 μm. (K) Representative images of Ucp1 immunostaining of BAT sections from mice described in (F). Scale bars, 100 μm. (L) Representative images of TH immunostaining of BAT sections from mice described in (F). Scale bars, 100 μm. Data in (B), (C), and (G–I) are represented as the mean ± SEM. Student’s unpaired t test was used to analyze denoted significance; *p < 0.03; ns, non-significant.
Figure 5.
Figure 5.. Cxcl12 mediates BAT macrophage accrual and sympathetic innervation
(A) Relative mRNA levels of F4/80 within BAT from control and Cxcl12SmaKO mice 6 weeks post-TMX (n = 5 mice/group). (B) Flow cytometric analysis of total CD68 cell number from BAT depots from mice described in (A) (n = 4 mice/group). (C) Relative mRNA levels of denoted pro-inflammatory and anti-inflammatory markers from mice described in (A) (n = 3–4 mice/group). (D) Flow cytometric analysis of CD301 abundance from BAT depots from mice described in (A) (n = 5 mice/group). (E–K) At P60, control and Cxcl12SmaKO mice were administered TMX and evaluated 0, 1, 3, and 6 week post-TMX induction. BAT weights (E), lipid drop area quantification (F), TH fluorescent area quantification (G), CD301 abundance (H), H&E staining (I), TH immunostaining (J), and CD301 flow cytometric analysis (K) were assessed. Scale bars, 100 μm. Data in (A–H) are represented as the mean ± SEM. Student’s unpaired t test was used to analyze denoted significance; *p < 0.03.
Figure 6.
Figure 6.. Exogenous Cxcl12 restores BAT homeostasis and sympathetic innervation
(A) Experimental design: at P60, ControlSma and Cxcl12SmaKO mice (left) or ControlSma and DTASma mice (right) were administered TMX and maintained at RT for 6 weeks. Subsequently, the mice were administered one dose of rmCxcl12 (100 ng/mouse) for 10 consecutive days. (B) Representative H&E image of BAT sections from ControlSma and Cxcl12SmaKO mice described in (A). Scale bars, 100 μm. (C) Representative images of Ucp1 immunostaining of BAT sections from ControlSma and Cxcl12SmaKO mice described in (A). Scale bars, 100 μm. (D) Representative images of TH immunostaining of BAT sections from ControlSma and Cxcl12SmaKO mice described in (A). Scale bars, 100 μm. (E) Representative H&E image of BAT sections from ControlSma and DTASma mice described in (A). Scale bars, 100 μm. (F) Representative images of Ucp1 immunostaining of BAT sections from ControlSma and DTASmaKO mice described in (A). Scale bars, 100 μm. (G) Representative images of TH immunostaining of BAT sections from ControlSma and DTASmaKO mice described in (A). Scale bars, 100 μm. (H) Experimental design: at P60, RT-reared ControlSma male mice were housed at thermoneutrality (30°C) for 3 weeks. Subsequently, the mice were administered one dose of rmCxcl12 (100 ng/mouse) for 10 consecutive days. (I) Representative images of H&E staining of BAT sections from mice described in (I). Scale bars, 100 μm. (J) Representative images of TH immunostaining of BAT sections from mice described in (I). Scale bars, 100 μm.
Figure 7.
Figure 7.. Exogenous Cxcl12 restores BAT function in obesogenic models
(A) Experimental design: at P60, C57BL/6J mice were fed an HFD for 8 weeks. Subsequently, the mice were administered one dose of vehicle or rmCxcl12 (100 ng/mouse) for 10 consecutive days (n = 8 mice/group). (B) Representative images of H&E staining of BAT sections from mice described in (A). Scale bars, 100 μm. (C) Representative images of Ucp1 immunostaining of BAT sections from mice described in (A). Scale bars, 100 μm. (D) Lipid droplet area quantification of BAT H&E sections from mice described in (A) (n = 3 mice/group). (E) Relative mRNA levels of denoted thermogenic genes from mice described in (A) (n = 4 mice/group). (F) TH quantification from images described in (G) from mice described in (A) (n = 3 mice/group). (G) Representative images of TH immunostaining of BAT sections from mice described in (A). Scale bars, 100 μm. (H) Experimental design: at P60, C57BL/6J mice were fed an HFD for 8 weeks. Subsequently, the mice were administered one dose of vehicle or rmCxcl12 (100 ng/mouse) for 10 consecutive days and then exposed to cold for 24 h. (I) Intrarectal temperatures of mice described in (H) (n = 8 mice/group). (J) Energy expenditure of cold-exposed mice described (H) (n = 6 mice/group). (K) Oxygen consumption of cold-exposed mice described in (H) (n = 6 mice/group). (L) Representative images of H&E staining of BAT sections from mice described in (J). Scale bars, 100 μm. (M) Representative images of Ucp1 immunostaining of BAT sections from mice described in (J). Scale bars, 100 μm. (N) Experimental design: at P90, Ob/Ob mice were administered one dose of vehicle or rmCxcl12 (100 ng/mouse) for 10 consecutive days and subsequently exposed to cold. (O) Survival plot of Ob/Ob male mice that received vehicle or rmCxcl12 with a surviving rectal temperature of ≥27°C (n = 6 mice/group). (P) Representative images of H&E staining of BAT sections from mice described in (M). Scale bars, 100 μm. (Q) Representative images of Ucp1 immunostaining of BAT sections from mice described in (M). Scale bars, 100 μm. Data in (D–F), (I–K), and (O) are represented as the mean ± SEM. Student’s unpaired t test was used to test significance between vehicle- and rmCxcl12-treated samples, or log-rank (Mantel-Cox) test was used to test cold-temperature-survival significance; *p < 0.01.

References

    1. Cannon B, and Nedergaard J. (2004). Brown adipose tissue: function and physiological significance. Physiol. Rev 84, 277–359. 10.1152/physrev.00015.2003. - DOI - PubMed
    1. Cohen P, and Spiegelman BM (2015). Brown and Beige Fat: Molecular Parts of a Thermogenic Machine. Diabetes 64, 2346–2351. 10.2337/db15-0318. - DOI - PMC - PubMed
    1. Bartelt A, and Heeren J. (2014). Adipose tissue browning and metabolic health. Nat. Rev. Endocrinol 10, 24–36. 10.1038/nrendo.2013.204. - DOI - PubMed
    1. Nedergaard J, and Cannon B. (2014). The browning of white adipose tissue: some burning issues. Cell Metabol. 20, 396–407. 10.1016/j.cmet.2014.07.005. - DOI - PubMed
    1. Sidossis L, and Kajimura S. (2015). Brown and beige fat in humans: thermogenic adipocytes that control energy and glucose homeostasis. J. Clin. Invest 125, 478–486. 10.1172/JCI78362. - DOI - PMC - PubMed

Publication types

LinkOut - more resources