. 2024 May 28;43(5):114160.
doi: 10.1016/j.celrep.2024.114160. Epub 2024 Apr 27.

Independent compartmentalization of functional, metabolic, and transcriptional maturation of hiPSC-derived cardiomyocytes

Affiliations

Independent compartmentalization of functional, metabolic, and transcriptional maturation of hiPSC-derived cardiomyocytes

K Ashley Fetterman et al. Cell Rep. .

Abstract

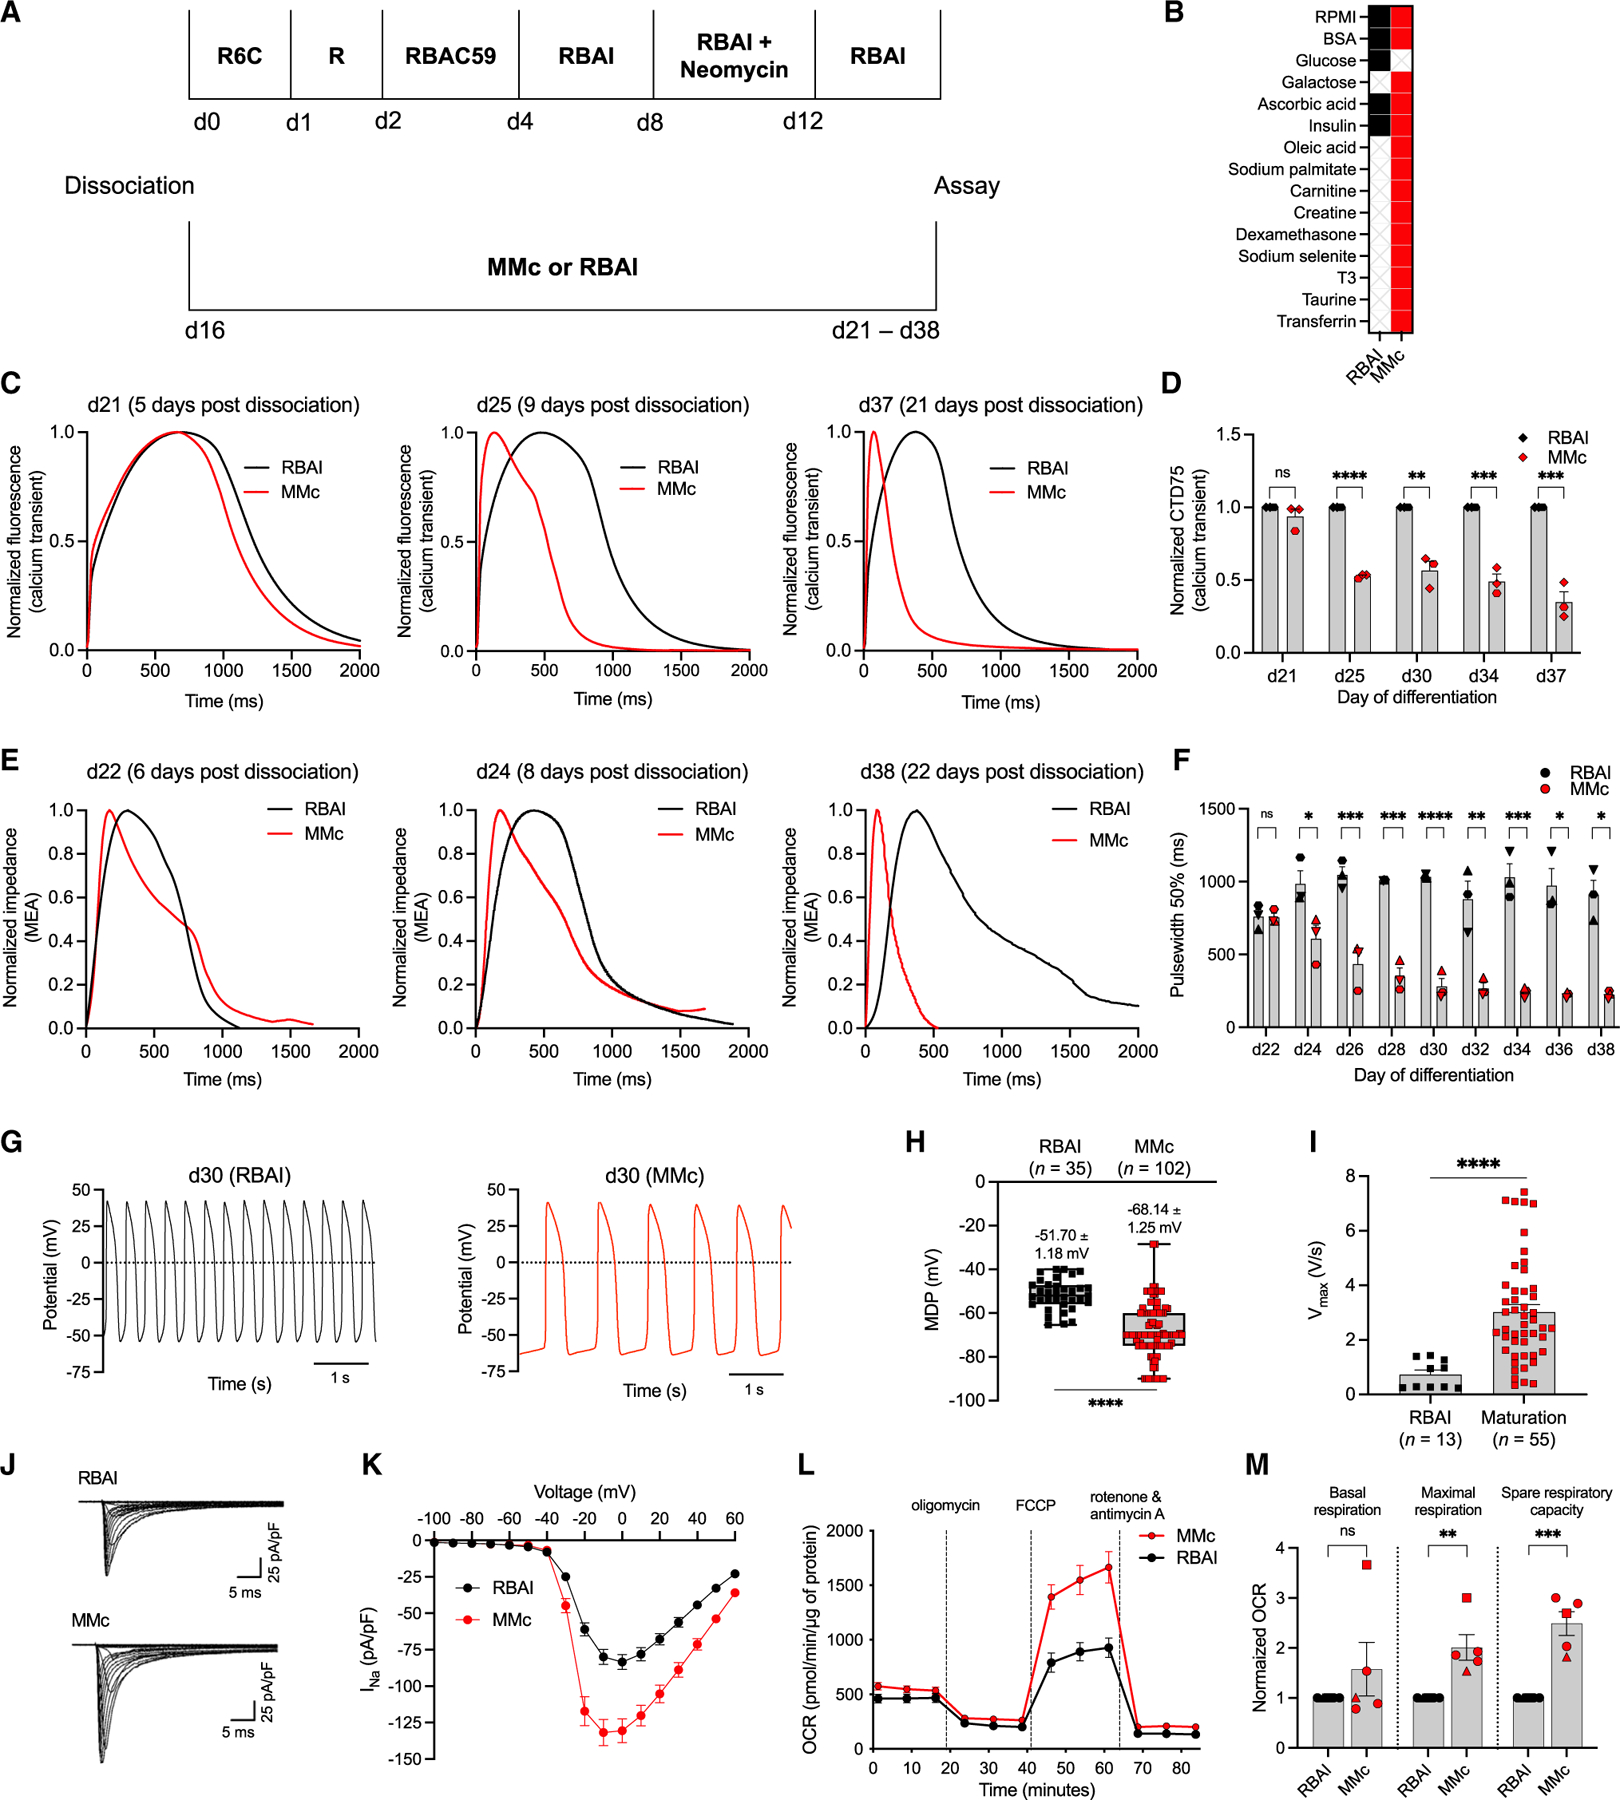
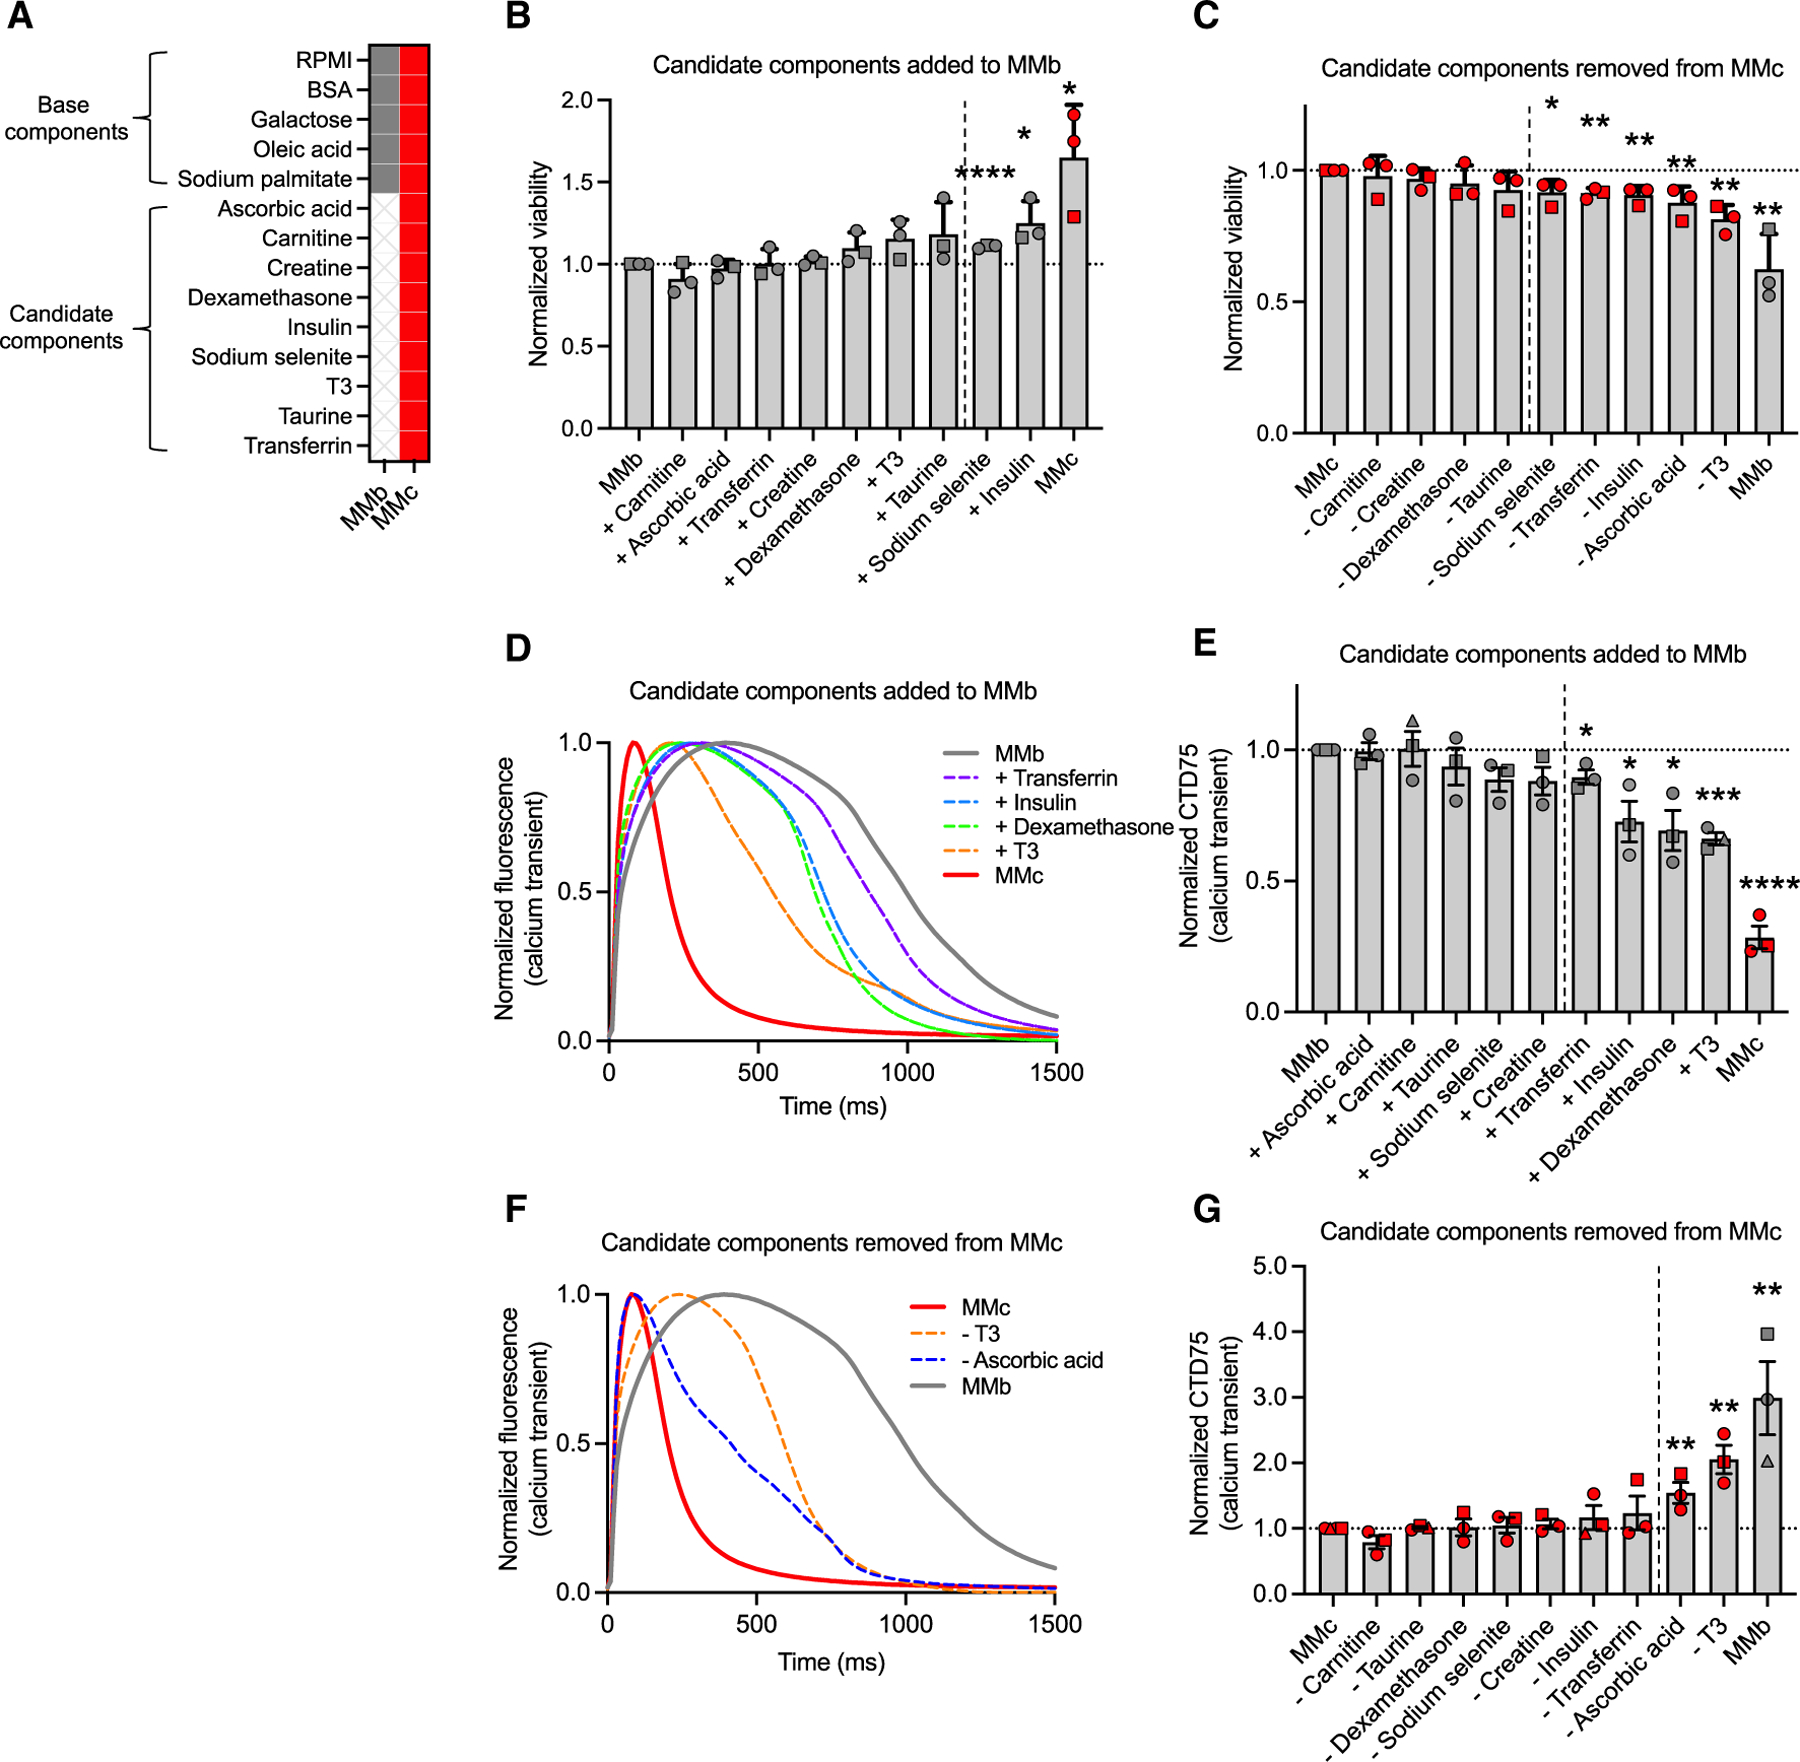
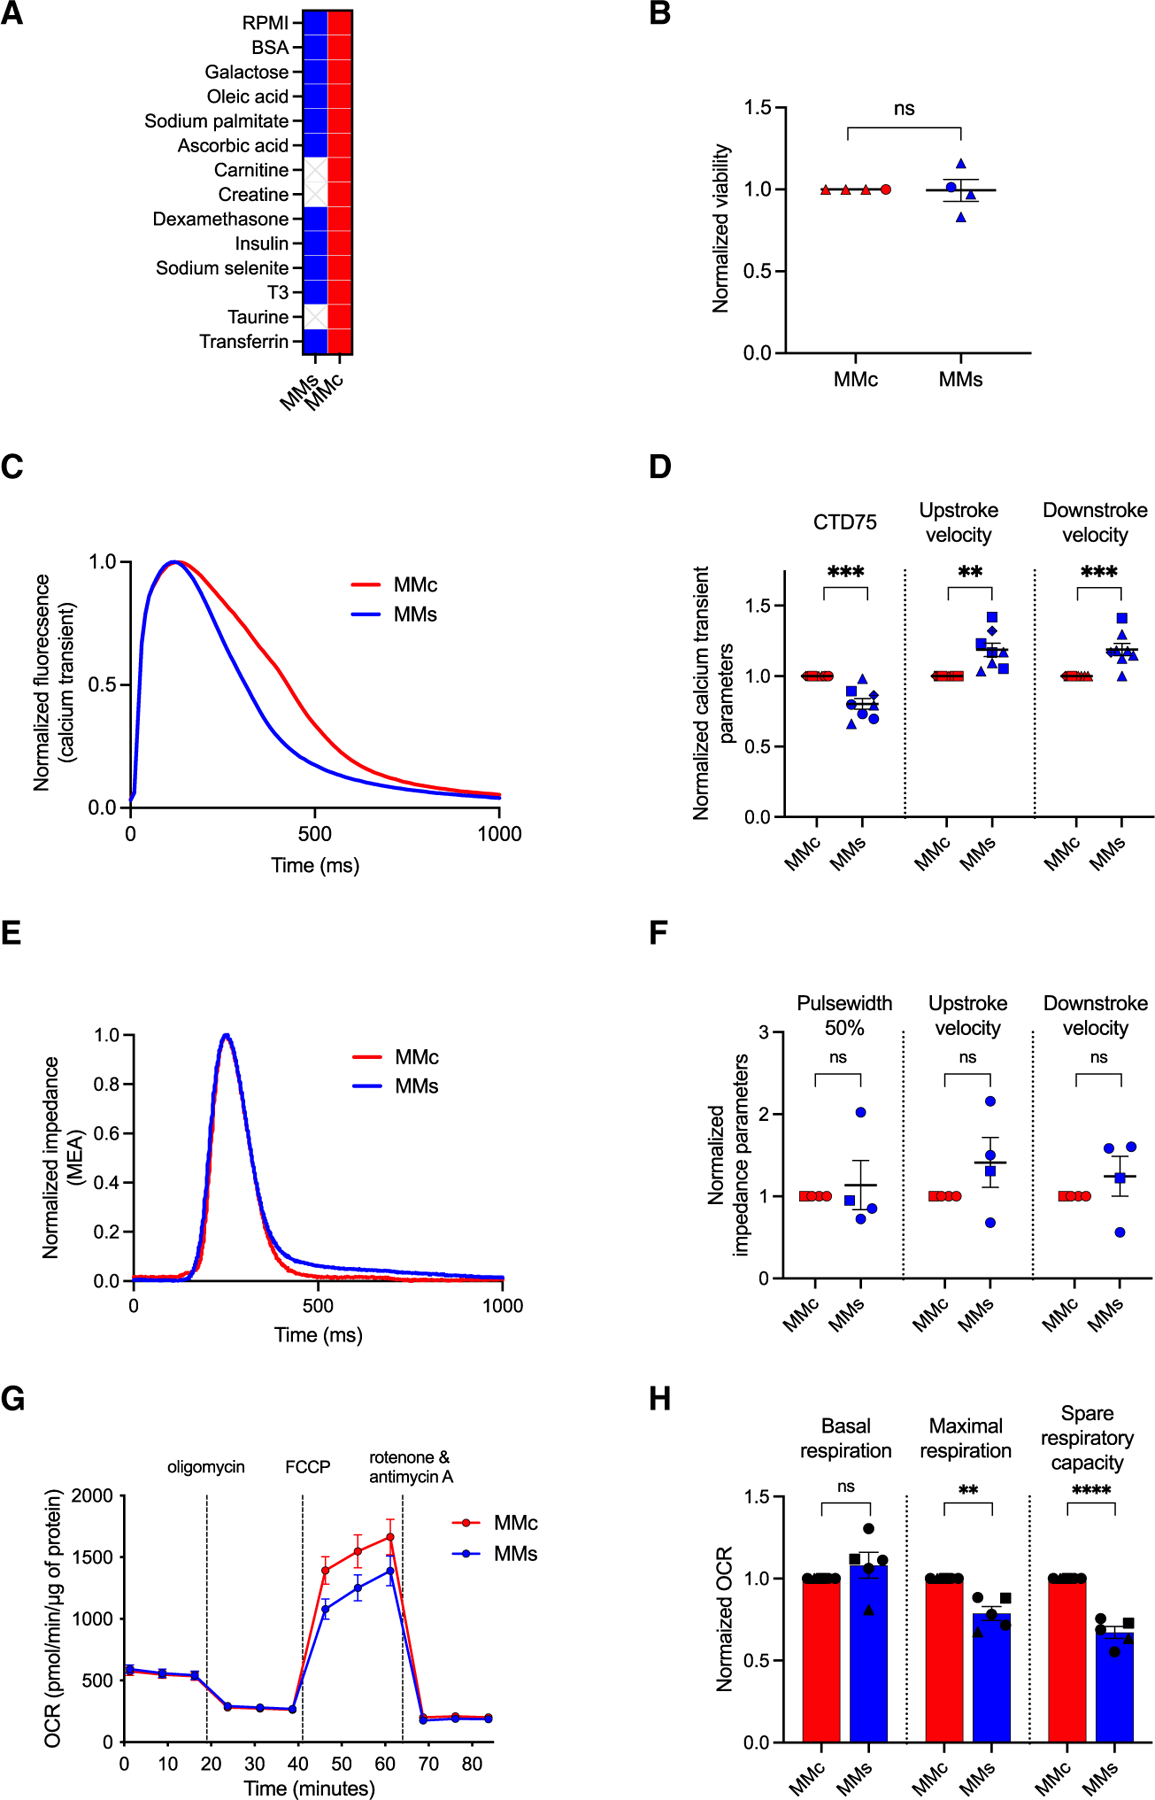
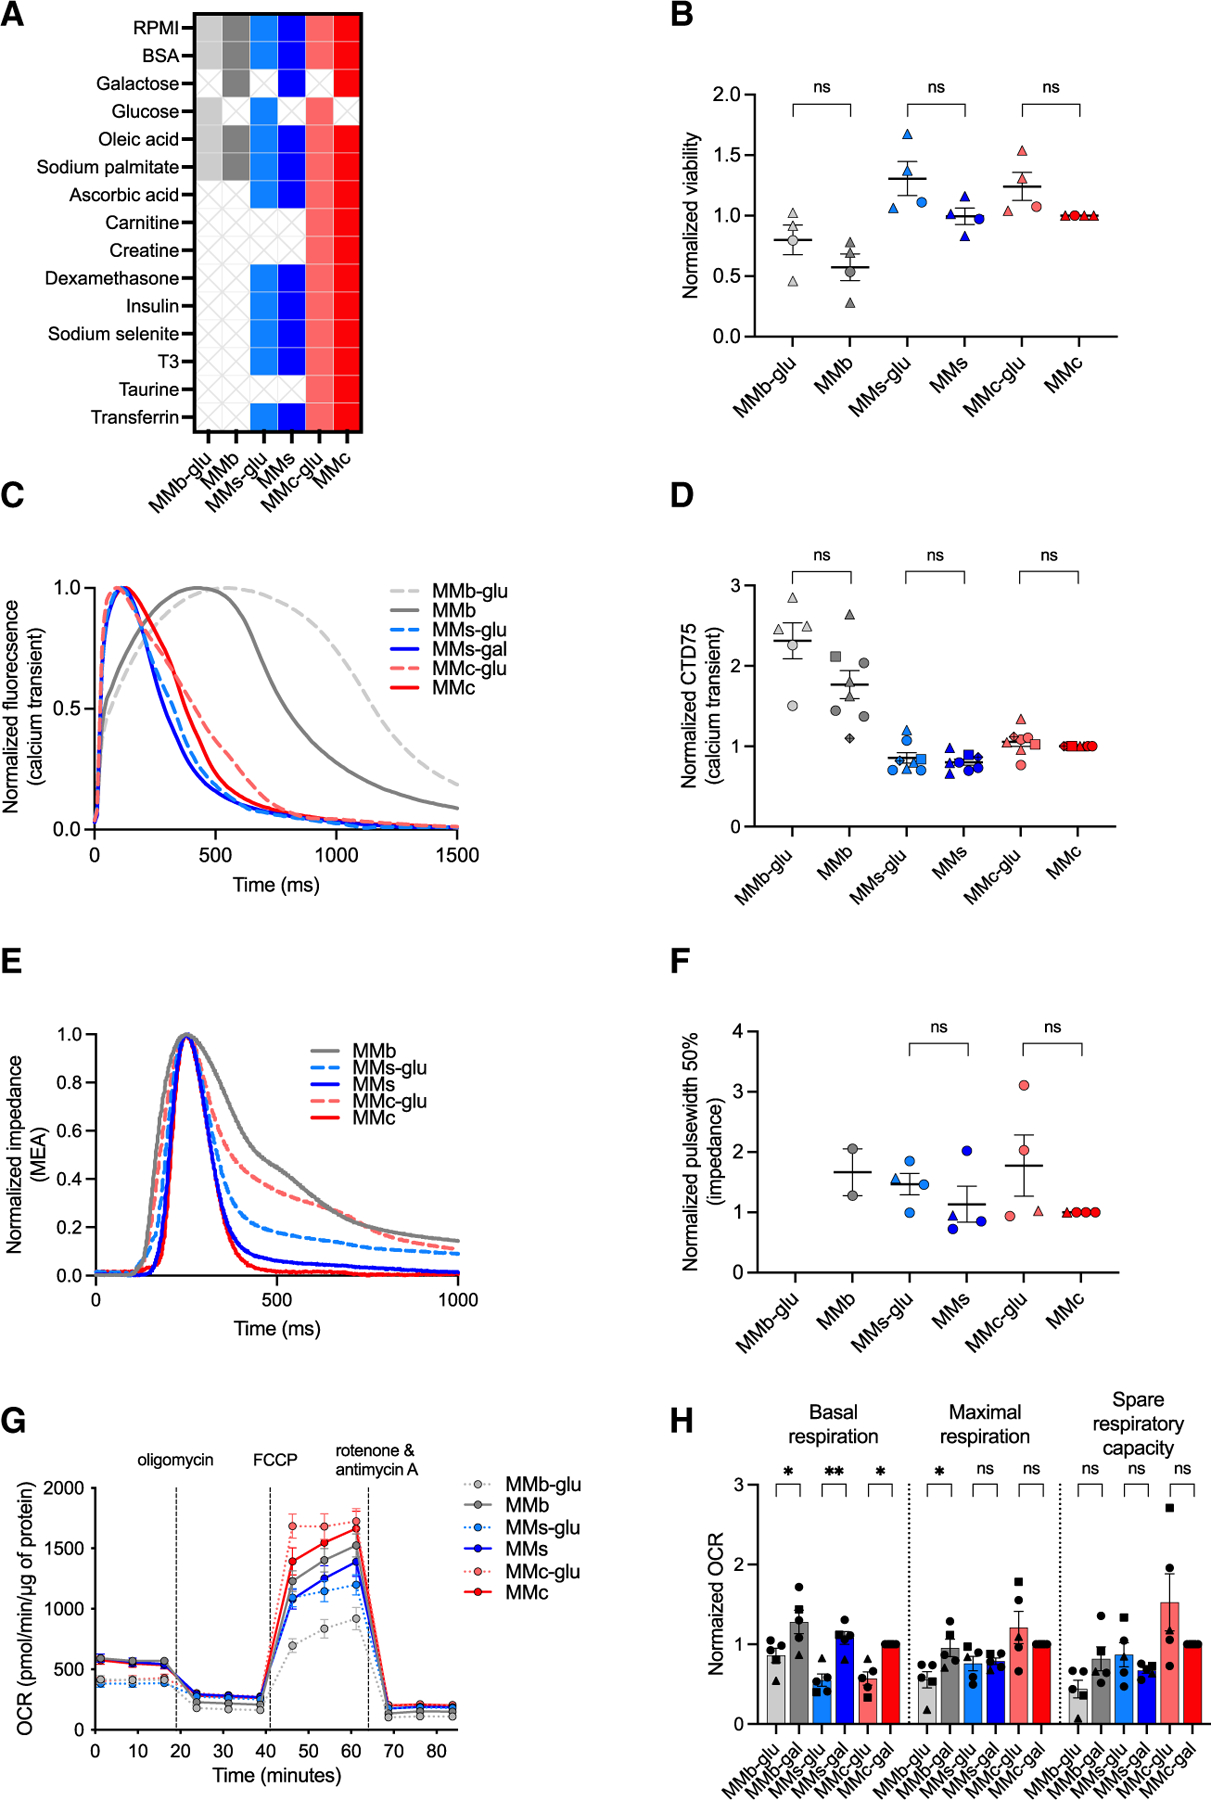
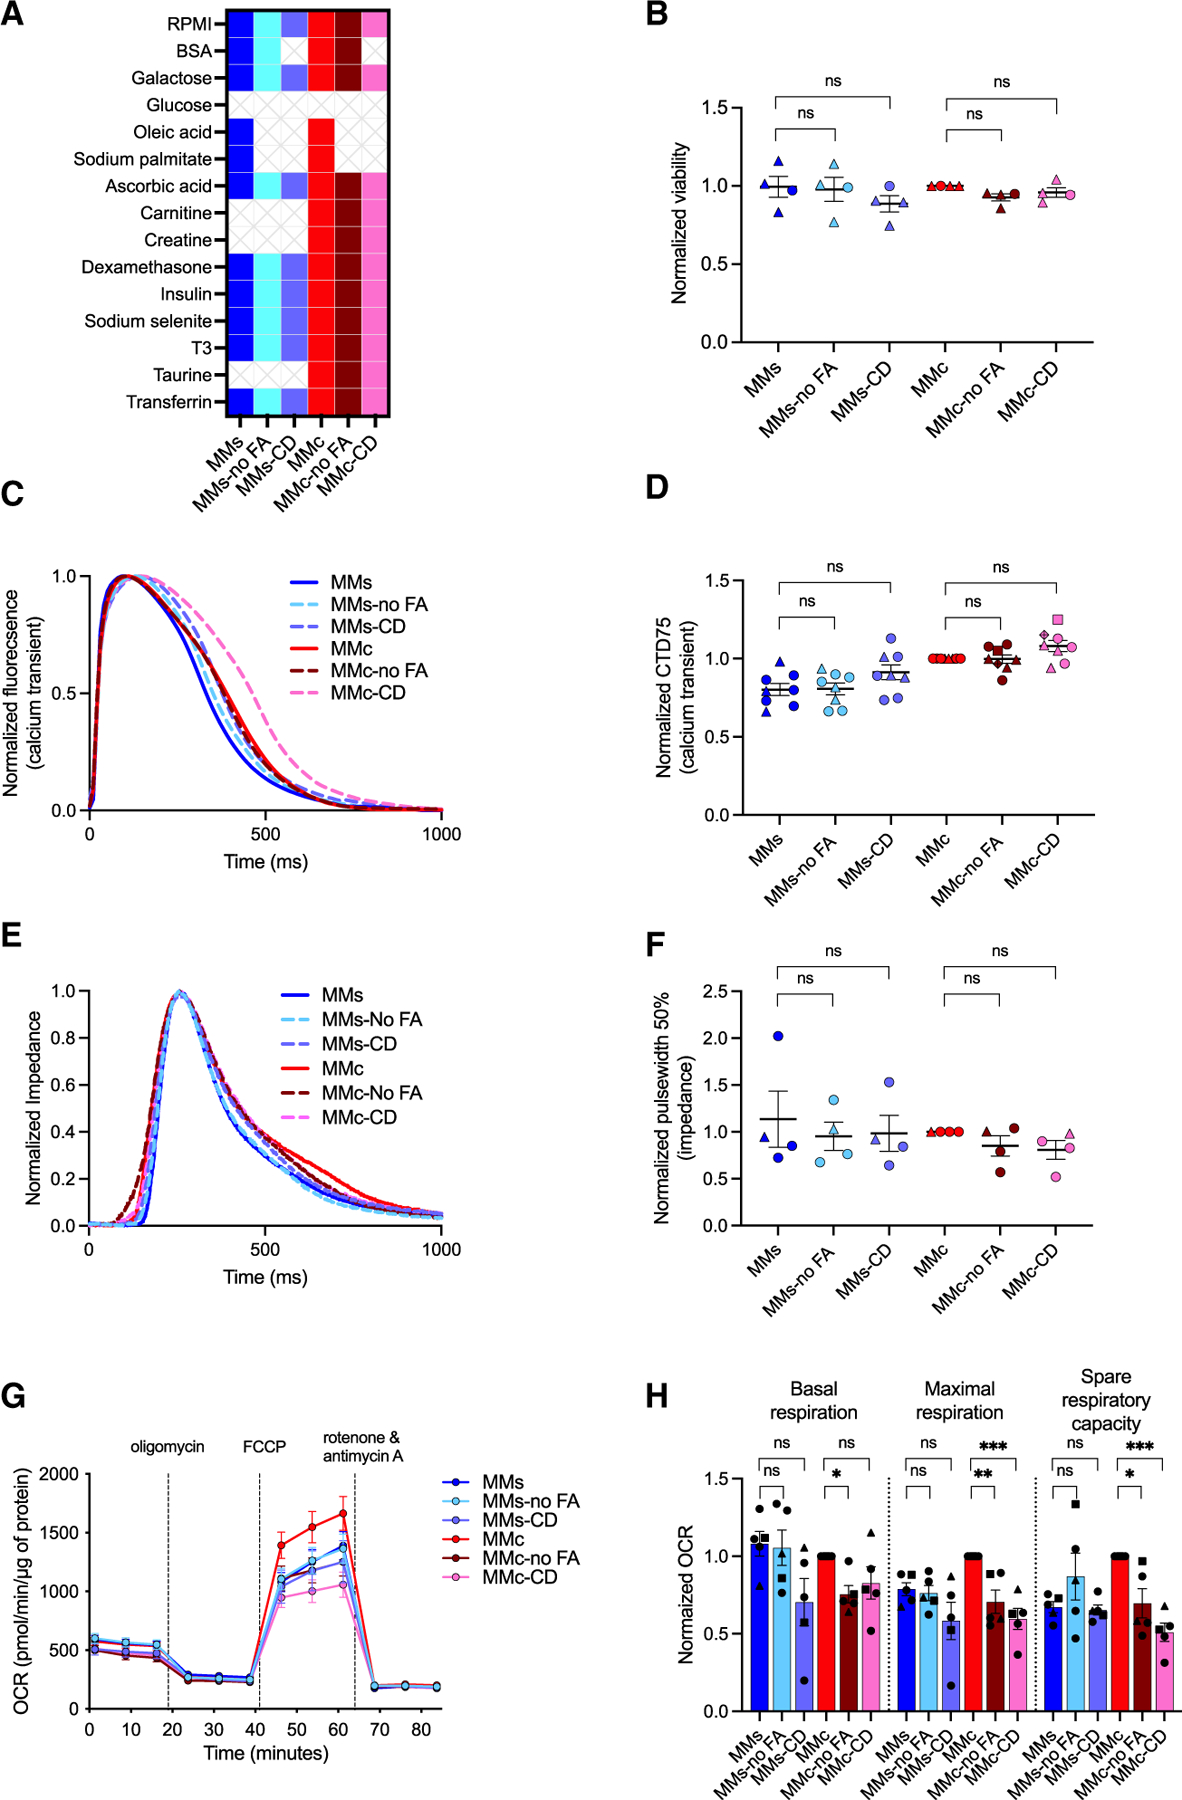
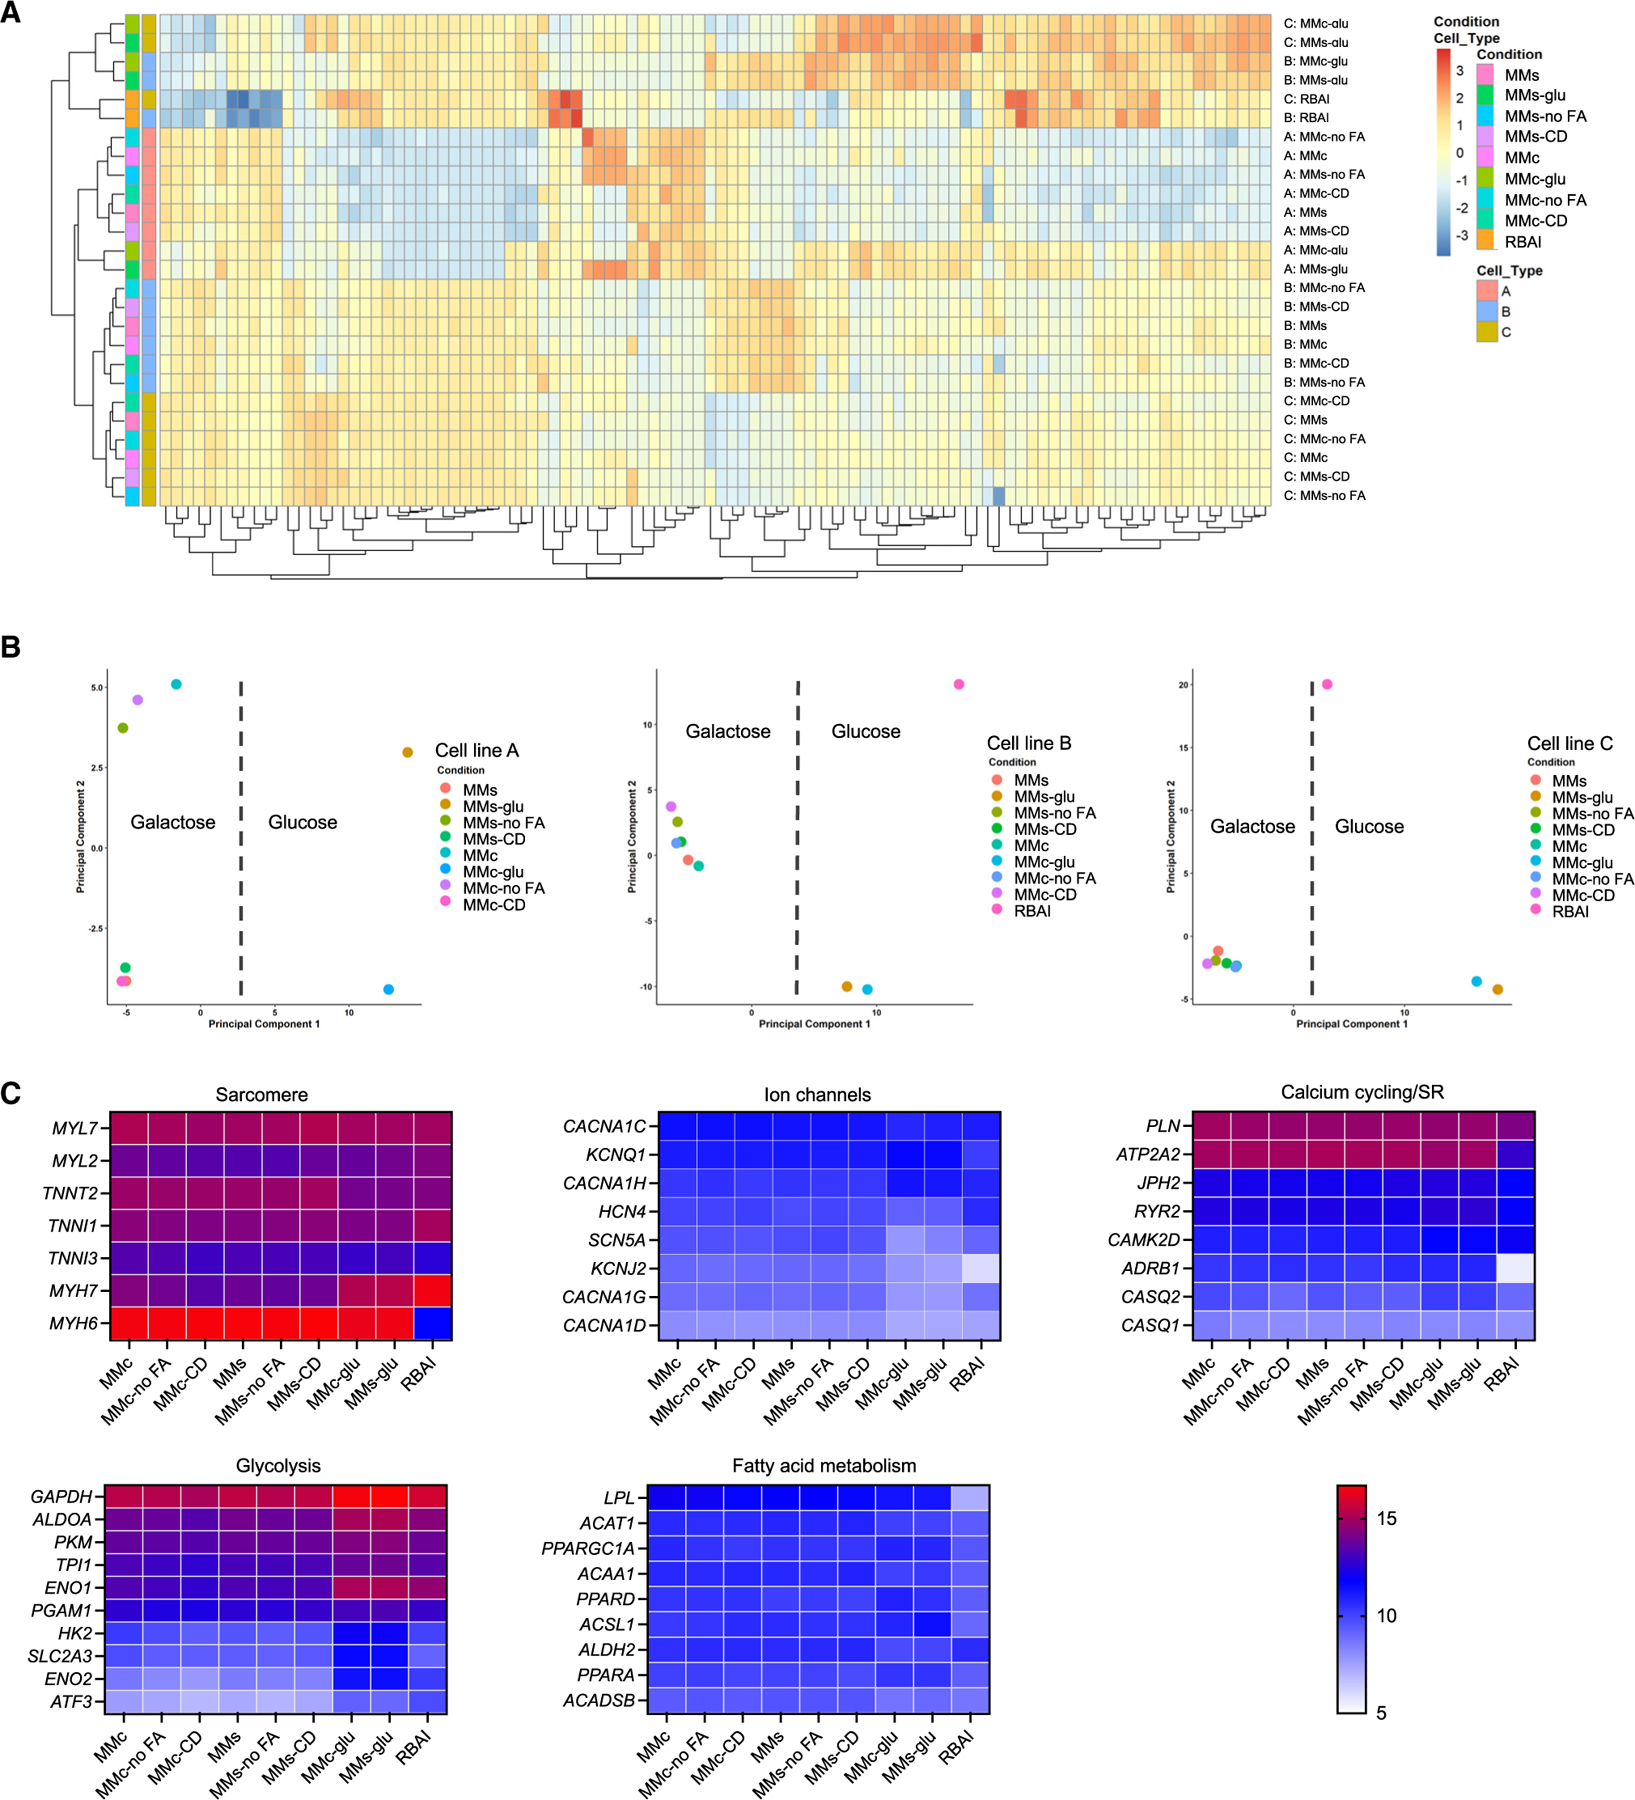
Human induced pluripotent stem cell-derived cardiomyocytes (hiPSC-CMs) recapitulate numerous disease and drug response phenotypes, but cell immaturity may limit their accuracy and fidelity as a model system. Cell culture medium modification is a common method for enhancing maturation, yet prior studies have used complex media with little understanding of individual component contribution, which may compromise long-term hiPSC-CM viability. Here, we developed high-throughput methods to measure hiPSC-CM maturation, determined factors that enhanced viability, and then systematically assessed the contribution of individual maturation medium components. We developed a medium that is compatible with extended culture. We discovered that hiPSC-CM maturation can be sub-specified into electrophysiological/EC coupling, metabolism, and gene expression and that induction of these attributes is largely independent. In this work, we establish a defined baseline for future studies of cardiomyocyte maturation. Furthermore, we provide a selection of medium formulae, optimized for distinct applications and priorities, that promote measurable attributes of maturation.

Keywords: CP: Stem cell research; Ca(2+) transients; cardiomyocytes; impedance; induced pluripotent stem cells; maturation; viability.


Conflict of interest statement

Declaration of interests The authors declare no competing interests.

Figures

Figure 1.
Figure 1.. High-throughput assays detect changes in maturation status of hiPSC-CMs
(A) Schematic of hiPSC-CM differentiation with RBAI or MMc starting at day 16 until day of assay. (B) Components of RBAI and MMc. (C) Representative spontaneous high-throughput Ca2+ transient recordings of hiPSC-CMs in RBAI or MMc. (D) CTD75 of Ca2+ transient recordings (n = 3). (E) Representative spontaneous high-throughput impedance recordings of hiPSC-CMs in RBAI or MMc. (F) Pulse width at 50% of impedance recordings (n = 3). (G) Representative spontaneous AP traces of hiPSC-CMs in RBAI or MMc using manual patchclamp. (H) Maximum diastolic potentials (MDPs) of individual cells measured in spontaneously beating hiPSC-CMs (n > 3). (I) Maximum upstroke velocities of individual cells measured in hiPSC-CMs paced at 1 Hz (n > 3). (J) Representative recordings of Nav current (INav) normalized to cell capacitance. (K) Mean INav current-voltage plot from automated patch-clamp experiments (n = 7). (L) Mean oxygen consumption rate (OCR) of hiPSC-CMs cultured in MMc or RBAI (n = 5). (M) Basal respiration, maximal respiration, and spare respiratory capacity of hiPSC-CMs cultured in MMc or RBAI (n = 5). Each data point shape indicates a different hiPSC line. Data are presented as mean ± SEM. n = experimental replicates, unpaired Student’s t test, *p ≤ 0.05, **p ≤ 0.01, ***p ≤ 0.005, ****p ≤ 0.0001; ns, not significant. See also Figure S1.
Figure 2.
Figure 2.. Optimized candidate component contribution to viability and Ca2+ transient phenotype
(A) MMb and MMc formulations. (B) Additive approach to determine changes in hiPSC-CM viability when each candidate component is added to MMb one at a time from day 20 to day 33 (n = 3). (C) Subtractive approach to determine changes in hiPSC-CM viability when each candidate component is removed from MMc one at a time from day 20 to day 33 (n = 3). (D) Representative spontaneous hiPSC-CM Ca2+ transient recordings of candidate components that significantly shorten CTD75 when added one at time to MMb from day 20 to day 35. (E) CTD75 measured when each candidate component is added to MMb (n = 3). (F) Representative spontaneous hiPSC-CM Ca2+ transient recordings of candidate components that significantly increase CTD75 when removed one at a time from MMc. (G) CTD75 measured when each candidate component is removed from MMc (n = 3). Each data point shape indicates a different hiPSC line. Data are presented as mean ± SEM. n = experimental replicates, unpaired Student’s t test, *p ≤ 0.05, **p ≤ 0.01, ***p ≤ 0.005, ****p ≤ 0.0001. All components to the right of the dashed line have p ≤ 0.05. See also Figure S3.
Figure 3.
Figure 3.. Simple maturation medium reduces mitochondrial function compared to MMc
(A) MMs and MMc formulations. (B) Viability of hiPSC-CMs cultured in MMs or MMc from day 20 to day 33 (n = 4). (C) Representative spontaneous Ca2+ transient recordings of hiPSC-CMs cultured in MMs or MMc from day 20 to day 35. (D) CTD75 measured when hiPSC-CMs are cultured in MMs or MMc (n = 8). (E) Representative paced (0.8 Hz) impedance recordings of hiPSC-CMs cultured in MMs or MMc. (F) Pulse width at 50% measured from impedance recordings of hiPSC-CMs cultured in MMs or MMc from day 20 to day 32 (n = 4). (G) Mean OCR of hiPSC-CMs cultured in MMs or MMc from day 20 to day 33 (n = 5). (H) Basal respiration, maximal respiration, and spare respiratory capacity of hiPSC-CMs cultured in MMs or MMc (n = 5). Each data point shape indicates a different hiPSC line. Data are presented as mean ± SEM. n = biological replicates, unpaired Student’s t test, *p ≤ 0.05, **p ≤ 0.01, ***p ≤ 0.005, ****p ≤ 0.0001.
Figure 4.
Figure 4.. Galactose improves mitochondrial basal respiration
(A) Glucose and galactose formulations of MMb, MMs, and MMc. (B) Viability of hiPSC-CMs cultured in glucose or galactose formulations of MMb, MMs, or MMc from day 20 to day 33 (n = 4). (C) Representative spontaneous Ca2+ transient recordings of hiPSC-CMs cultured in glucose or galactose formulations of MMb, MMs, or MMc from day 20 to day 35. (D) CTD75 of hiPSC-CMs cultured in glucose or galactose formulations of MMb, MMs, or MMc (n = 8). (E) Representative paced (0.8 Hz) impedance recordings of hiPSC-CMs cultured in glucose or galactose formulations of MMb, MMs, or MMc from day 20 to day 32. (F) Pulse width at 50% measured from impedance recordings of paced (0.8 Hz) hiPSC-CMs cultured in glucose or galactose formulations of MMb, MMs, or MMc (n = 4). (G) Mean OCR of hiPSC-CMs cultured in glucose or galactose formulations of MMb, MMs, or MMc from day 20 to day 33 (n = 5). (H) Basal respiration, maximal respiration, and spare respiratory capacity of hiPSC-CMs cultured in glucose or galactose formulations of MMb, MMs, or MMc (n = 5). Each data point shape indicates a different hiPSC line. Data are presented as mean ± SEM. n = experimental replicates, unpaired Student’s t test, *p ≤ 0.05, **p ≤ 0.01, ***p ≤ 0.005, ****p ≤ 0.0001. See also Figure S4.
Figure 5.
Figure 5.. FA contribution to metabolism but not viability, Ca2+ transient, or impedance
(A) MMb, MMs, and MMc formulations with FAs, without FAs (no FA), and chemically defined (CD). (B) Viability of hiPSC-CMs cultured in MMb, MMs, or MMc formulations ± FA and CD from day 20 to day 33 (n = 4). (C) Representative spontaneous Ca2+ transient recordings of hiPSC-CMs cultured in MMb, MMs, or MMc formulations ± FA and CD from day 20 to day 35. (D) CTD75 of hiPSC-CMs cultured in MMb, MMs, or MMc formulations ± FA and CD (n = 8). (E) Representative paced (0.8 Hz) impedance recordings of hiPSC-CMs cultured in MMb, MMs, or MMc formulations ± FA and CD from day 20 to day 32. (F) Pulse width at 50% measured from impedance recordings of hiPSC-CMs cultured in MMb, MMs, or MMc formulations ± FA and CD (n = 4). (G) OCR of hiPSC-CMs cultured in MMb, MMs, or MMc formulations ± FA and CD from day 20 to day 33 (n = 5). (H) Basal respiration, maximal respiration, and spare respiratory capacity of hiPSC-CMs cultured in MMb, MMs, or MMc ± FA and CD (n = 5). Each data point shape indicates a different hiPSC line. Data are presented as mean ± SEM. n = biological replicates, ANOVA, *p ≤ 0.05, **p ≤ 0.01, ***p ≤ 0.005, ****p ≤ 0.0001. See also Figure S5.
Figure 6.
Figure 6.. Energy substrate is key driver of hiPSC-CM transcriptomics
(A) Heatmap of top 100 expressed genes for hiPSC-CMs generated from 3 different hiPSC lines and cultured in 9 different medium formulations from day 20 to day 33. (B) Principal-component analysis (PCA) plots of hiPSC-CMs generated from 3 different hiPSC lines and cultured in 9 different medium formulations. (C) Heatmaps of genes related to metabolism and cardiac structure and function. See also Table S3.

References

    1. Karbassi E, Fenix A, Marchiano S, Muraoka N, Nakamura K, Yang X, and Murry CE (2020). Cardiomyocyte maturation: advances in knowledge and implications for regenerative medicine. Nat. Rev. Cardiol 17, 341–359. - PMC - PubMed
    1. Lundy SD, Zhu WZ, Regnier M, and Laflamme MA (2013). Structural and functional maturation of cardiomyocytes derived from human pluripotent stem cells. Stem Cell. Dev 22, 1991–2002. - PMC - PubMed
    1. Dai DF, Danoviz ME, Wiczer B, Laflamme MA, and Tian R (2017). Mitochondrial Maturation in Human Pluripotent Stem Cell Derived Cardiomyocytes. Stem Cell. Int 2017, 5153625. - PMC - PubMed
    1. Feaster TK, Cadar AG, Wang L, Williams CH, Chun YW, Hempel JE, Bloodworth N, Merryman WD, Lim CC, Wu JC, et al. (2015). Matrigel Mattress: A Method for the Generation of Single Contracting Human-Induced Pluripotent Stem Cell-Derived Cardiomyocytes. Circ. Res 117, 995–1000. - PMC - PubMed
    1. Guo Y, and Pu WT (2020). Cardiomyocyte Maturation: New Phase in Development. Circ. Res 126, 1086–1106. - PMC - PubMed

Publication types

MeSH terms