. 2024 Apr 29;9(1):105.
doi: 10.1038/s41392-024-01812-5.

A positive feedback inhibition of isocitrate dehydrogenase 3β on paired-box gene 6 promotes Alzheimer-like pathology

Affiliations

A positive feedback inhibition of isocitrate dehydrogenase 3β on paired-box gene 6 promotes Alzheimer-like pathology

Xin Wang et al. Signal Transduct Target Ther. .

Erratum in

Abstract

Impaired brain glucose metabolism is an early indicator of Alzheimer's disease (AD); however, the fundamental mechanism is unknown. In this study, we found a substantial decline in isocitrate dehydrogenase 3β (IDH3β) levels, a critical tricarboxylic acid cycle enzyme, in AD patients and AD-transgenic mice's brains. Further investigations demonstrated that the knockdown of IDH3β induced oxidation-phosphorylation uncoupling, leading to reduced energy metabolism and lactate accumulation. The resulting increased lactate, a source of lactyl, was found to promote histone lactylation, thereby enhancing the expression of paired-box gene 6 (PAX6). As an inhibitory transcription factor of IDH3β, the elevated PAX6 in turn inhibited the expression of IDH3β, leading to tau hyperphosphorylation, synapse impairment, and learning and memory deficits resembling those seen in AD. In AD-transgenic mice, upregulating IDH3β and downregulating PAX6 were found to improve cognitive functioning and reverse AD-like pathologies. Collectively, our data suggest that impaired oxidative phosphorylation accelerates AD progression via a positive feedback inhibition loop of IDH3β-lactate-PAX6-IDH3β. Breaking this loop by upregulating IDH3β or downregulating PAX6 attenuates AD neurodegeneration and cognitive impairments.


Conflict of interest statement

The authors declare no competing interests.

Figures
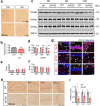
Fig. 1
Fig. 1
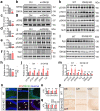
IDH3β protein levels are decreased in the brain of AD patients and the hippocampus of AD-transgenic mice. a, b Immunohistochemistry staining reveals an IDH3β reduction in the HP of patients with AD at stage III in comparison to a healthy control group. Whole bar = 500 µm, area bar = 50 µm. For each group (n = 3); Two-tailed Student’s t-test; **P < 0.001. cf Western blotting revealed an age-dependent decrease in the level of IDH3β protein in the HP of 5xFAD mice, whereas no such decline was observed in the littermates. The levels of IDH3α and IDH3γ proteins did not differ significantly from the control group. IDH3β, 6 m, P = 0.067; 9 m, **P = 0.0099; 12 m, **P < 0.001; for each group (n = 7); IDH3γ and IDH3γ, for each group (n = 4); Two-tailed Student’s t-test. g IDH3β was co-localized with neurons (NeuN), astrocytes (GFAP), and microglia (IBA1) and measured using immunofluorescence staining. Scale bar, 50 µm. h, i Immunohistochemistry staining revealed a decrease in IDH3β levels in the hippocampal subsets of 12-month-old 5xFAD mice in comparison to the control group. Area bar = 50 µm; total HP, bar = 200 µm. DG, *P = 0.014; CA1, *P = 0.044; CA3, *P = 0.013; for each group (n = 3); Two-tailed Student’s t-test. The format of mean ± SEM was utilized to display the data
Fig. 2
Fig. 2
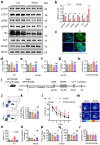
Downregulating IDH3β induces AD-like pathologies with impaired synaptic plasticity and energy metabolism. ac Application of siRNA induced 75% reduction of IDH3β protein level with 62% reduced IDH3β enzyme activity in N2a cells. For each group (n = 3); *P < 0.001, Two-tailed Student’s t-test. df Knockdown of IDH3β decreased levels of α-ketoglutarate and ATP with an increased ratio of NAD+ to NADH in N2a cells. Two-tailed Student’s t-test, d, for each group (n = 3); **P < 0.001; e, for each group (n = 4); **P < 0.001; f, for each group (n = 3); *P = 0.045. g, h Knockdown of IDH3β decreased the level of ATP synthase β-subunit (ATPB) in N2a cells. For each group (n = 3); **P = 0.006, Two-tailed Student’s t-test. i, j Knockdown of IDH3β significantly increased the phosphorylation levels of tau at S199 (*P = 0.013, n = 6), T231 (**P = 0.005, n = 3), S262 (**P = 0.002, n = 3), S404 (*P = 0.025, n = 3) and T22-positive tau (the oligomer tau, the main band with an arrow) (**P = 0.008, n = 3) in N2a cells. Two-tailed Student’s t-test. km Knockdown of IDH3β increased the phosphorylation levels of tau at S199 (**P = 0.006), T231 (**P = 0.003), S262 (**P < 0.001), S404 (**P < 0.001) and T22-positive tau (**P < 0.001) and decreased level of synaptophysin (Syp) (**P = 0.003) and postsynaptic density protein 95 (PSD95) (**P < 0.001) measured using Western blotting in C57BL/6 mice aged 2 months. For each group (n = 5); IDH3β, **P < 0.001; Two-tailed Student’s t-test. nq Knockdown of IDH3β increased the level of AT8 (pTau) measured using immunofluorescence staining (n, o) and immunohistochemistry staining (p, q) in C57BL/6 mice aged 2 months. Scale bar, 50 µm. Two-tailed Student’s t-test, (n, o), DG, **P < 0.001, CA1, *P = 0.023, CA3, **P = 0.002; for each group, (n = 3); p, q DG and CA3, **P < 0.001, CA1, **P = 0.003; for each group (n = 4). The format of mean ± SEM was utilized to display the data
Fig. 3
Fig. 3
Downregulating IDH3β induces cognitive deficits. a Behavioral tests were performed for cognitive function after knockdown of IDH3β in 2-month-old C57BL/6 mice: novel object recognition test (NOR) for spatial memory, Morris water maze test (MWM) for spatial learning and memory, and contextual fear condition test (CFT) for contextual fear memory. bd knockdown of IDH3β displayed comparable exploration time during the sample phase and exhibited decreased novelty preference in 2-month-old C57BL/6 mice in NOR. Two-tailed Student’s t-test, **P = 0.003, WT, n = 13 mice, IDH3β KD, n = 21 mice. ej IDH3β knockdown impaired spatial learning and memory in C57BL/6 mice aged 2 months, as evidenced by increased latency during 5-day training trials in MWM, decreased target platform crossings, and decreased time spent in the target quadrant during probe test on day 7. Swimming speed did not differ between the two groups. e Two-way repeated measures ANOVA test followed by the Bonferroni’s post hoc test, day 4, **P < 0.001, day 5, *P = 0.014; f Two-tailed Student’s t-test, **P = 0.001; g Two-tailed Student’s t-test, **P = 0.009; h Two-tailed Student’s t-test, *P = 0.045; WT, n = 13 mice; IDH3β KD, n = 21 mice. km Knockdown of IDH3β impaired contextual fear memory measured using CFT evidenced by the decreased freezing time in 2-month-old C57BL/6 mice. The mice did not show any difference in movement distance. Two-tailed Student’s t-test, **P = 0.009, WT, n = 13 mice, IDH3β KD, n = 21 mice. The format of mean ± SEM was utilized to display the data
Fig. 4
Fig. 4
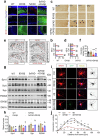
Downregulating IDH3β increases histone lactylation and promotes PAX6 expression. ac Knockdown of IDH3β resulted in an increased lactate level with an increased protein pan-lactylation in N2a cells. For each group (n = 3); b *P = 0.01; c **P = 0.002; Two-tailed Student’s t-test. d, e Knockdown of IDH3β increased histone H4 lactylation at Lys12 (*P = 0.046) and Lys8 (*P = 0.034) and H3 at Lys18 (**P = 0.009) in primary neurons. For each group (n = 3); IDH3β; **P < 0.001; Two-tailed Student’s t-test. f, g Knockdown of IDH3β increased histone H4 lactylation at Lys12 (**P < 0.001) and Lys8 (*P = 0.012) and H3 at Lys18 (**P = 0.003) in the hippocampus of C57BL/6 mice aged 2 months. For each group (n = 5); Two-tailed Student’s t-test. h, i L-lactate (sodium lactate) (20 mM for 24 h) treatment increased histone H4 lactylation at Lys12 (*P = 0.019) and Lys8 (*P = 0.0104), and H3 at Lys18 (*P = 0.019) in N2a cells. For each group (n = 3); Two-tailed Student’s t-test. j Top transcription factor binding sites using GeneCards and JARPAR public databases in the IDH3β gene promoter are PAX6, MZF1, ZBTB6, NHLH1, ZEB1, and NR3C1. km Knockdown of IDH3β significantly increased protein and mRNA levels of PAX6 in N2a cells. the protein expression levels of MZF1, ZBTB6 (the main band with an arrow), NHLH1, ZEB1 and NR3C1 were not significantly different from the control. For each group (n = 3), **P < 0.001, Two-tailed Student’s t-test; m For each group (n = 9), **P = 0.006. n, o Knockdown of IDH3β significantly increased protein levels of PAX6 in the hippocampus of C57BL/6 mice aged 2 months. For each group (n = 5), *P = 0.016, Two-tailed Student’s t-test. p, q L-lactate (sodium lactate) (20 mM for 24 h) treatment increased PAX6 expression in N2a cells. For each group (n = 3), *P = 0.003, Two-tailed Student’s t-test. r, s A significant decrease in IDH3β levels and a notable increase in PAX6 levels in the hippocampus of patients with AD compared to the control group measured by immunofluorescence staining. Scale bar, 50 µm. For each group (n = 3), IDH3β, *P = 0.012, PAX6, *P = 0.037, Two-tailed Student’s t-test. The format of mean ± SEM was utilized to display the data
Fig. 5
Fig. 5
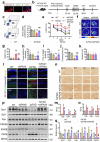
Upregulating PAX6 in turn inhibits IDH3β expression. a, b The direct binding of PAX6 to the IDH3β promoter was confirmed using ChIP assay in N2a cells, encompassing nonspecific control (NC) (a sequence located 2800 bp upstream from the transcription start site), IDH3β-ChIP1, and IDH3β-ChIP2. c In N2a cells, the direct binding capacity of PAX6 to the IDH3β promoter was validated using RT-PCR of the ChIP products. ChIP 1, *P = 0.011, ChIP 2, **P = 0.007, Two-tailed Student’s t-test; for each group (n = 9). d Binding PAX6 to IDH3β inhibited the transcription of IDH3β in a ChIP 1 and ChIP 2 element-dependent manner detected in N2a cells by dual-luciferase reporter gene assay, and both ChIP 1 and ChIP 2 mutations abolished the inhibition. ChIP 1, **P = 0.0012, ChIP 2, *P = 0.012, both, **P < 0.001; for each group (n = 3); Two-tailed Student’s t-test. eh Overexpressing PAX6 inhibited IDH3β expression while knockdown PAX6 promoted IDH3β expression in N2a cells. f **P = 0.003; h, **P < 0.001; for each group (n = 3); Two-tailed Student’s t-test. i, j L-lactate (sodium lactate) (20 mM for 24 h) treatment significantly decreased protein levels of IDH3β, this decrease was completely reversed after PAX6 knockdown in N2a cells. **P < 0.001 vs Ctrl, ##P = 0.003 vs L-lactate; for each group (n = 3); One-way ANOVA test followed by Tukey’s post hoc test. The format of mean ± SEM was utilized to display the data
Fig. 6
Fig. 6
Upregulating IDH3β ameliorates learning and memory impairments and metabolic abnormalities in 5xFAD mice. a, b Upregulating IDH3β significantly decreased the phosphorylation levels of tau at S199 (**P = 0.006), T231 (**P < 0.001), S262 (**P = 0.008), S404 (*P = 0.023) and T22-positive tau (*P = 0.048) in HEK293 cells stably expressing tau. IDH3β, **P = 0.009; for each group (n = 3); Two-tailed Student’s t-test. c The eNeonGreen non-fusion AAV virus AAV-CMV-IDH3β-2A-eNeonGreen or the empty vector was infused stereotaxically into the bilateral hippocampus of 5-month-old 5xFAD or the wild-type control mice. The expression of IDH3β in the whole hippocampus was evidenced by fluorescence imaging. Scale bar, 200 µm. d The IDH3 activity was decreased in 6-month-old 5xFAD mice and exogenous expressing IDH3β restored the activity. *P = 0.036 vs WT, #P = 0.013 vs 5xFAD; for each group (n = 3); One-way ANOVA test followed by Tukey’s post hoc test. e The α-KG level was decreased in 5xFAD mice and exogenous expressing IDH3β restored α-KG to the normal level. **P = 0.006 vs WT, ##P = 0.004 vs 5xFAD; for each group (n = 3); One-way ANOVA test followed by Tukey’s post hoc test. f ATP level was reduced in 5xFAD mice and expressing IDH3β restored the ATP level. **P < 0.001 vs WT, ## P = 0.002 vs 5xFAD; for each group (n = 3); One-way ANOVA test followed by Tukey’s post hoc test. g The level of L-lactate was increased in 5xFAD mice and exogenous expressing IDH3β restored lactate level. **P < 0.001 vs WT, ##P < 0.001 vs 5xFAD; for each group (n = 3); One-way ANOVA test followed by Tukey’s post hoc test. h The ratio of NAD + /NADH increased in 5xFAD mice and expression of IDH3β restored the ratio. All assays were carried out by following the instructions of the commercially purchased assay kits. *P = 0.018 vs WT, #P = 0.010 vs 5xFAD; for each group (n = 3); One-way ANOVA test followed by Tukey’s post hoc test. i Schematics of the experiment procedure: One month after virus expression, the mice were examined by behavioral tests for learning and memory. NOR novel object recognition test, MWM Morris water maze test, CFT contextual fear condition test. j, k Upregulating IDH3β increased the preference for novelty in 5xFAD mice measured by NOR. *P = 0.016 vs WT, ##P < 0.001 vs 5xFAD; for each group (n = 8–15); One-way ANOVA test followed by Tukey’s post hoc test. lp Upregulating IDH3β improved spatial learning and memory evidenced by decreased latency during 5-day training trials in MWM, and the decreased latency to the target platform, increased target platform crossings, and increased time spent in the target quadrant during probe test on day 7 in 5xFAD Mice. l Two-way repeated measures ANOVA test followed by Bonferroni’s post hoc test, day 2, **P = 0.008 vs WT, day 4, *P = 0.011 vs WT, day 5, *P = 0.011 vs WT; One-way ANOVA test followed by the Tukey’s post hoc test for (np), n **P < 0.001 vs WT, ##P < 0.001 vs 5xFAD; o *P = 0.032 vs WT, ##P = 0.006 vs 5xFAD; p **P < 0.001 vs WT, #P = 0.022 vs 5xFAD; for each group (n = 8–15). q, r Upregulating IDH3β improved contextual fear memory measured using CFT evidenced by the restored freezing time in 5xFAD mice. The mice did not show any difference in movement distance. **P < 0.001 vs WT, ##P < 0.001 vs 5xFAD; for each group (n = 8–15); One-way ANOVA test followed by Tukey’s post hoc test. The format of mean ± SEM was utilized to display the data
Fig. 7
Fig. 7
Upregulating IDH3β reduces Aβ plaques with improved dendrite/synapse plasticity. a, b Upregulating IDH3β reduced 6E10 (Aβ) staining in the hippocampal subsets of 5xFAD mice measured by immunofluorescence staining. Scale bar, 50 µm. **P < 0.001 vs WT, DG, and CA3, ##P < 0.001 vs 5xFAD, CA1, ##P = 0.002 vs 5xFAD; for each group (n = 3); One-way ANOVA test followed by Tukey’s post hoc test. c, d Upregulating IDH3β reduced 6E10 (Aβ) staining measured by immunohistochemistry in the hippocampal subsets of 5xFAD mice. Scale bar, 200 µm (hippocampus), 50 µm (area). **P < 0.001 vs WT, ##P < 0.001 vs 5xFAD; for each group (n = 3); One-way ANOVA test followed by Tukey’s post hoc test. e, f Upregulating IDH3β increased dendritic spines in the hippocampal neurons of 5xFAD mice measured by Golgi staining. Scale bar, 200 µm (hippocampus), 10 µm (spine). One-way ANOVA test followed by Tukey’s post hoc test, **P < 0.001 vs WT, #P = 0.015 vs 5xFAD, n = 30 neurons from three mice in each group. g, h Upregulating IDH3β restored expression levels of the synapse-associated proteins in the hippocampus of 5xFAD mice measured by Western blotting. Syn1, **P < 0.001 vs WT, #P = 0.036 vs 5xFAD; Syt1, *P = 0.010 vs WT, #P = 0.036 vs 5xFAD; Syp, *P = 0.036 vs WT, #P = 0.011 vs 5xFAD; PSD95, *P = 0.010 vs WT, #P = 0.029 vs 5xFAD; for each group (n = 6); One-way ANOVA test followed by Tukey’s post hoc test. i, j Upregulating IDH3β (lv-IDH3β-2A-GFP transfection 6 days and then Aβ treatment for 24 h) rescued Aβ-induced loss of neuronal complexity in primary neurons analyzed by Sholl analysis. Scale bar, 25 µm. One-way ANOVA test followed by Tukey’s post hoc test, 10 µm, *P = 0.021 vs Ctrl, ##P < 0.001 vs 5xFAD; 20–80 µm, **P < 0.001 vs Ctrl, ##P < 0.001 vs 5xFAD; 90 µm, **P < 0.001 vs Ctrl, ##P = 0.007 vs 5xFAD, n = 15 neurons from three mice for each group. The format of mean ± SEM was utilized to display the data
Fig. 8
Fig. 8
Downregulating PAX6 ameliorates memory deficits and AD-like pathologies in 5xFAD mice. a, b Schematics of the experiment procedure: the AAV virus AAV-U6-shRNA (PAX6)- CMV-mScarlet-WPRE or control shRNA AAV-U6-shRNA (NC2)-CMV-mScarlet-WPRE was infused stereotaxically into the bilateral hippocampus of 11-month-old 5xFAD or the wild-type mice. The expression of the virus in the whole hippocampus was evidenced by fluorescence imaging. Scale bar, 200 µm. After 1 month, the mice were examined by behavioral tests for learning and memory. NOR novel object recognition test, MWM Morris water maze test, CFT contextual fear condition test. c, d Downregulating PAX6 increased the preference for novelty in 5xFAD mice measured by NOR. **P < 0.001 vs WT, ##P = 0.002 vs 5xFAD; for each group (n = 8 - 9); One-way ANOVA test followed by Tukey’s post hoc test. ei Downregulating PAX6 improved spatial learning and memory evidenced by decreased latency during 5-day training trials in MWM, and the decreased latency to the target platform, increased target platform crossings, and increased time spent in the target quadrant during probe test on day 7 in 5xFAD mice. e Two-way repeated measures ANOVA test followed by the Bonferroni’s post hoc test, day 2, *P = 0.022 vs WT, day 3, **P = 0.002 vs WT, day 4, **P < 0.001 vs WT, day 5, **P < 0.001 vs WT, #P = 0.042 vs 5xFAD; One-way ANOVA test followed by Tukey’s post hoc test for (gi), g **P < 0.001 vs WT, ##P < 0.001 vs 5xFAD; h **P = 0.001 vs WT, #P = 0.036 vs 5xFAD; i **P = 0.003 vs WT, #P = 0.017 vs 5xFAD, n = 7–8 mice. j, k Downregulating PAX6 improved contextual fear memory measured by CFT evidenced by the restored freezing time in 5xFAD mice. The mice did not show any difference in movement distance. **P < 0.001 vs WT, ##P < 0.001 vs 5xFAD; for each group (n = 7–8); One-way ANOVA test followed by Tukey’s post hoc test. l, m Downregulating PAX6 reduced 6E10 (Aβ) staining in the hippocampal subsets of 5xFAD mice measured by immunofluorescence staining. Scale bar, 50 µm. DG, **P < 0.001 vs WT, ##P = 0.001 vs 5xFAD; CA1, **P < 0.001 vs WT, ##P < 0.001 vs 5xFAD; CA3, **P < 0.001 vs WT, ##P = 0.002 vs 5xFAD; for each group (n = 3); One-way ANOVA test followed by Tukey’s post hoc test. n, o Downregulating PAX6 reduced 6E10 (Aβ) staining measured by immunohistochemistry in the hippocampal subsets of 5xFAD mice. Scale bar, 200 µm (hippocampus), 50 µm (area). **P < 0.001 vs WT, ##P < 0.001 vs 5xFAD; for each group (n = 3); One-way ANOVA test followed by Tukey’s post hoc test. p, q Downregulating PAX6 restored expression levels of the synapse-associated proteins in the hippocampus of 5xFAD mice measured by Western blotting. Syt1, *P = 0.016 vs WT, ##P < 0.001 vs 5xFAD; for each group (n = 6). Syn1, **P < 0.001 vs WT, ##P < 0.001 vs 5xFAD, Syp, **P < 0.001 vs WT, ##P = 0.0014 vs 5xFAD, PSD95, *P = 0.023 vs WT, ## P < 0.001 vs 5xFAD, IDH3β, *P = 0.018, si-PAX6 vs WT, *P = 0.015, 5xFAD vs WT, #P = 0.037 vs 5xFAD; PAX6, **P < 0.001 vs WT, ##P < 0.001 vs 5xFAD; for each group (n = 3); One-way ANOVA test followed by Tukey’s post hoc test. The format of mean ± SEM was utilized to display the data
Fig. 9
Fig. 9
Working model showing how IDH3β-lactate-PAX6-IDH3β forms a positive feedback loop and how this vicious feedback loop drives the AD pathogeneses. Blocking the vicious feedback loop by upregulating IDH3β or downregulating PAX6 restores the homeostatic state and ameliorates AD pathology. La lactate. TCA tricarboxylic acid cycle

References

    1. Ren R, et al. The China Alzheimer report 2022. Gen Psychiatr. 2022;35:e100751. doi: 10.1136/gpsych-2022-100751. - DOI - PMC - PubMed
    1. Bao J, et al. BACE1 SUMOylation increases its stability and escalates the protease activity in Alzheimer’s disease. Proc. Natl Acad. Sci. USA. 2018;115:3954–3959. doi: 10.1073/pnas.1800498115. - DOI - PMC - PubMed
    1. Liu Q, et al. Acetylated tau exacerbates learning and memory impairment by disturbing with mitochondrial homeostasis. Redox Biol. 2023;62:102697. doi: 10.1016/j.redox.2023.102697. - DOI - PMC - PubMed
    1. Wang X, et al. T217-phosphorylation exacerbates tau pathologies and tau-induced cognitive impairment. J. Alzheimers Dis. 2021;81:1403–1418. doi: 10.3233/JAD-210297. - DOI - PubMed
    1. Zheng J, et al. Interneuron accumulation of phosphorylated tau impairs adult hippocampal neurogenesis by suppressing GABAergic transmission. Cell Stem Cell. 2020;26:331–345.e336. doi: 10.1016/j.stem.2019.12.015. - DOI - PubMed

Publication types