. 2024 Apr 15;15(4):735-757.
doi: 10.4239/wjd.v15.i4.735.

Novel insights into immune-related genes associated with type 2 diabetes mellitus-related cognitive impairment

Affiliations

Novel insights into immune-related genes associated with type 2 diabetes mellitus-related cognitive impairment

Jing Gao et al. World J Diabetes. .

Abstract

Background: The cognitive impairment in type 2 diabetes mellitus (T2DM) is a multifaceted and advancing state that requires further exploration to fully comprehend. Neuroinflammation is considered to be one of the main mechanisms and the immune system has played a vital role in the progression of the disease.

Aim: To identify and validate the immune-related genes in the hippocampus associated with T2DM-related cognitive impairment.

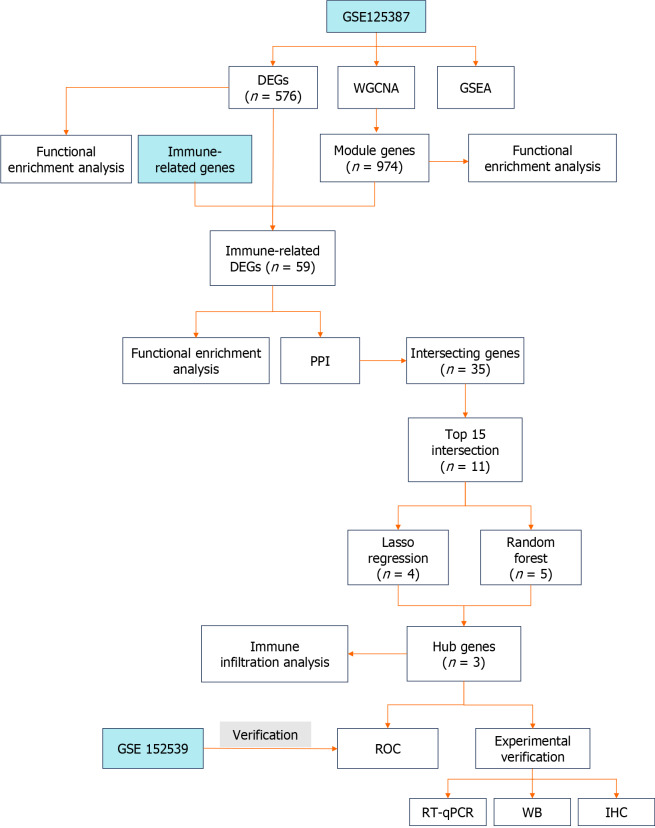
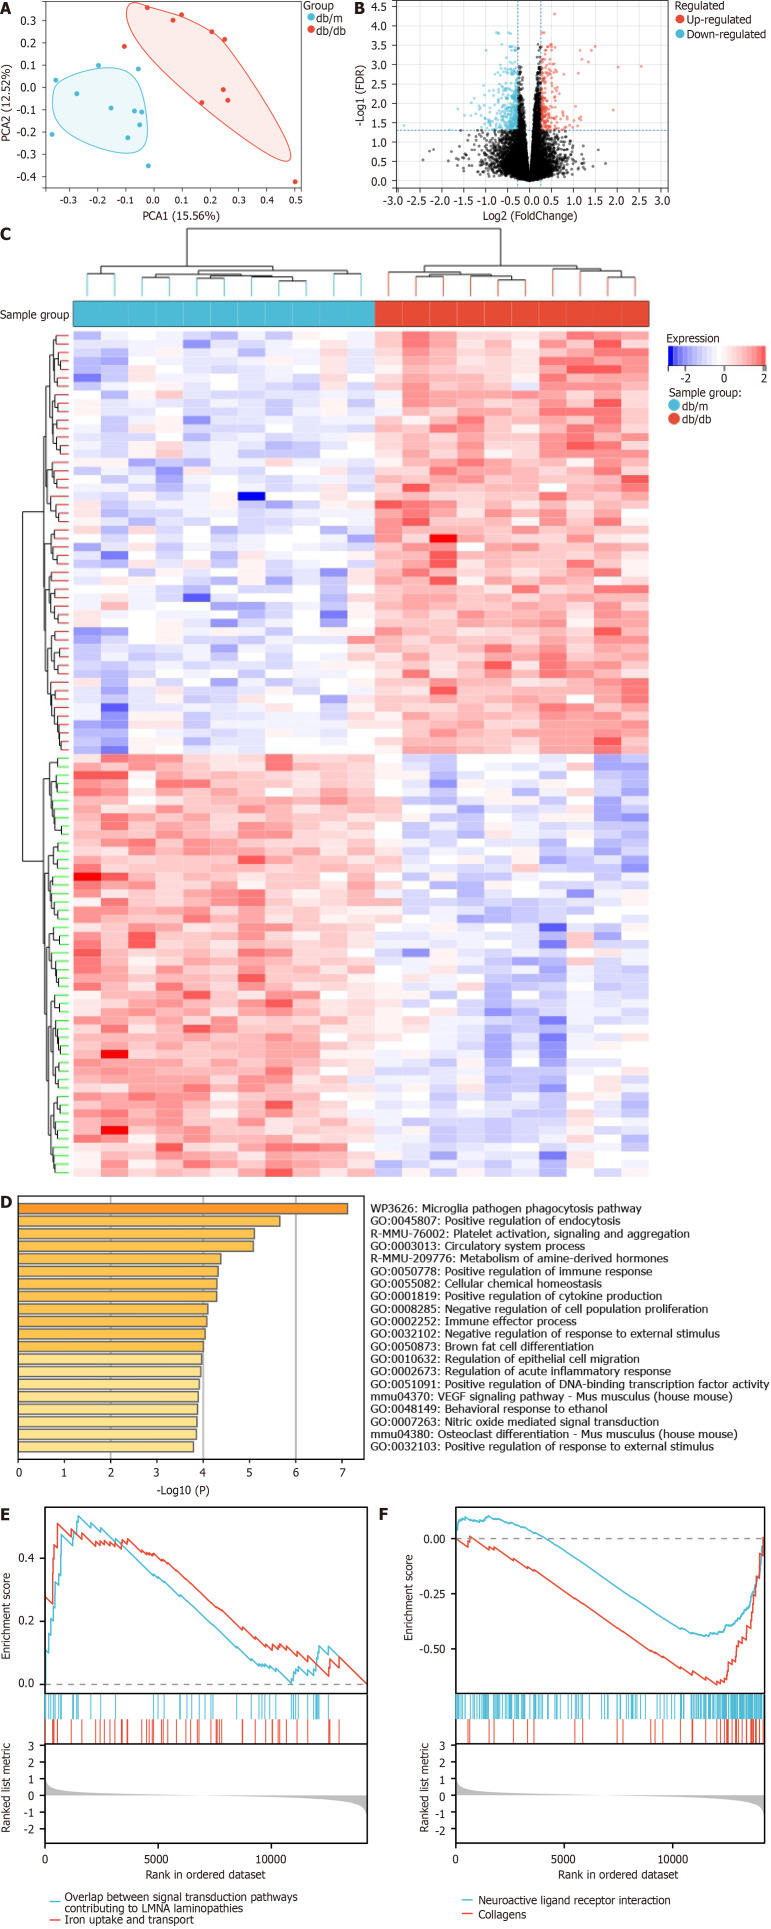
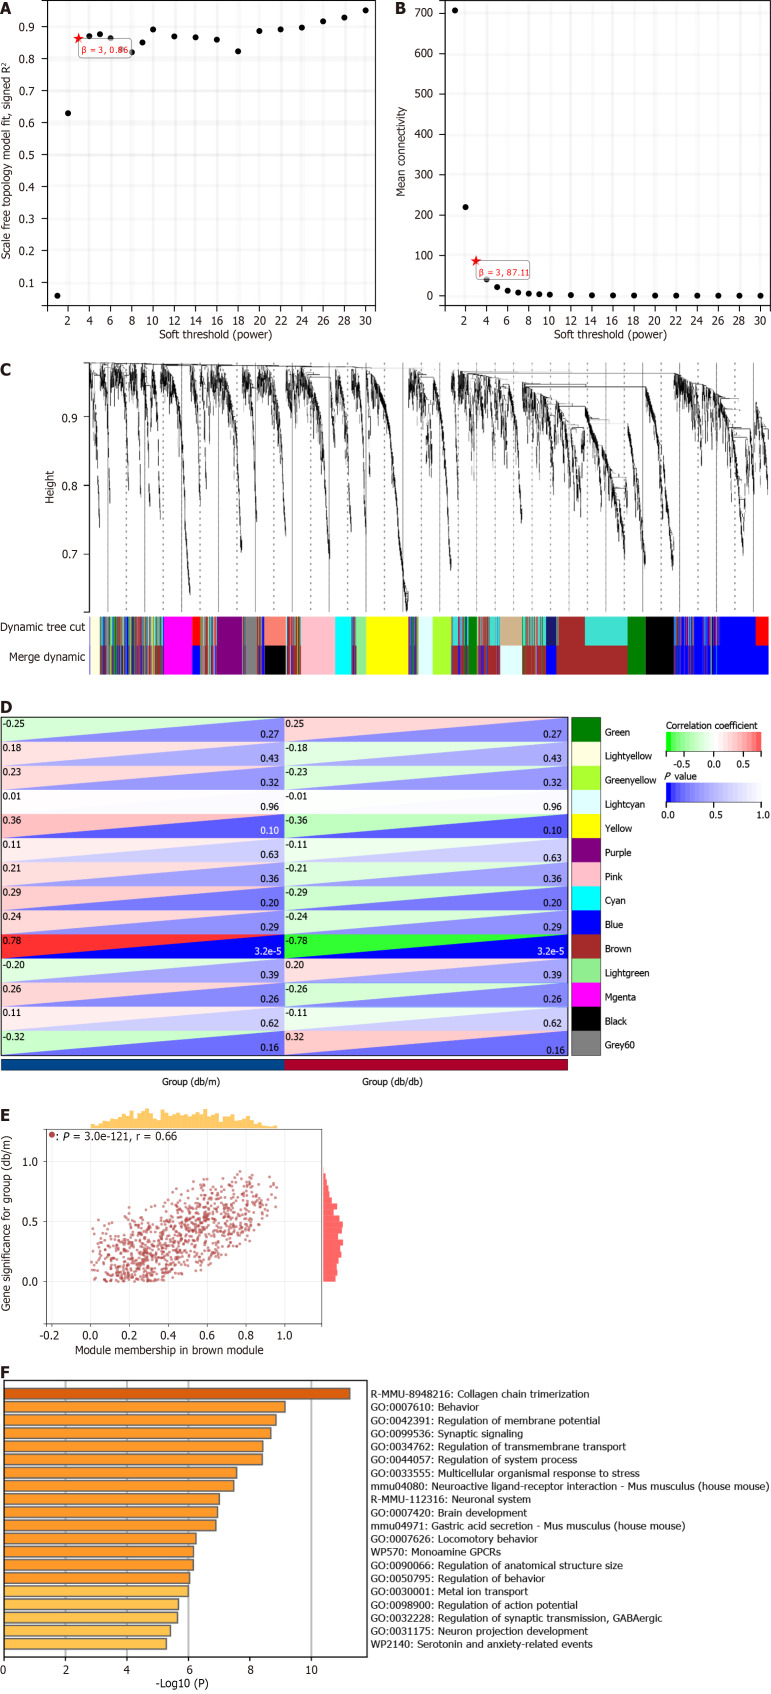
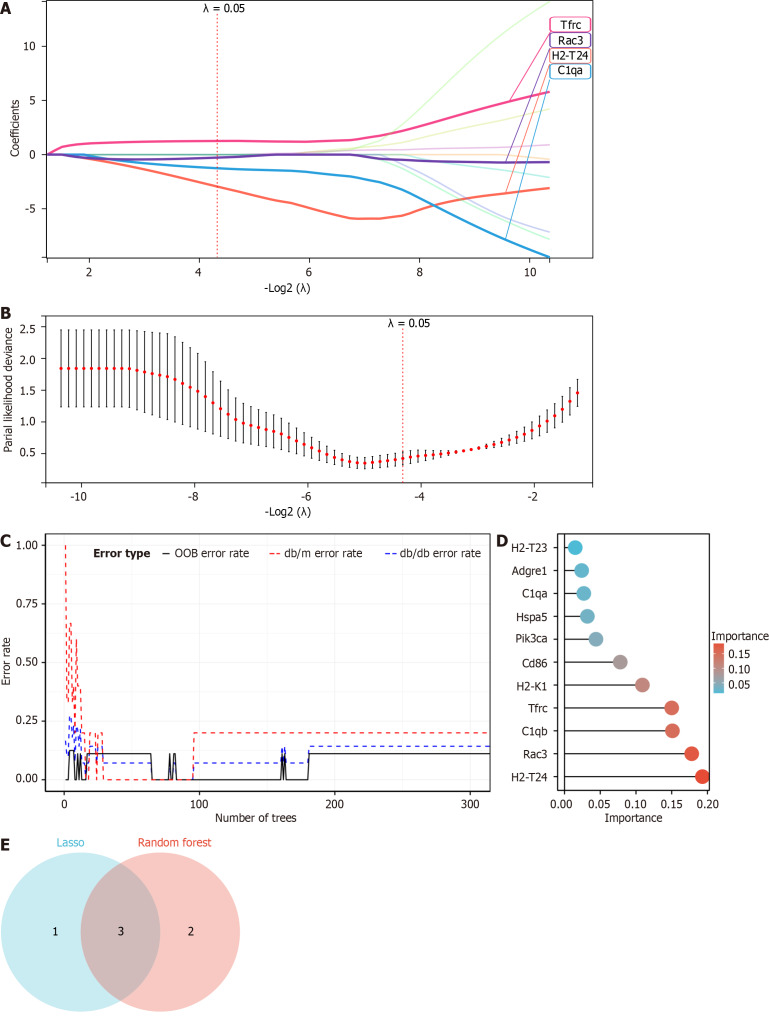
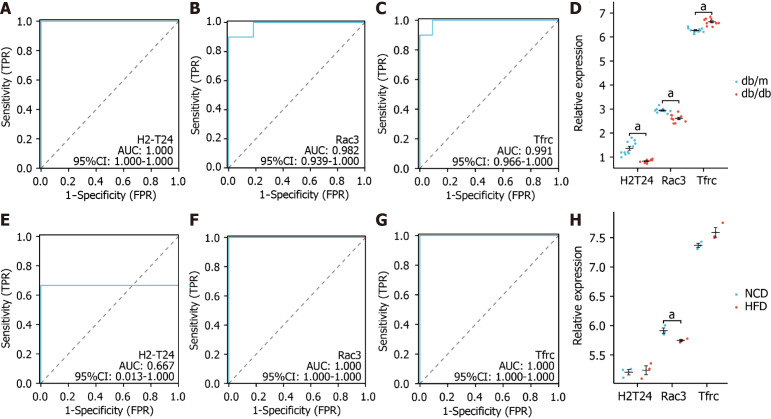
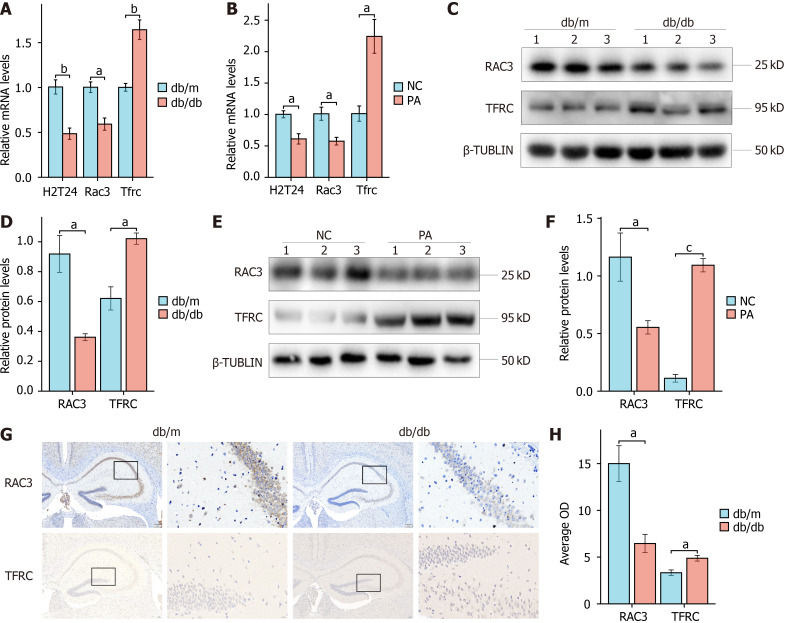
Methods: To identify differentially expressed genes (DEGs) between T2DM and controls, we used data from the Gene Expression Omnibus database GSE125387. To identify T2DM module genes, we used Weighted Gene Co-Expression Network Analysis. All the genes were subject to Gene Set Enrichment Analysis. Protein-protein interaction network construction and machine learning were utilized to identify three hub genes. Immune cell infiltration analysis was performed. The three hub genes were validated in GSE152539 via receiver operating characteristic curve analysis. Validation experiments including reverse transcription quantitative real-time PCR, Western blotting and immunohistochemistry were conducted both in vivo and in vitro. To identify potential drugs associated with hub genes, we used the Comparative Toxicogenomics Database (CTD).

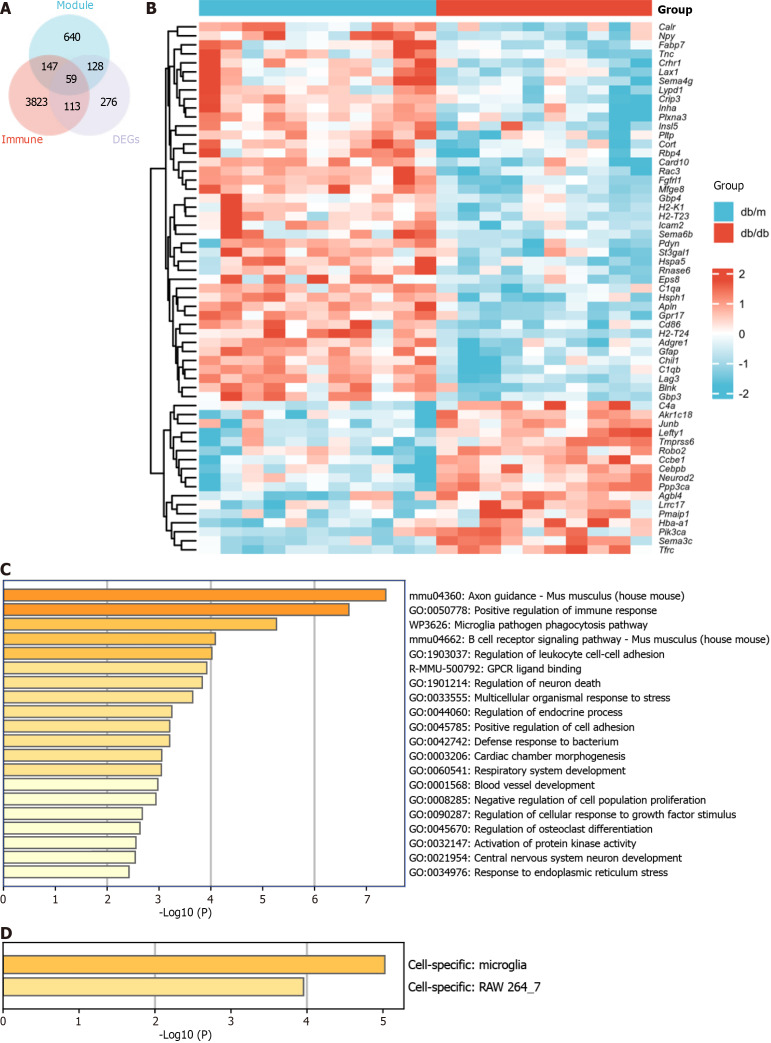
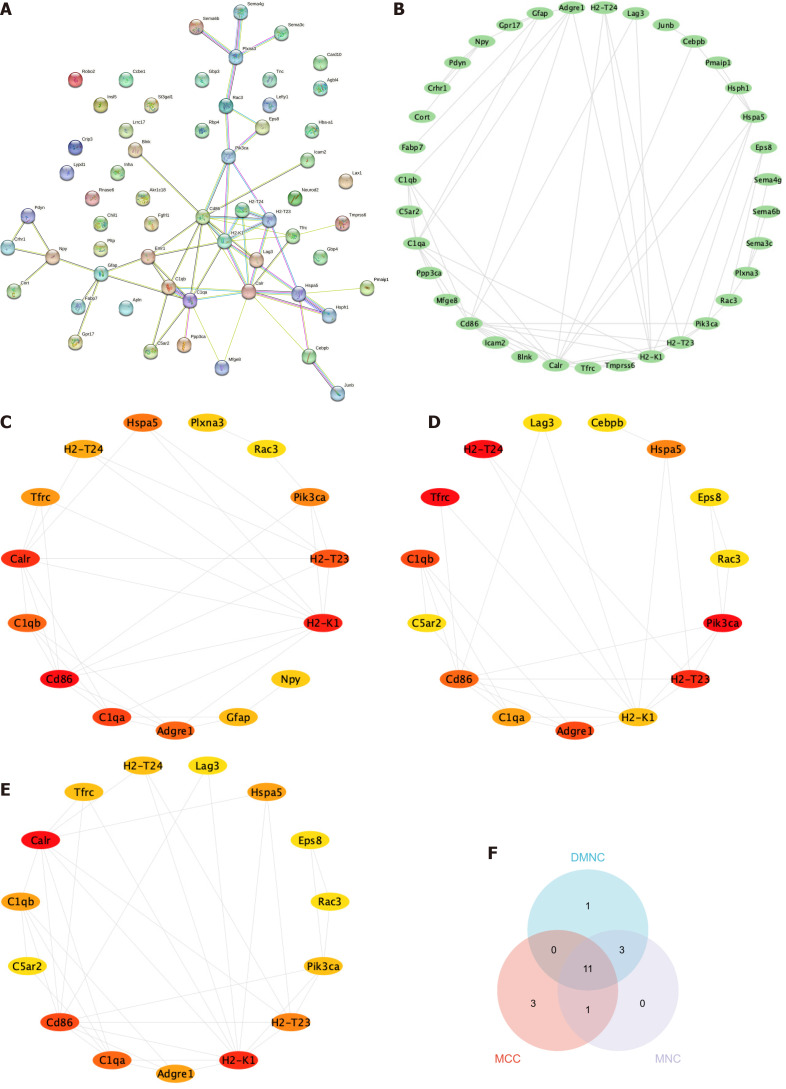
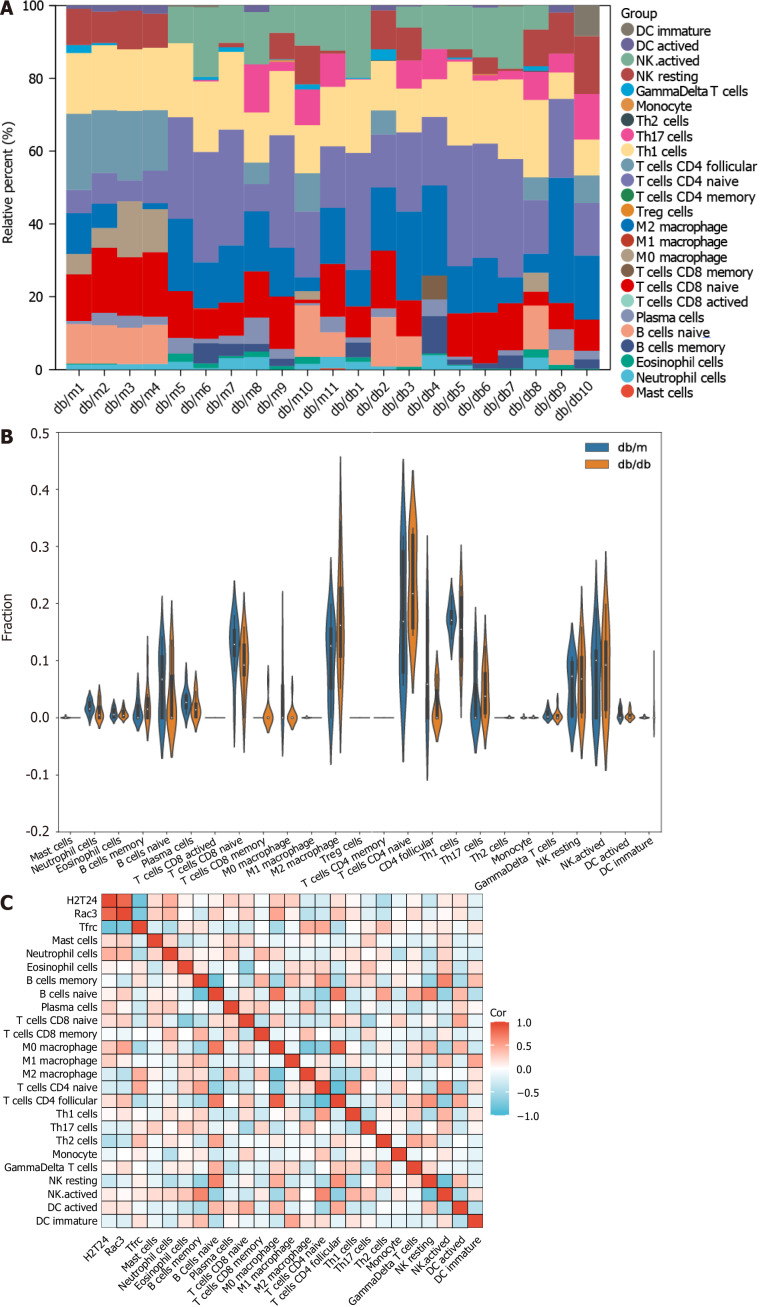
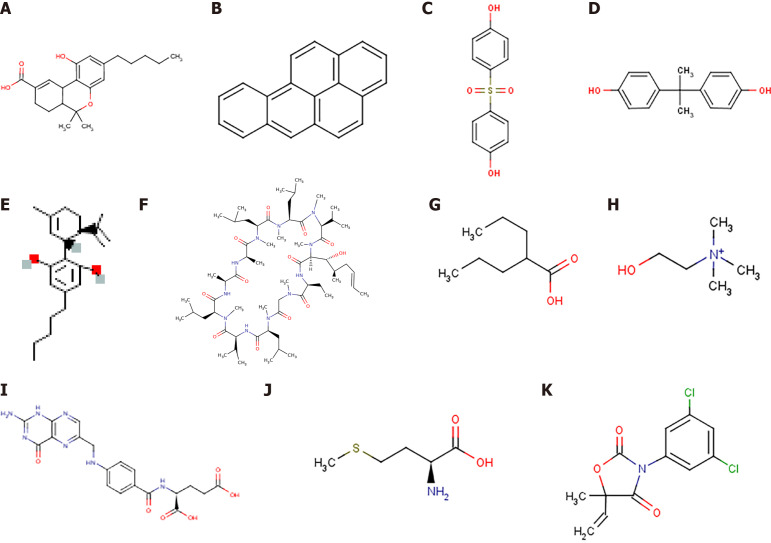
Results: A total of 576 DEGs were identified using GSE125387. By taking the intersection of DEGs, T2DM module genes, and immune-related genes, a total of 59 genes associated with the immune system were identified. Afterward, machine learning was utilized to identify three hub genes (H2-T24, Rac3, and Tfrc). The hub genes were associated with a variety of immune cells. The three hub genes were validated in GSE152539. Validation experiments were conducted at the mRNA and protein levels both in vivo and in vitro, consistent with the bioinformatics analysis. Additionally, 11 potential drugs associated with RAC3 and TFRC were identified based on the CTD.

Conclusion: Immune-related genes that differ in expression in the hippocampus are closely linked to microglia. We validated the expression of three hub genes both in vivo and in vitro, consistent with our bioinformatics results. We discovered 11 compounds associated with RAC3 and TFRC. These findings suggest that they are co-regulatory molecules of immunometabolism in diabetic cognitive impairment.

Keywords: Bioinformatics analysis; Cognitive impairment; Hippocampus; Immune; Microglia; Type 2 diabetes mellitus.


Conflict of interest statement

Conflict-of-interest statement: The authors assert that there are no conflicting interests.

Figures

Figure 1
Figure 1
Flow chart of the methods used in this study. DEGs: Differentially expressed genes; WGCNA: Weighted Gene Co-Expression Network Analysis; GSEA: Gene Set Enrichment Analysis; PPI: Protein-protein interaction; ROC: Receiver operating characteristic; RT-qPCR: Reverse transcription quantitative real-time PCR; WB: Western blotting; IHC: Immunohistochemistry.
Figure 2
Figure 2
Differentially expressed genes in GSE125387 and functional enrichment analysis. A: Principal component analysis shows that the db/db group and db/m group were distinctly separated; B: The volcano plot illustrates the distributions of differentially expressed genes (DEGs), with 214 genes showing upregulation (represented by red dots) and 362 genes showing downregulation (represented by blue dots). No significantly changed genes are marked as black dots; C: Heat map plot of the most significant DEGs; D: Analysis of functional enrichment for DEGs; E: Gene Set Enrichment Analysis (GSEA) between all the genes showing the up-regulated pathways; F: GSEA between all the genes showing the down-regulated pathways. PCA: Principal component analysis.
Figure 3
Figure 3
Identification of module genes via Weighted Gene Co-Expression Network Analysis. A and B: The soft threshold β = 3 is chosen as the result of the combined analysis of scale independence and average connectivity; C: Different colors represent gene co-expression modules in the gene tree; D: Heatmap illustrating the correlation between modules and type 2 diabetes mellitus (T2DM). There is a significant correlation between the brown module and T2DM; E: The brown module contains 974 genes, and the scatter diagram shows the correlation between membership in the brown module and gene significance for the group; F: Analysis of gene enrichment in the brown module for functional purposes.
Figure 4
Figure 4
Identification of immune-related differentially expressed genes and functional enrichment analysis. A: The intersection of differentially expressed genes (DEGs), immune-related genes, and brown module genes via Weighted Gene Co-Expression Network Analysis reveals a total of 59 identified genes; B: Heat map plot of the 59 immune-related DEGs; C: Functional enrichment analysis was performed on the 59 genes; D: Prediction of specific cell types for the 59 genes. DEGs: Differentially expressed genes.
Figure 5
Figure 5
Construction of a network for the interaction between proteins. A and B: The protein-protein interaction network analysis shows that 35 genes have interactions with one another; C-E: Top 15 genes were independently ranked by Maximal Clique Centrality, Density of Maximum Neighborhood Component and Maximum Neighborhood Component methods. The scores were ordered by color from red to yellow; F: The overlap of the top 15 genes obtained from the three methods resulted in a total of 11 genes. MCC: Maximal Clique Centrality; DMNC: Density of Maximum Neighborhood Component; MNC: Maximum Neighborhood Component.
Figure 6
Figure 6
Utilizing machine learning to evaluate potential diagnostic biomarkers in candidate screening. A and B: Screening of biomarkers in the Lasso model. For diagnosis, the most appropriate gene count (n = 4) is the one that corresponds to the lowest point on the curve; C and D: The error is displayed by the random forest algorithm. The importance score is used to rank genes; E: The Venn diagram illustrates that the above two algorithms have identified three potential diagnostic genes: H2-T24, Rac3 and Tfrc.
Figure 7
Figure 7
Evaluation of the receiver operating characteristic. A-C: In GSE125387, the receiver operating characteristic (ROC) curve for each candidate gene (H2-T24, Rac3, and Tfrc) was analyzed; D: The levels of expression for the three genes in GSE125387; E-G: In GSE152539, the ROC curve for each candidate gene (H2-T24, Rac3, and Tfrc) is displayed; H: The levels of expression for the three genes in GSE152539 were also confirmed. aP < 0.05. AUC: Area under the curve; 95%CI: 95% confidence interval; TPR: True-positive rate; FPR: False-positive rate.
Figure 8
Figure 8
Immune cell infiltration analysis to gain a deeper understanding of the immune regulation involved in the hippocampus of type 2 diabetes mellitus. A: The bar plot visualizes the distribution of 25 different types of immune cells across various samples; B: The violin plot visualizes the comparison of the proportion of 25 types of immune cells between db/db and db/m; C: The correlation between the compositions of 22 types of immune cells and 3 hub genes. Various immune cells show the infiltration. Cor: Correlation coefficient.
Figure 9
Figure 9
Two-dimensional structures of potential compounds. A: 11-nor-delta(9)-tetrahydro; B: Benzo(a)pyrene; C: Bis(4-hydroxyphenyl)sulf; D: Bisphenol A; E: Cannabinoids; F: Cyclosporine; G: Valproic Acid; H: Choline; I: Folic Acid; J: Methionine; K: Vinclozolin.
Figure 10
Figure 10
Validation of the expression of hub genes in vivo and in vitro. A: Hub genes mRNA expression in db/db and db/m mice by reverse transcription quantitative real-time PCR (RT-qPCR). In comparison to db/m mice, H2-T24 and Rac3 showed a reduction in expression in db/db mice, whereas Tfrc demonstrated an elevation in expression in db/db mice; B: Palmitic acid (PA) was used as a type 2 diabetes mellitus model in vitro. Hub genes mRNA expression in PA and negative control (NC) groups by RT-qPCR. H2-T24 and Rac3 showed a reduction in expression in the PA group, whereas Tfrc demonstrated an elevation in expression in the PA group; C: Protein levels of RAC3 and TFRC in db/db and db/m mice by western blotting. Each lane represents an independent mouse hippocampus; D: Analysis of relative protein levels in db/db and db/m mice. In comparison to db/m mice, Rac3 showed a reduction in expression in db/db mice, whereas Tfrc demonstrated an elevation in expression in db/db mice; E: Protein levels of RAC3 and TFRC in PA and NC groups by western blotting. Each lane represents an independent experiment of cell lysate; F: Analysis of relative protein levels in PA and NC group. Rac3 showed a reduction in expression in the PA group, whereas Tfrc demonstrated an elevation in expression in the PA group; G: Protein expression of RAC3 and TFRC in db/db and db/m mice by immunohistochemistry; H: Analysis of average OD in db/db and db/m mice. In comparison to db/m mice, Rac3 showed a reduction in expression in db/db mice, whereas Tfrc demonstrated an elevation in expression in db/db mice. Data are expressed as the mean ± SEM (n = 3). aP < 0.05; bP < 0.01; cP < 0.001. NC: Negative control; PA: Palmitic acid.

Similar articles

References

    1. Srikanth V, Sinclair AJ, Hill-Briggs F, Moran C, Biessels GJ. Type 2 diabetes and cognitive dysfunction-towards effective management of both comorbidities. Lancet Diabetes Endocrinol. 2020;8:535–545. - PubMed
    1. Biessels GJ, Whitmer RA. Cognitive dysfunction in diabetes: how to implement emerging guidelines. Diabetologia. 2020;63:3–9. - PMC - PubMed
    1. Biessels GJ, Despa F. Cognitive decline and dementia in diabetes mellitus: mechanisms and clinical implications. Nat Rev Endocrinol. 2018;14:591–604. - PMC - PubMed
    1. Huang C, Wen X, Xie H, Hu D, Li K. Identification and Experimental Validation of Marker Genes between Diabetes and Alzheimer's Disease. Oxid Med Cell Longev. 2022;2022:8122532. - PMC - PubMed
    1. Huang C, Luo J, Wen X, Li K. Linking Diabetes Mellitus with Alzheimer's Disease: Bioinformatics Analysis for the Potential Pathways and Characteristic Genes. Biochem Genet. 2022;60:1049–1075. - PubMed