. 2024 Apr 22;9(4):496-518.
doi: 10.1016/j.jacbts.2024.01.007. eCollection 2024 Apr.

Mitochondrial Ca2+ Uniporter-Dependent Energetic Dysfunction Drives Hypertrophy in Heart Failure

Affiliations

Mitochondrial Ca2+ Uniporter-Dependent Energetic Dysfunction Drives Hypertrophy in Heart Failure

Hugo Alves-Figueiredo et al. JACC Basic Transl Sci. .

Abstract

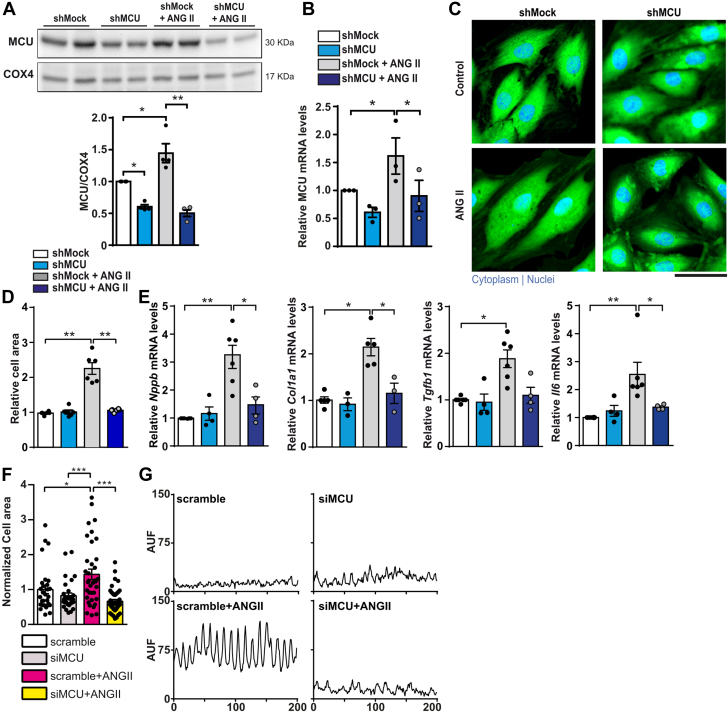
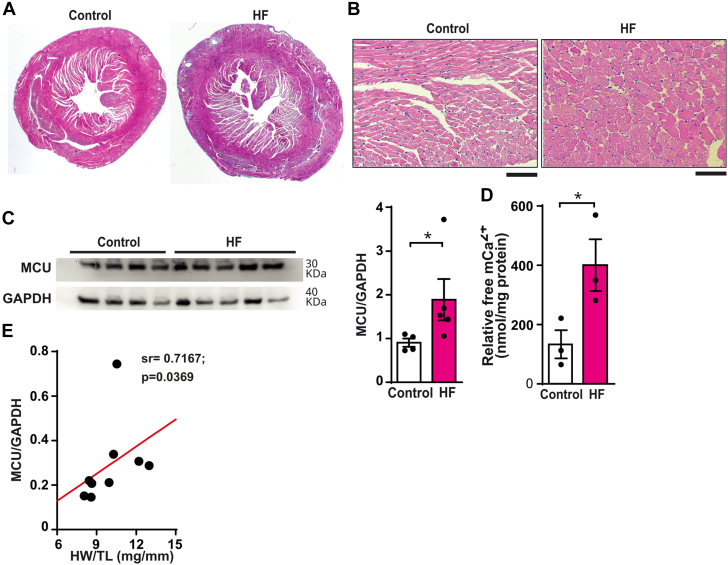
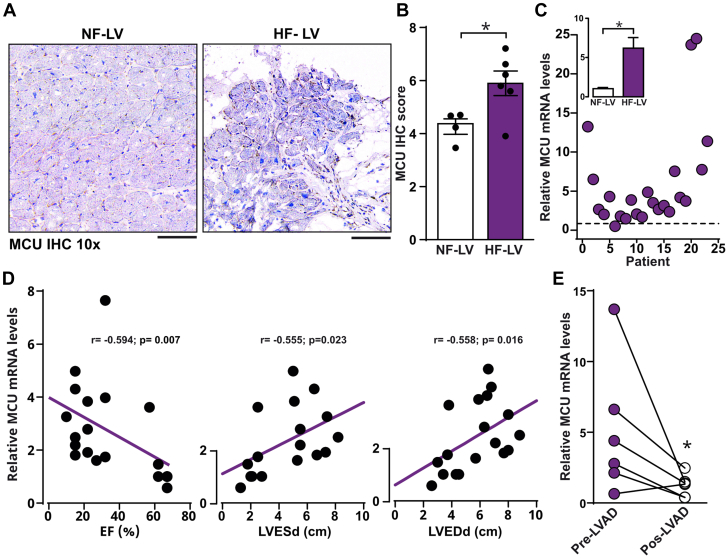
The role of the mitochondrial calcium uniporter (MCU) in energy dysfunction and hypertrophy in heart failure (HF) remains unknown. In angiotensin II (ANGII)-induced hypertrophic cardiac cells we have shown that hypertrophic cells overexpress MCU and present bioenergetic dysfunction. However, by silencing MCU, cell hypertrophy and mitochondrial dysfunction are prevented by blocking mitochondrial calcium overload, increase mitochondrial reactive oxygen species, and activation of nuclear factor kappa B-dependent hypertrophic and proinflammatory signaling. Moreover, we identified a calcium/calmodulin-independent protein kinase II/cyclic adenosine monophosphate response element-binding protein signaling modulating MCU upregulation by ANGII. Additionally, we found upregulation of MCU in ANGII-induced left ventricular HF in mice, and in the LV of HF patients, which was correlated with pathological remodeling. Following left ventricular assist device implantation, MCU expression decreased, suggesting tissue plasticity to modulate MCU expression.

Keywords: heart failure; mitochondrial calcium overload; mitochondrial calcium uniporter; mitochondrial dysfunction; pathological remodeling; reactive oxygen species.


Conflict of interest statement

This work was partially supported by the CONACYT Grants 256577, 258197, Fronteras de la Ciencia Grant (0682). The authors have reported that they have no relationships relevant to the contents of this paper to disclose.

Figures

None
Graphical abstract
Figure 1
Figure 1
Silencing MCU Prevents Pathologic Hypertrophy Mitochondrial calcium uniporter (MCU) was downregulated by transfecting H9C2 cells with a short hairpin RNA (shRNA) – green fluorescent protein (GFP) against MCU (shMCU) but not a nonspecific scramble shRNA-GFP (shMock). ShMCU and shMock were cultured under chronic angiotensin II (ANGII)–induced hypertrophy conditions: 1 μM ANGII for 48 hours. (A) Representative blot image (top) and semiquantification (bottom) of the protein level of MCU assessed by Western blotting in cell lysates (n = 4). (B) Relative mRNA levels of MCU (n = 3). (C) Representative fluorescent images of hypertrophy. Images acquired with fluorescent confocal microscopy. Cell hypertrophy was evaluated by assessing cell area using cytoplasmic fluorescent staining by calcein; nuclei were stained using DRAQ5; scale bar 50 μm. (D) Semiquantification of cell area as stained by calcein (n = 100 cells × 6 experiments). (E) Relative gene expression of remodeling gene markers B-type natriuretic peptide (Nppb gene), collagen type 1 (Col1a1 gene), and proinflammatory gene markers tumor growth factor β 1 (Tgfb1 gene) and interleukin 6 (IL-6) (Il6 gene). (F) Relative semiquantitative cell area from cardiomyocytes silenced for MCU and stimulated with ANGII determined from fluorescent images acquired with fluorescent confocal microscopy using cytoplasmic fluorescent calcein staining (n = 4, 35 cells/experiment). (G) Fluorescence densitometric profiles obtained by analyzing a longitudinal section of the cardiomyocyte stained with Phalloidin Rhodamine. Units are arbitrary units of fluorescence (AUF). Statistics: dots represent individual values, and bars represent mean ± SEM. (A to E) Kruskal-Wallis test with Dunn's post hoc test for multiple pairwise comparisons. (F) One-way analysis of variance with Dunn’s post hoc. ∗P < 0.05. ∗∗P < 0.01. ∗∗∗P < 0.001.
Figure 2
Figure 2
Silencing MCU Prevents mCa2+ Overload and mROS Generation in Cells Under Pathologic Hypertrophic Condition ShMCU and shMock were cultured under chronic ANGII-induced hypertrophy, 1 μM ANGII for 48 hours. (A,B) Mitochondrial calcium (Ca2+) retention capacity (CRC) evaluated fluorometrically with the Ca2+ green 5N (CG5N) dye. Cells suspended in a Ca2+-free media were periodically stimulated with 10 μM Ca2+ bolus until the opening of the mitochondrial permeability pore (mPTP), releasing the mitochondrial Ca2+ (mCa2+) content. Representative recording (A) and semiquantification (B) are shown. (C) Mitochondrial calcium retention captacity (mCRC) in permeabilized shMock and shMCU cells previously exposed to the ANGII-induced hypertrophy at the ANGII concentrations of 1 μM and 5 μM for 48 hours. (D) Free mCa2+ release by permeabilized transfected cells. Cells were loaded with Fluo-4 and suspended in a free Ca2+ media, followed by exposure to the oxidative phosphorylation uncoupler FCCP to induce ultimately mitochondrial membrane disruption and content release. (E) Production of mitochondrial reactive oxygen species (mROS) assessed by flow cytometry analysis of intracellular MitoSO Red fluorescent staining from live cells. Semiquantitative analysis from fluorescence histograms is shown. (F) Mitochondrial biogenesis assessed by the detection of mitochondrial transcription factor (TFAM) using Western blotting in cells (n = 3); representative blot image and semiquantification are shown. (G,H) Mitochondrial density is assessed by fluorescence analysis of TMRE-positive stained area of each cell, normalized against cell area. Cell hypertrophy was evaluated by assessing cell area using cytoplasmic fluorescent staining by calcein. Representative fluorescent images acquired with fluorescent confocal microscopy; scale bar 50 μm. (I) Activation of reactive oxygen species (ROS) –dependent prohypertrophic and proinflammatory transcription-factor nuclear factor kappa B (NF-κB) assessed by Western blotting in cell lysates from transfected cells (n = 3), representative blot image from NF-κB phosphorylation (pNF-κB) and total NF-κB along with their semiquantitative ratio are shown. Data are presented as mean ± SEM; (A,B,D,E,F,G, and I) 1-way analysis of variance (ANOVA) with Dunn’s post hoc test for multiple pairwise comparisons; (C) 2-way ANOVA with Sidak post hoc test. ∗P < 0.05. ∗∗P < 0.01. ∗∗∗P < 0.001. FCCP = Carbonyl cyanide-p-trifluoromethoxyphenylhydrazone; MFI = median fluorescence intensity; RFU = relative fluorescence units; other abbreviations as in Figure 1.
Figure 3
Figure 3
Inhibiting the Mitochondrial Na+/Ca2+ Exchanger Induces mCa2+ Overload and Reverts Antihypertrophic Effect in Silenced MCU Cells shMCU cells exposed to ANGII-induced hypertrophy (1 μM ANGII, 48 hours) were treated simultaneously with the mitochondrial Na+/Ca2+ exchanger (NCLX) inhibitor CGP37157 at 5 μM. (A) Relative semiquantitative cell area from cells treated with CGP37157 determined from fluorescent images acquired with fluorescent confocal microscopy (n = 3). Cell hypertrophy was evaluated by assessing cell area using cytoplasmic fluorescent calcein stain. (B) Free mCa2+ release by permeabilized cells. Cells were loaded with Fluo-4 and suspended in a free Ca2+ medium, followed by exposure to the OxPhos uncoupler FCCP to induce mitochondrial membrane disruption and content release (n = 6 to 8). (C) mCRC in permeabilized cells. Relative gene expression of (D) remodeling gene markers B-type natriuretic peptide (Nppb gene, n = 3) and proinflammatory gene markers (E) TGFβ 1 (Tgfb1 gene, n = 3) and (F) IL-6 (Il6 gene, n = 3). Bars represent mean ± SEM; Kruskal-Wallis test with Dunn’s post hoc test for multiple pairwise comparisons. ∗P < 0.05. ∗∗P < 0.01. ∗∗∗P < 0.001. CGP = CGP37157 a NCLX inhibitor; other abbreviations as in Figures 1 and 2.
Figure 4
Figure 4
Inhibiting MCU With Ru360 Prevents Mitochondrial Ca2+ Overload and Angiotensin-Induced Hypertrophy shMCU cells exposed to ANGII-induced hypertrophy (1 μM ANG II, 48 h) were treated simultaneously with the MCU-specific inhibitor ruthenium 360 (Ru360) at 1 μM. (A) Relative semiquantitative cell area of cells treated with ANGII and Ru360 determined from fluorescent images acquired with fluorescent confocal microscopy (n = 3). Cell hypertrophy was evaluated by assessing cell area using cytoplasmic fluorescent calcein stain. (B) Free mCa2+ release by permeabilized cells. Cells were loaded with Fluo-4 and suspended in a free Ca2+ medium, followed by exposure to the OxPhos uncoupler FCCP to induce mitochondrial membrane disruption and content release (n = 4). (C) Production of mROS assessed by flow cytometry analysis with intracellular MitoSOX Red fluorescent staining from live cells (n = 3). Relative gene expression of (D) remodeling gene markers B-type natriuretic peptide (Nppb gene, n = 4) and collagen type 1; (E) (Col1a1 gene, n = 4); and (F) proinflammatory gene marker IL-6 (Il6 gene, n = 4). (G) Relative semiquantitative cell area from cardiomyocytes exposed to Ru360 and stimulated with ANGII (n = 4, 35 cells/experiment), and (H) corresponding fluorescence densitometric profiles. Dots represent individual values and bars represent mean ± SEM. (A to F) Kruskal-Wallis test with Dunn’s post hoc test for multiple pairwise comparisons. (G) One-way ANOVA with Dunn’s post hoc test. ∗P < 0.05. ∗∗P < 0.01. ∗∗∗P < 0.001. Abbreviations as in Figures 1 and 2.
Figure 5
Figure 5
ANGII Induces MCU Upregulation Through a Ca2+-Dependent CAMKII/CREB Activation Signaling The mechanisms underlying MCU upregulation upon chronic exposure to prohypertrophic ANGII were evaluated in shMock cells. (A) Time-course activation of Ca2+/calmodulin-dependent protein kinase II (CAMKII) and cyclic adenosine monophosphate response element-binding protein (CREB) and upregulation of MCU were assessed by Western blotting (WB), using cell lysates from shMock obtained 3, 6, 12, 24 and 48 hours posterior to the exposure of 1 μM ANGII. Representative blot images are shown from phosphorylated CAMKII, vs total CAMKII phosphorylated CREB vs total CREB, MCU vs COX4 expressions for the same WB membrane. (B) Semiquantification for the time-course activation of CAMKII by ANGII, determined by the relation between phospho-CAMKII and total-CAMKII (n = 4). (C) Semiquantification for the time-course activation of CREB by ANGII determined by the relation between phospho-CREB and total-CREB (n = 4). (D) Semiquantification for the time-course upregulation of MCU by ANGII normalized for COX4 expression (n = 4). (E) Activation of CAMKII and CREB and expression of MCU in shMock cells cultured in the presence of 1 μM ANGII and 5 μM BAPTA-AM (Ca2+ chelator), or 5 μM KN93 (CAMKII inhibitor), or 1 μM 66615 (CREB inhibitor) for 48 hours assessed by WB. Representative image obtained from the same membrane. (F,G,H) Semiquantification for WB detection of the MCU expression vs COX4 (n = 4) (F), phospho-CAMKII vs total-CAMKII (n = 4) (G), and phospho-CREB vs total-CREB (n = 4) (H) determined for shMock cells cultured in the presence of BAPTA, KN93, and 66615. (I) Inhibiting Ca2+/CAMKII/CREB signaling prevents cell hypertrophy. shMock were cultured in the presence of 1 μM of ANGII and 5 μM BAPTA-AM, or 5 μM KN93 or 1 μM 66615 for 48 hours. Relative semiquantitative cell area was determined from fluorescent images acquired with fluorescent confocal microscopy (n = 4). Cell hypertrophy was evaluated by assessing cell area using cytoplasmic fluorescent staining by calcein. Data are presented as mean ± SEM. (B to D) Show 1-way repeated measures ANOVA and (E to H) show 1-way ANOVA with Dunn’s post hoc test for multiple pairwise comparisons. ∗P < 0.05. ∗∗P < 0.01. ∗∗∗P < 0.001. BAPTA-AM = membrane-permeable form of BAPTA: 1,2-Bis(2-aminophenoxy)ethane-N,N,N′,N′-tetraacetic acid tetrakis(acetoxymethyl ester; other abbreviations as in Figures 1 and 2.
Figure 6
Figure 6
MCU Overexpression is Associated With ANGII-Induced Heart Hypertrophy and HF (A) Representative micrographs of cardiac tissue: Masson’s trichrome stain to visualize fibrotic areas, original magnification ×1.25 (n = 6). (B) Hematoxylin and eosin (HE) stain for cardiac myocyte area assessment, original magnification ×10 (n = 6). (C) Representative blot image (top) and semiquantification (bottom) of the protein level of MCU assessed by WB in cell lysates (n = 5). (D) Free mCa2+ release by permeabilized cardiomyocytes, loaded with Fluo-4 and suspended in a free Ca2+ medium. (E) Spearman correlation analysis between MCU protein levels normalized to glyceraldehyde 3-phosphate dehydrogenase (GAPDH) and heart weight normalized with tibia length. Data are presented as mean ± SEM and Mann-Whitney with post hoc Tukey’s multiple comparisons test. ∗P < 0.05. ∗∗P < 0.01. HF = heart failure; HW = heart weight; TL = tibia length; other abbreviations as in Figures 1, 2, and 5.
Figure 7
Figure 7
MCU Overexpression is Associated With Pathologic Remodeling in Human HF (A, B) Immunohistochemical (IHC) analysis of left ventricular (LV) cryosections from nonfailing (NF-LV) and heart failure (HF-LV). Original magnification ×10x. Scale bar = 500 μm. (C) Relative mRNA levels (quantitative reverse transcriptase polymerase chain reaction) of MCU in LV samples from HF-LV patients in relation to NF-LV normalized (dash line, value = 1). The inner bar chart represents relative average ± SEM MCU mRNA expression between NF-LV and HF-LV patients. (D) Spearman correlation analysis between MCU mRNA levels and the hemodynamic parameters of ejection fraction (EF) (left), left ventricular end-systolic dimension (LVESd) (center), and left ventricular end-diastolic dimension (LVEDd) (right) using Spearman rank correlation test. Each point represents a patient; the purple line represents the Spearman trendline, Sr (Spearman correlation coefficient) and probability value (P) were determined for each correlation. (E) Relative MCU mRNA levels from LV samples obtained from patients with HF who underwent surgical implantation of a left ventricular assist device (LVAD). The graph shows MCU mRNA levels before (purple) and after (white) LVAD implantation for each patient. Each dot represents 1 patient. Data are presented as mean ± SEM. B and C use the unpaired t-test and E uses the paired t-test. ∗P < 0.05. Abbreviations as in Figures 1 and 6.
Figure 8
Figure 8
Scheme of the Proposed Mechanisms for ANGII-Induced MCU Overexpression Through Ca2+-Dependent CAMKII/CREB Activation Signaling and mCa2+ Overload-Dependent Cardiomyocytes Hypertrophy Through ROS-Mediated NF-κB Activation ΔΨm = mitochondrial membrane potential; AT1R = angiotensin II receptor type 1; mPTP = mitochondrial permeability transition pore; other abbreviations as in Figures 1 to 3.

References

    1. Bers D.M. Cardiac excitation–contraction coupling. Nature. 2002;415(6868):198–205. - PubMed
    1. Glancy B., Balaban R.S. Role of mitochondrial Ca2+ in the regulation of cellular energetics. Biochemistry. 2012;51(14):2959–2973. - PMC - PubMed
    1. Kwong J.Q., Lu X., Correll R.N., et al. The mitochondrial calcium uniporter selectively matches metabolic output to acute contractile stress in the heart. Cell Rep. 2015;12(1):15–22. - PMC - PubMed
    1. Zhou B., Tian R. Mitochondrial dysfunction in pathophysiology of heart failure. J Clin Invest. 2018;128(9):3716–3726. - PMC - PubMed
    1. Xu H.X., Cui S.M., Zhang Y.M., Ren J. Mitochondrial Ca2+ regulation in the etiology of heart failure: physiological and pathophysiological implications. Acta Pharmacol Sin. 2020;41(10):1301–1309. - PMC - PubMed