. 2024 Apr 24;8(2):026105.
doi: 10.1063/5.0201626. eCollection 2024 Jun.

The viscoelasticity of high concentration monoclonal antibodies using particle tracking microrheology

Affiliations

The viscoelasticity of high concentration monoclonal antibodies using particle tracking microrheology

Conor M Lewis et al. APL Bioeng. .

Abstract

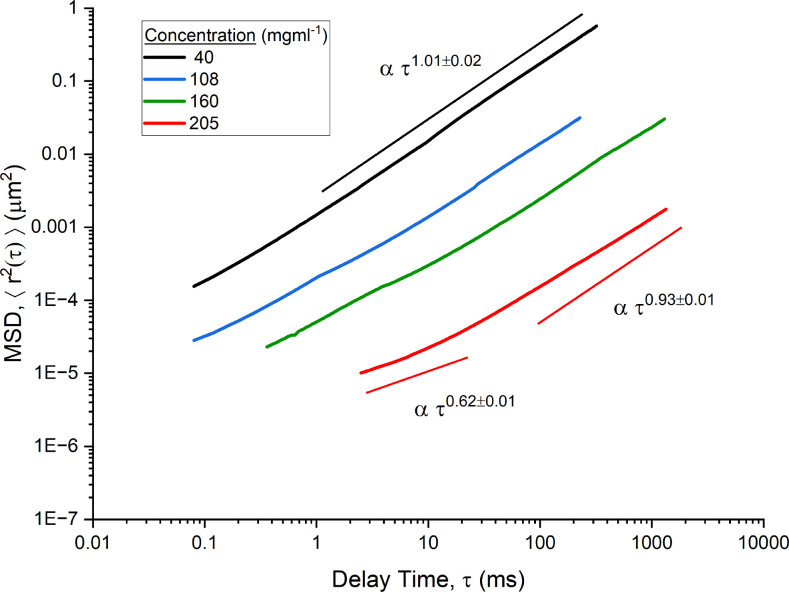
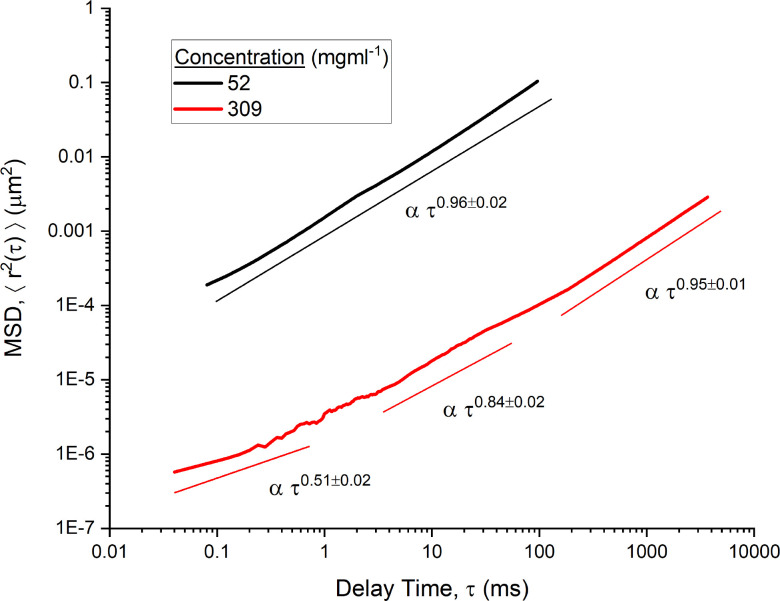
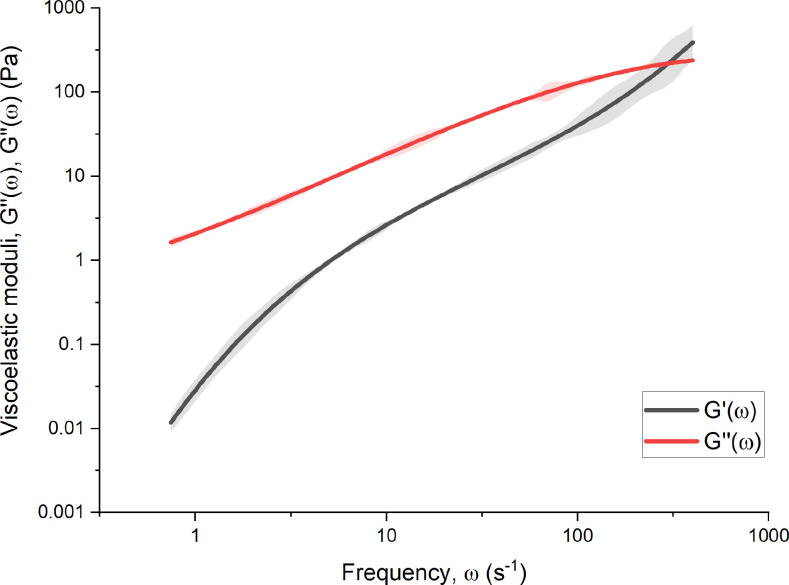
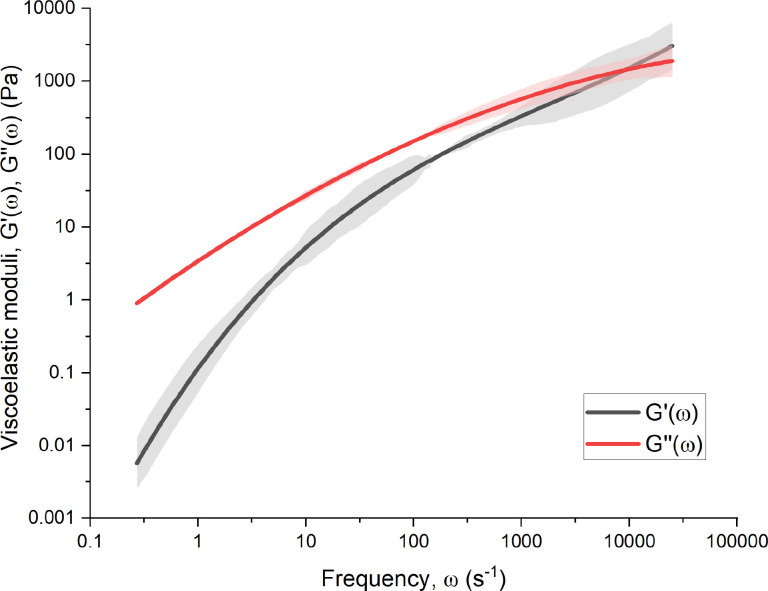
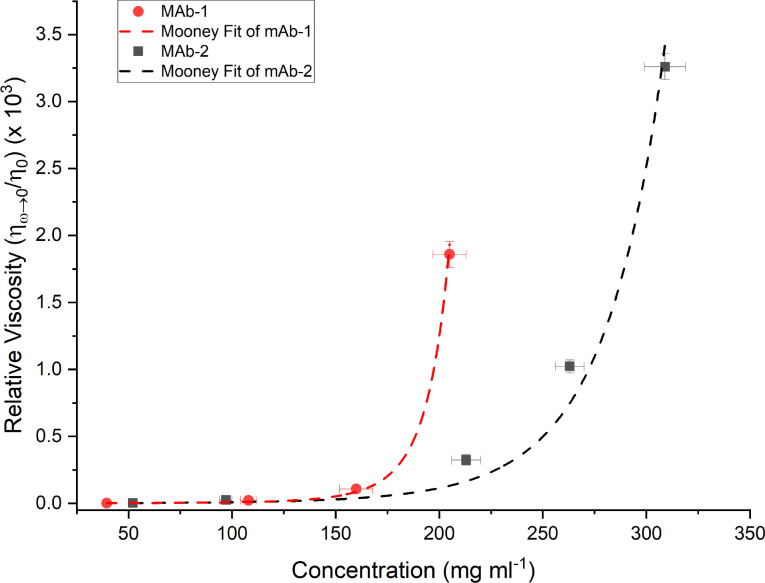
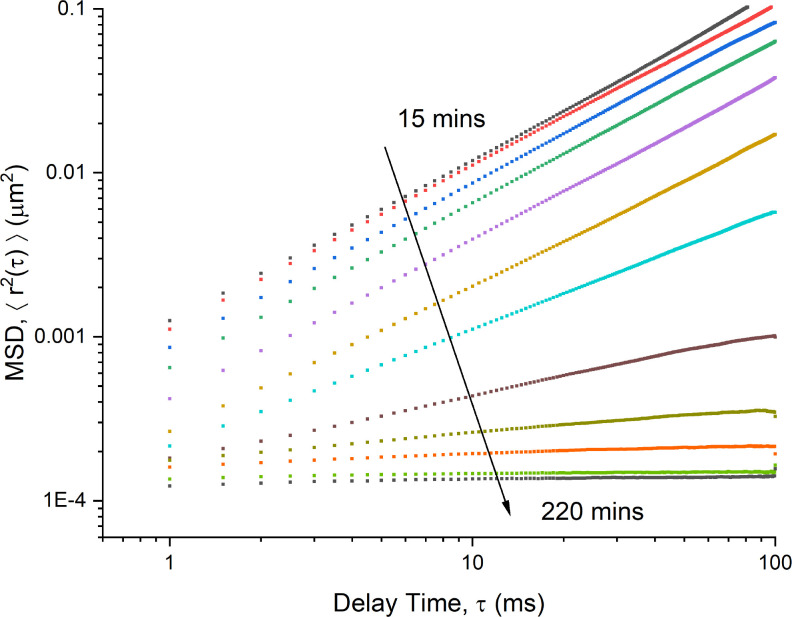
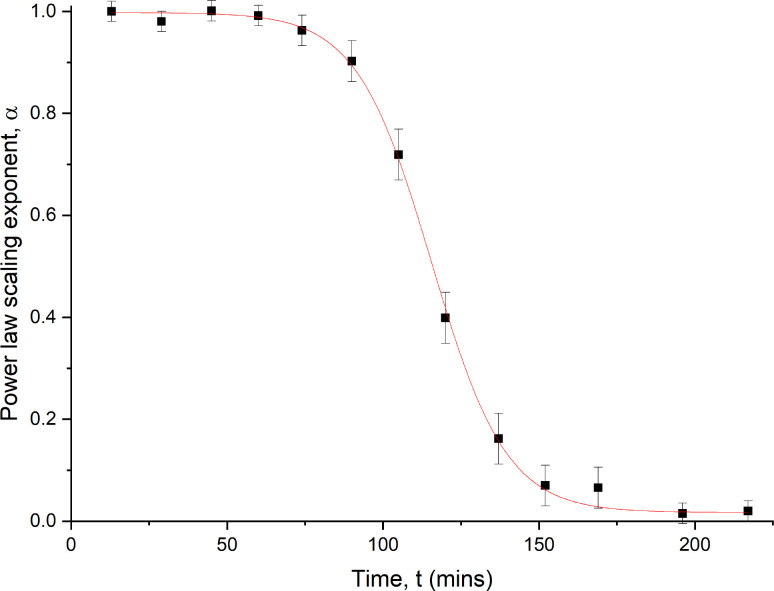
The viscoelasticity of monoclonal antibodies (mAbs) is important during their production, formulation, and drug delivery. High concentration mAbs can provide higher efficacy therapeutics (e.g., during immunotherapy) and improved efficiency during their production (economy of scale during processing). Two humanized mAbs were studied (mAb-1 and mAb-2) with differing isoelectric points. Using high speed particle tracking microrheology, we demonstrated that the mAb solutions have significant viscoelasticities above concentrations of 40 mg/ml. Power law viscoelasticity was observed over the range of time scales (10-4-1 s) probed for the high concentration mAb suspensions. The terminal viscosity demonstrated an exponential dependence on mAb concentration (a modified Mooney relationship) as expected for charged stabilized Brownian colloids. Gelation of the mAbs was explored by lowering the pH of the buffer and a power law scaling of the gelation transition was observed, i.e., the exponent of the anomalous diffusion of the probe particles scaled inversely with the gelation time.


Conflict of interest statement

The authors have no conflicts to disclose.

Figures

FIG. 1.
FIG. 1.
Mean square displacement of PEGylated probe spheres [ <Δr2(τ)>] moving in mAb-1 solutions (40–205 mg ml−1) as a function of the delay time ( τ) in milliseconds. Trend lines for power law scaling on the time interval are shown.
FIG. 2.
FIG. 2.
Mean square displacement of PEGylated probe spheres [ <Δr2(τ)>] moving in mAb-2 solutions (50 and 309 mg ml−1) as a function of the time interval ( τ) in milliseconds. Trend lines for power law scaling on the time interval are shown.
FIG. 3.
FIG. 3.
Complex shear moduli [ G(ω) and G(ω)] as a function of frequency ( ω) for the 205 mg ml−1 concentration of mAb-1. Smoothing functions are used to reduce the presence of noise, represented by the shaded regions.
FIG. 4.
FIG. 4.
Complex shear moduli [ G(ω) and G(ω)] are shown as a function of frequency ( ω) for the 314 mg ml−1 concentration of mAb-2. Smoothing functions are used to reduce the presence of noise, represented by the shaded regions.
FIG. 5.
FIG. 5.
Relative viscosity (low shear solution viscosity over buffer viscosity, ηR) plotted as a function of mAb concentration. A modified Mooney fit was made to both mAb-1 and mAb-2 [Eq. (2)]. Both mAbs see large increases in viscosity with concentrations past 200 mg ml−1 up to a factor of 103 above the original buffer viscosity. Error bars account for the inaccuracy in measuring mAb concentrations through mass volume calculations as well as predicting terminal regimes at higher concentrations.
FIG. 6.
FIG. 6.
MSDs as a function of delay time for 36 mg ml−1 mAb-2 at set times after mixing with 0.4 M of acetic acid. The gelation process spanned over 3 h, with the final measurement at t=220 min. The scaling exponents of each MSD curve are displayed in Fig. 7.
FIG. 7.
FIG. 7.
The power law exponent ( α) of the MSDs in Fig. 7 as a function of the time, t, after the addition of acetic acid to the solution. An empirical sigmoidal fit function [Eq. (8)] with an intercept of αmax=0.998±0.001 and inflection point of ti=115±0.7 min provided a good fit. Error bars are given from the root mean-squared difference of additional measurements taken around the data point.
FIG. 8.
FIG. 8.
Schematic diagram of the particle tracking microrheology apparatus. Tracer particles are added to a mAb solution within an environmental chamber to control the temperature. Movies of microsphere motion are taken at varying frame-rates. The active table, isolation foam, and floated optical table reduce the ambient vibrational noise.

References

    1. Lu R.-M., Hwang Y.-C., Liu I.-J., Lee C.-C., Tsai H.-Z., Li H.-J., and Wu H.-C., “Development of therapeutic antibodies for the treatment of diseases,” J. Biomed. Sci. 27, 1 (2020). 10.1186/s12929-019-0592-z - DOI - PMC - PubMed
    1. Harris R. J., Shire S. J., and Winter C., “Commercial manufacturing scale formulation and analytical characterization of therapeutic recombinant antibodies,” Drug Dev. Res. 61, 137–154 (2004). 10.1002/ddr.10344 - DOI
    1. Yearley E. J., Godfrin P. D., Perevozchikova T., Zhang H., Falus P., Porcar L., Nagao M., Curtis J. E., Gawande P., Taing R., Zarraga I. E., Wagner N. J., and Liu Y., “Observation of small cluster formation in concentrated monoclonal antibody solutions and its implications to solution viscosity,” Biophys. J. 106, 1763–1770 (2014). 10.1016/j.bpj.2014.02.036 - DOI - PMC - PubMed
    1. Viola M., Sequeira J., Seiça R., Veiga F., Serra J., Santos A. C., and Ribeiro A. J., “Subcutaneous delivery of monoclonal antibodies: How do we get there?,” J. Controlled Release 286, 301–314 (2018). 10.1016/j.jconrel.2018.08.001 - DOI - PubMed
    1. Jiskoot W., Hawe A., Menzen T., Volkin D. B., and Crommelin D. J., “Ongoing challenges to develop high concentration monoclonal antibody-based formulations for subcutaneous administration: Quo vadis?,” J. Pharm. Sci. 111, 861–867 (2022). 10.1016/j.xphs.2021.11.008 - DOI - PubMed