

Diagnostic performance of different imaging modalities for splenic malignancies: A comparative meta-analysis
- PMID: 38681661
- PMCID: PMC11053287
- DOI: 10.1016/j.ejro.2024.100566
Diagnostic performance of different imaging modalities for splenic malignancies: A comparative meta-analysis
Abstract
Background and objectives: The spleen hosts both benign and malignant lesions. Despite multiple imaging modalities, the distinction between these lesions poses a diagnostic challenge, marked by varying diagnostic accuracy levels across methods. In this study, we aimed to evaluate and compare the diagnostic performance of various imaging techniques for detecting malignant splenic lesions.
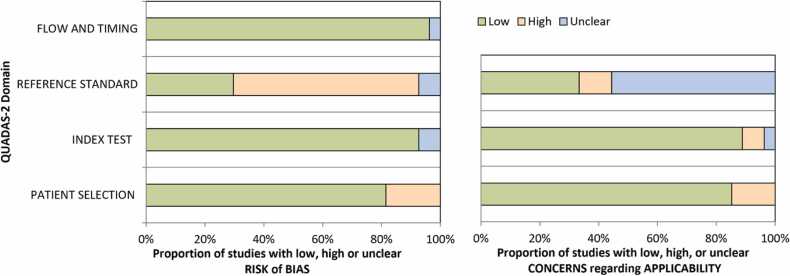
Methods: Following PRISMA guidelines, we searched PubMed, Scopus, and Web of Sciences databases for studies evaluating imaging techniques in detecting malignant splenic lesions. Data extraction included diagnostic accuracy metrics, and methodological quality was assessed using QUADAS-2. Diagnostic Test Accuracy meta-analyses were conducted using R (version: 4.2.1). Subgroup analyses and meta-regression were performed to compare different modalities and clinical settings.
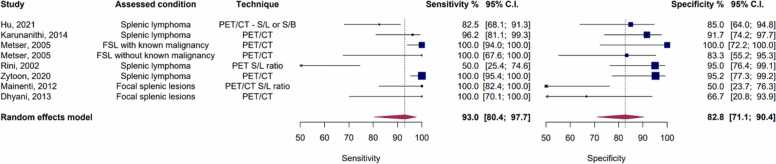
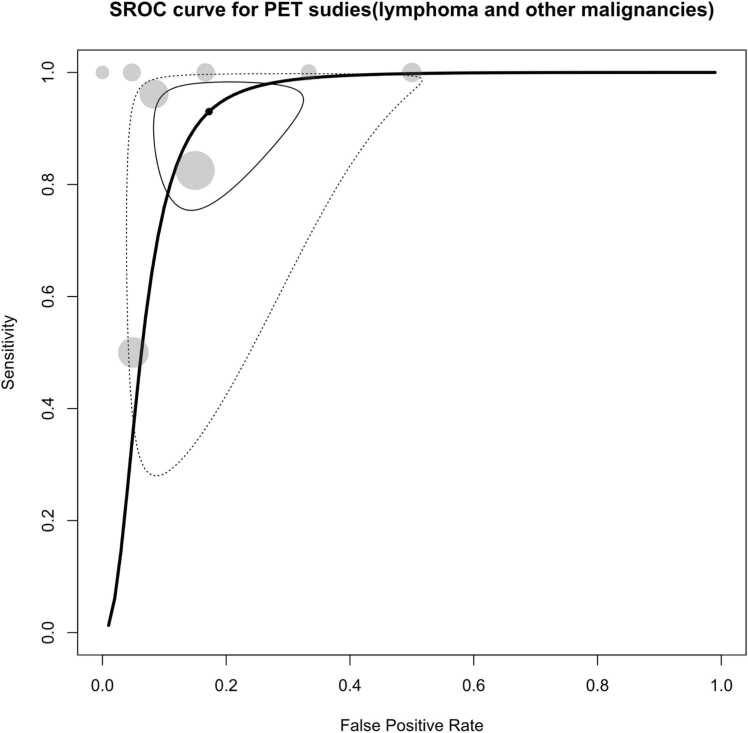
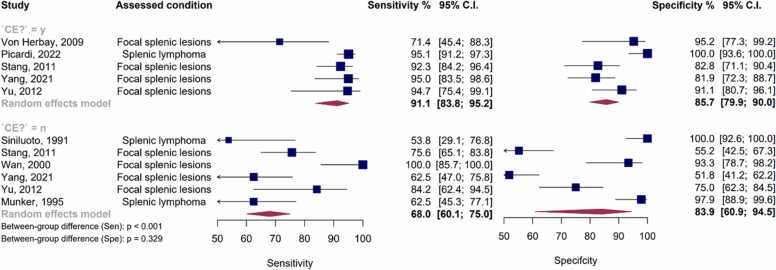
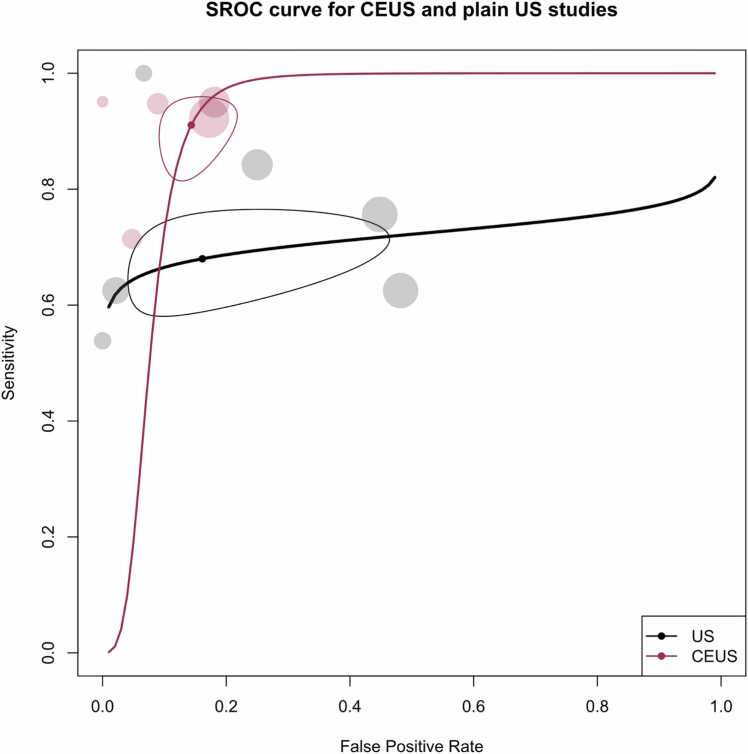
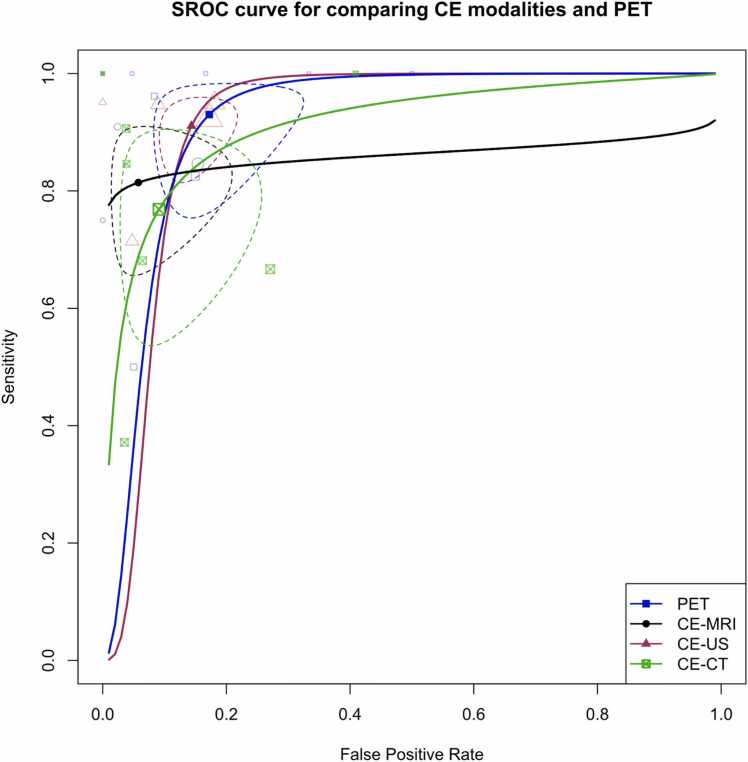
Results: Our study included 28 studies (pooled sample size: 2358), primarily using retrospective designs with histopathology as the reference standard. PET scan demonstrated the highest diagnostic accuracy (AUC: 92 %), demonstrating a sensitivity of 93 % (95 % CI: 80.4 % - 97.7 %) and a specificity of 82.8 % (95 % CI: 71.1 % - 90.4 %). Contrast-enhanced ultrasound (CEUS), Contrast-enhanced CT scan, and contrast-enhanced MRI also showed impressive performance with AUCs of 91.4 %, 90.9 %, and 85.3 %, respectively. Differences among these modalities were not statistically significant, but they outperformed non-contrast-enhanced methods. PET and CEUS exhibited higher specificity for lymphoma cases compared to studies including other malignancies.
Conclusion and clinical implications: Overall, PET emerges as the best modality for splenic malignancies, and CEUS and CE-MRI show promise as potential alternatives, notably due to their reduced radiation exposure. Further research is essential for precise malignancy differentiation.
Keywords: CT scan; MRI; PET; Splenic malignancy; Ultrasound.
© 2024 The Authors.
Conflict of interest statement
The authors declare the absence of any known financial conflicts of interest or personal relationships that could have appeared to influence the work presented in this paper
Figures


Similar articles
-
Comparative Diagnostic Accuracy of Contrast-Enhanced Ultrasound and Shear Wave Elastography in Differentiating Benign and Malignant Lesions: A Network Meta-Analysis.Front Oncol. 2019 Mar 5;9:102. doi: 10.3389/fonc.2019.00102. eCollection 2019. Front Oncol. 2019. PMID: 30891425 Free PMC article.
-
Differentiating malignant from benign splenic lesions: a meta-analysis and pictorial review of imaging features.Abdom Radiol (NY). 2024 Aug;49(8):2833-2857. doi: 10.1007/s00261-024-04447-w. Epub 2024 Jun 20. Abdom Radiol (NY). 2024. PMID: 38900328 Review.
-
Compared with CT/MRI LI-RADS, whether CEUS LI-RADS is worth popularizing in diagnosis of hepatocellular carcinoma?-a direct head-to-head meta-analysis.Quant Imaging Med Surg. 2023 Aug 1;13(8):4919-4932. doi: 10.21037/qims-22-1383. Epub 2023 May 24. Quant Imaging Med Surg. 2023. PMID: 37581040 Free PMC article.
-
Incidentally detected splenic lesions in ultrasound: does contrast-enhanced ultrasonography improve the differentiation of benign hemangioma/hamartoma from malignant lesions?Ultraschall Med. 2011 Dec;32(6):582-92. doi: 10.1055/s-0031-1282034. Epub 2011 Dec 9. Ultraschall Med. 2011. PMID: 22161555
-
Contrast-enhanced ultrasound: Improving the preoperative staging of hepatocellular carcinoma and guiding individual treatment.World J Gastroenterol. 2014 Sep 21;20(35):12628-36. doi: 10.3748/wjg.v20.i35.12628. World J Gastroenterol. 2014. PMID: 25253968 Free PMC article.
Cited by
-
Splenic hamartoma mimicking angiosarcoma: A case report.World J Clin Cases. 2025 Sep 16;13(26):107028. doi: 10.12998/wjcc.v13.i26.107028. World J Clin Cases. 2025. PMID: 40881498
References
-
- Fotiadis C., Georgopoulos I., Stoidis C., Patapis P. Primary tumors of the spleen. Int. J. Biomed. Sci. Jun. 2009;vol. 5(2):85–91. [Online]. Available: http://www.ncbi.nlm.nih.gov/pubmed/23675122. - PMC - PubMed
LinkOut - more resources
Full Text Sources
