

A Study of Pupil Response to Light as a Digital Biomarker of Recent Cannabis Use
- PMID: 38682092
- PMCID: PMC11052563
- DOI: 10.1159/000538561
A Study of Pupil Response to Light as a Digital Biomarker of Recent Cannabis Use
Abstract
Introduction: Given the traffic safety and occupational injury prevention implications associated with cannabis impairment, there is a need for objective and validated measures of recent cannabis use. Pupillary light response may offer an approach for detection.
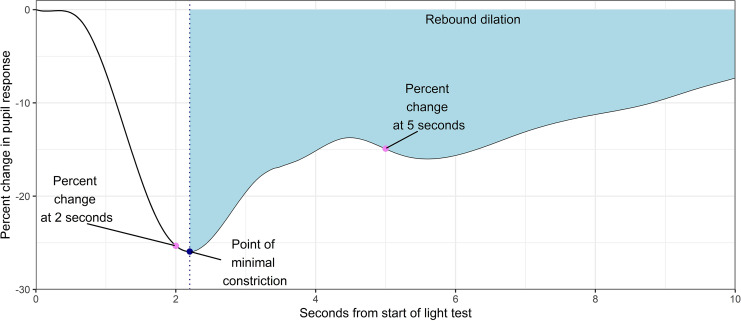
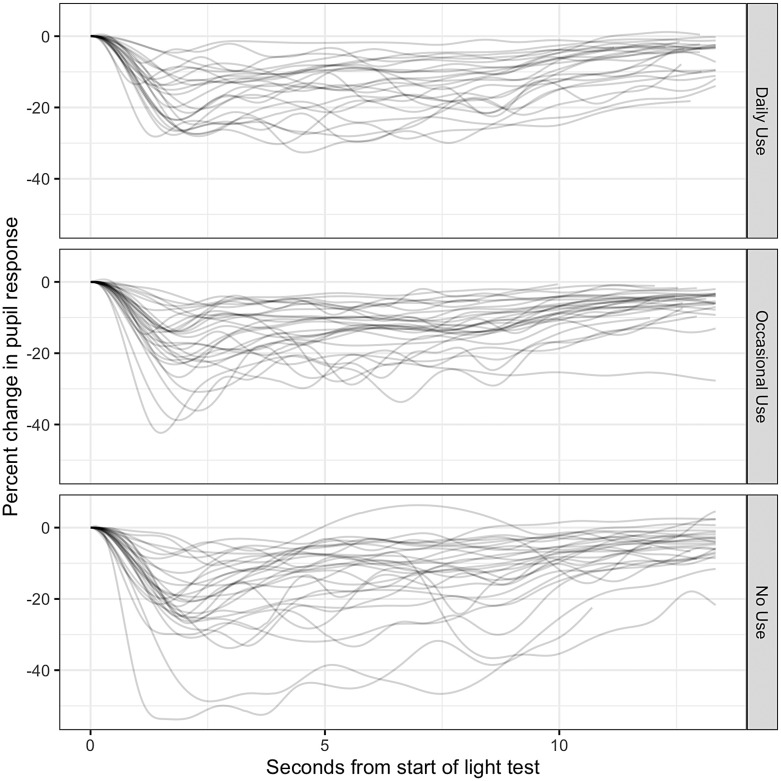
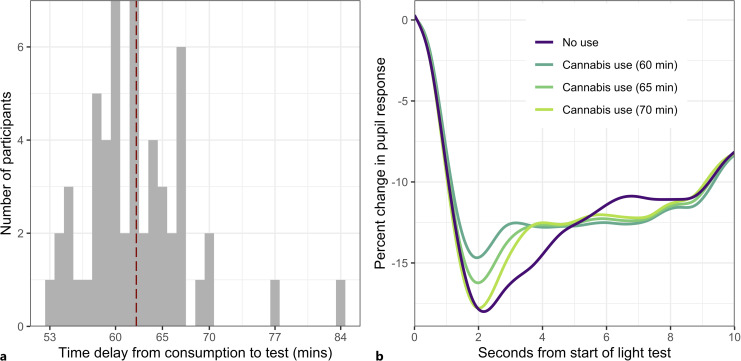
Method: Eighty-four participants (mean age: 32, 42% female) with daily, occasional, and no-use cannabis use histories participated in pupillary light response tests before and after smoking cannabis ad libitum or relaxing for 15 min (no use). The impact of recent cannabis consumption on trajectories of the pupillary light response was modeled using functional data analysis tools. Logistic regression models for detecting recent cannabis use were compared, and average pupil trajectories across cannabis use groups and times since light test administration were estimated.
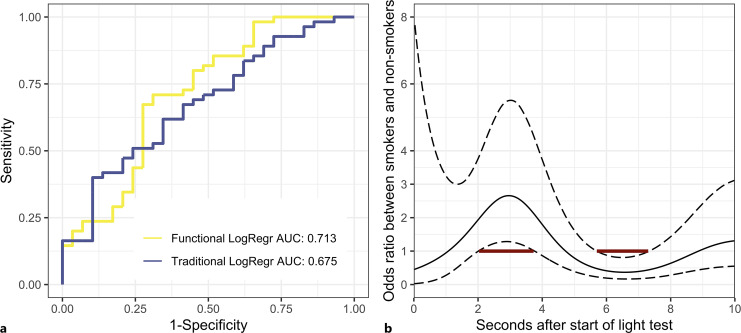
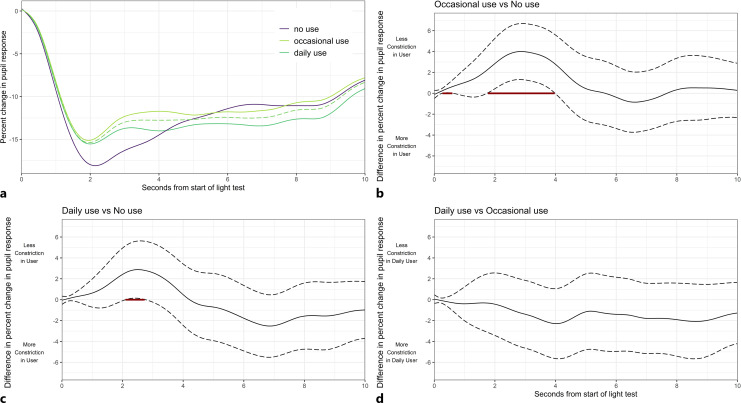
Results: Models revealed small, significant differences in pupil response to light after cannabis use comparing the occasional use group to the no-use control group, and similar statistically significant differences in pupil response patterns comparing the daily use group to the no-use comparison group. Trajectories of pupillary light response estimated using functional data analysis found that acute cannabis smoking was associated with less initial and sustained pupil constriction compared to no cannabis smoking.
Conclusion: These analyses show the promise of pairing pupillary light response and functional data analysis methods to assess recent cannabis use.
Keywords: Cannabis; Functional data analysis; Pupillary light reflex; Pupillometry; Substance use detection.
© 2024 The Author(s). Published by S. Karger AG, Basel.
Conflict of interest statement
The authors have no conflicts of interest to declare.
Figures
Similar articles
-
A Video Segmentation Pipeline for Assessing changes in Pupil Response to Light After Cannabis Consumption.bioRxiv [Preprint]. 2023 Mar 21:2023.03.17.533144. doi: 10.1101/2023.03.17.533144. bioRxiv. 2023. PMID: 36993434 Free PMC article. Preprint.
-
Pupillary effects in habitual cannabis consumers quantified with pupillography.Forensic Sci Int. 2020 Dec;317:110559. doi: 10.1016/j.forsciint.2020.110559. Epub 2020 Oct 25. Forensic Sci Int. 2020. PMID: 33162280
-
Pupillometry measures of autonomic nervous system regulation with advancing age in a healthy pediatric cohort.Clin Auton Res. 2020 Feb;30(1):43-51. doi: 10.1007/s10286-019-00639-3. Epub 2019 Sep 25. Clin Auton Res. 2020. PMID: 31555934
-
Using Pupillometry to Assess the Atypical Pupillary Light Reflex and LC-NE System in ASD.Behav Sci (Basel). 2018 Nov 21;8(11):108. doi: 10.3390/bs8110108. Behav Sci (Basel). 2018. PMID: 30469373 Free PMC article. Review.
-
Pharmacologic interventions for mydriasis in cataract surgery.Cochrane Database Syst Rev. 2021 May 27;5(5):CD012830. doi: 10.1002/14651858.CD012830.pub2. Cochrane Database Syst Rev. 2021. PMID: 34043237 Free PMC article.
References
-
- Substance Abuse and Mental Health Services Administration . Key substance use and mental health indicators in the United States: results from the 2022 National Survey on drug use and Health. Center for Behavioral Health Statistics and Quality, Substance Abuse and Mental Health Services Administration; 2023.
-
- Biasutti WR, Leffers KSH, Callaghan RC. Systematic review of cannabis use and risk of occupational injury. Subst Use Misuse. 2020;55(11):1733–45. - PubMed
LinkOut - more resources
Full Text Sources
