. 2024 May 15;137(10):jcs262172.
doi: 10.1242/jcs.262172. Epub 2024 May 22.

SARS-CoV-2 NSP5 antagonizes MHC II expression by subverting histone deacetylase 2

Affiliations

SARS-CoV-2 NSP5 antagonizes MHC II expression by subverting histone deacetylase 2

Nima Taefehshokr et al. J Cell Sci. .

Abstract

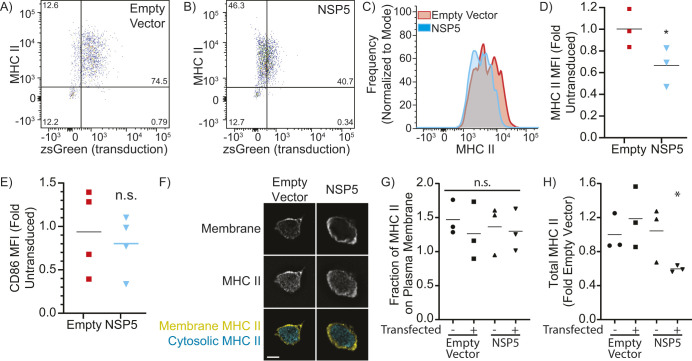
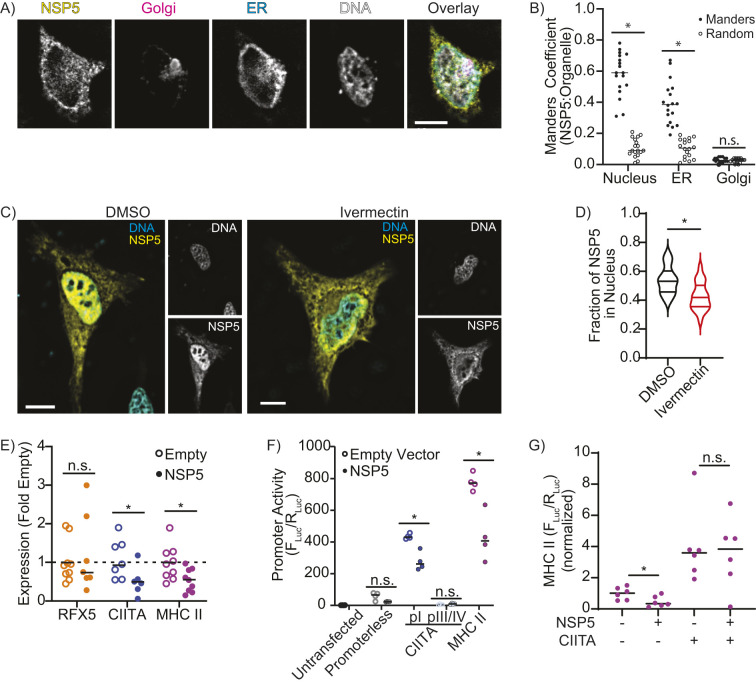
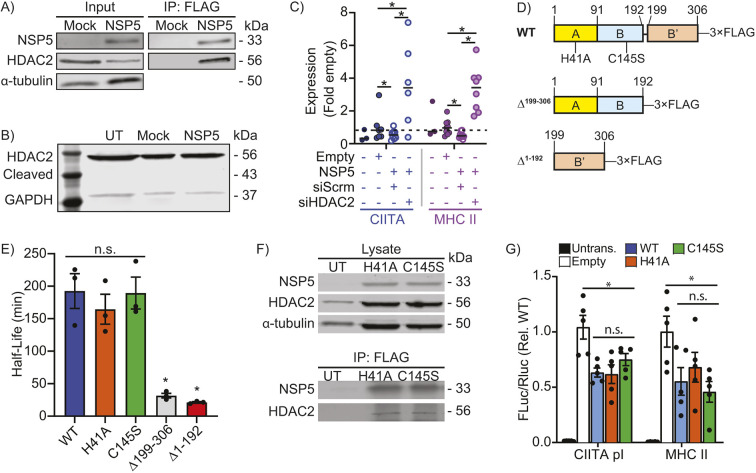
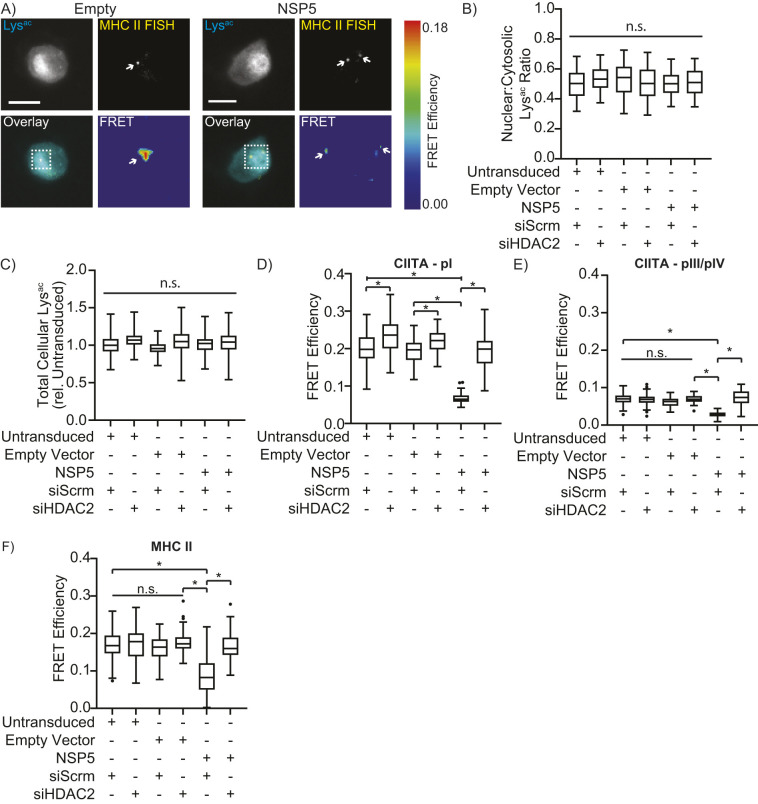
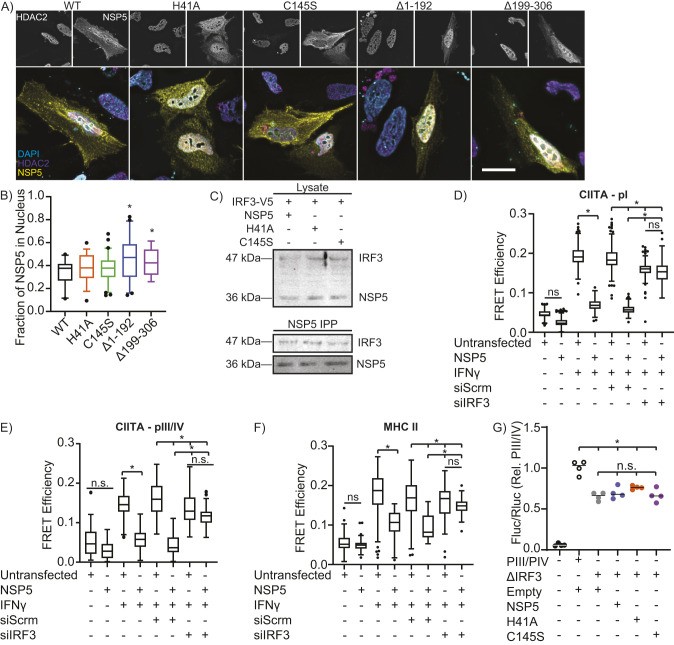
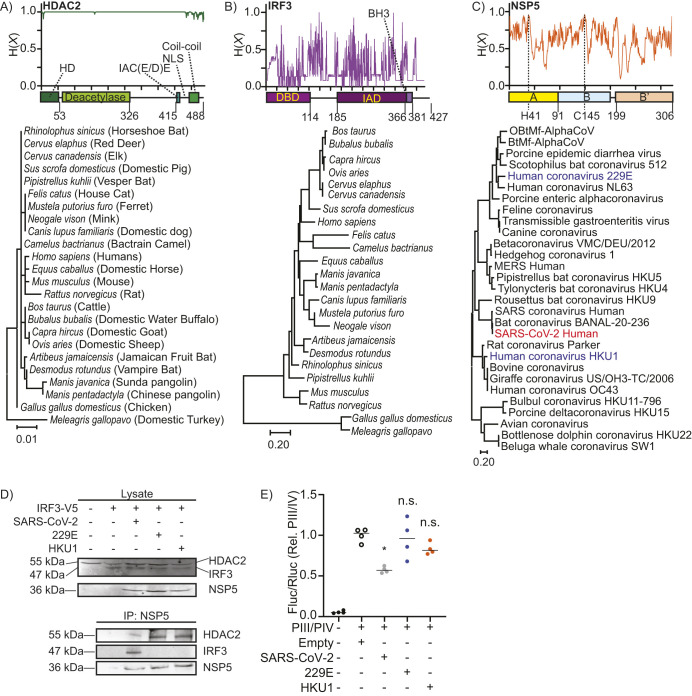
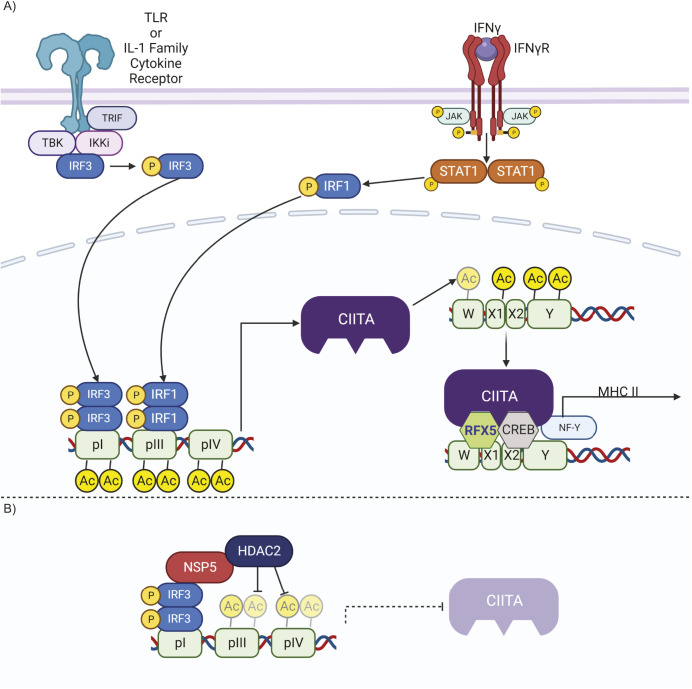
SARS-CoV-2 interferes with antigen presentation by downregulating major histocompatibility complex (MHC) II on antigen-presenting cells, but the mechanism mediating this process is unelucidated. Herein, analysis of protein and gene expression in human antigen-presenting cells reveals that MHC II is downregulated by the SARS-CoV-2 main protease, NSP5. This suppression of MHC II expression occurs via decreased expression of the MHC II regulatory protein CIITA. CIITA downregulation is independent of the proteolytic activity of NSP5, and rather, NSP5 delivers HDAC2 to the transcription factor IRF3 at an IRF-binding site within the CIITA promoter. Here, HDAC2 deacetylates and inactivates the CIITA promoter. This loss of CIITA expression prevents further expression of MHC II, with this suppression alleviated by ectopic expression of CIITA or knockdown of HDAC2. These results identify a mechanism by which SARS-CoV-2 limits MHC II expression, thereby delaying or weakening the subsequent adaptive immune response.

Keywords: Antigen presentation; CIITA; Dendritic cells; IRF3; MHC II; Macrophages; NSP5; SARS-CoV-2.


Conflict of interest statement

Competing interests The authors declare no competing or financial interests.

Figures

Fig. 1.
Fig. 1.
NSP5 suppresses MHC II in primary human monocyte-derived DCs. moDCs were transduced with lentiviral vectors lacking a transgene (empty vector) or bearing NSP5, with both vectors containing an IRES-zsGreen marker. (A,B) Representative flow cytometry plots showing cell surface MHC II expression and transduction (zsGreen+) of moDCs transduced with an empty vector control (A) or NSP5-expressing lentiviral vector (B). (C) Histogram of cell surface MHC II expression levels on moDCs transduced with an empty vector (red) or NSP5-expressing vector (cyan). (D,E) Quantification of cell surface MHC II (D) and CD86 (E) in moDCs transduced with either an empty (Empty) or NSP5-expressing (NSP5) lentiviral vector. The mean fluorescence intensity (MFI) is normalized to the MFI of the non-transduced cells in the empty vector condition. (F) Z-slice through a macrophage stained for MHC II and the plasma membrane, showing the segmentation of vesicular and cytosolic versus surface (membrane) MHC II. Scale bar: 10 µm. (G,H) Quantification of the fraction of MHC II on the plasma membrane (G) and total cellular MHC II (H) in macrophages that have been transfected either with an empty or NSP5-expressing vector, comparing non-transfected (zsGreen-negative) to transfected (zsGreen-positive) cells in both conditions. Data is representative of, or quantifies, a minimum of three independent experiments. Line in D, E, G and H shows the mean. *P<0.05; n.s., not significant (P>0.05) (Kruskal–Wallace test with Dunn correction compared to non-transfected empty vector).
Fig. 2.
Fig. 2.
NSP5 suppresses CIITA and MHC II expression. (A,B) Fluorescence Z-projection (A) and Manders’ colocalization analysis (B) quantifying the proportion of NSP5 colocalized with the nucleus for HeLa cells co-transfected with NSP5–FLAG (yellow), TGN46–mCherry (Golgi, magenta), KDEL–eGFP (ER, cyan) and stained with Hoechst (DNA, gray). Manders colocalization analysis compares the fraction of NSP5 colocalized with the nucleus, ER and Golgi (Manders) to the Manders’ ratio from the same image when the NSP5 image was randomized (Random). (C,D) Fluorescent z-projections (C) and quantification (D, violin plot highlighting median and quartiles) of the fraction of NSP5 in the nucleus of vehicle-treated (DMSO) versus ivermectin-treated HeLa cells expressing NSP5–FLAG (yellow) and stained for DNA with Hoechst (cyan). (E) RT-qPCR quantification of RFX5, CIITA and MHC II mRNA levels in moDCs transduced with empty or NSP5-expressing lentiviral vectors. (F) Quantification of the promoter activity of the CIITA pI, CIITA pIII/IV, and MHC II promoters using a dual-luciferase assay in RAW 264.7 macrophages co-transfected with empty or NSP5-expressing lentiviral vectors. (G) Quantification of MHC II promoter activity in RAW 264.7 macrophages co-transfected with CIITA and NSP5. (−) indicates the sample was transfected with empty vector rather than CIITA or NSP5. Fluc/Rluc was normalized to the value of cells transfected with an empty vector. Images are representative of a minimum of 30 cells captured across three independent experiments. n=minimum of 3. Line in B and E–G shows the mean. *P<0.05; n.s., not significant (P>0.05) [paired two-tailed t-test (B) or Mann–Whitney test (D–G) compared to Random (B), DMSO (D), or Empty Vector (E–G)]. Scale bars: 10 µm.
Fig. 3.
Fig. 3.
NSP5 requires HDAC2 to suppress MHC II expression. (A) Co-immunoprecipitation (IP) of HDAC2 with NSP5–FLAG from primary human moDCs transduced with empty (Mock) or NSP5–FLAG-expressing lentiviral vectors. Input, 5%. (B) Absence of detectable cleavage of endogenous HDAC2 in cells ectopically expressing NSP5. Cells are either untreated (UT), transfected with an empty vector (Mock) or transfected with NSP5, and the blots stained for endogenous HDAC2 and GAPDH. The expected size of NSP5-cleaved HDAC2 is 43.7 kDa. (C) RT-qPCR quantification of the impact of scrambled (siScrm) or HDAC2-targeting (siHDAC2) siRNA on CIITA and MHC II mRNA levels in primary human moDCs transduced with empty or NSP5-expressing lentiviral vectors. (D) Protease-inactivating (H41A and C145S) point-mutants, and deletion of the catalytic (A/B, Δ1–192) and ligand-stabilizing (B′, Δ199–306) domains were generated to assay the roles of these sites in NSP5 activity. WT, wild type. (E) Half-life of NSP5 and the H41A, C145S, Δ1–192 and Δ199–306 mutants, as quantified by NSP5 densitometry in cycloheximide-treated cells. (F) Immunoprecipitation of HDAC2 with NSP5H41A and NSP5C145S mutants. (G) Dual-luciferase assay quantification of CIITA pI and MHC II promoter activity in RAW264.7 macrophages that were either untransfected (Untrans.) or co-transfected with the CIITA or MHC II luciferase constructs plus either the empty vector (Empty), or with one of wild-type NSP5 (WT), NSP5H41A or NSP5C145S vectors. Data is normalized to Empty. For all panels, n=3–5. Results in E,G are mean±s.e.m. *P<0.05; n.s., not significant (P>0.05) [Kruskal–Wallis test with Dunn correction].
Fig. 4.
Fig. 4.
NSP5 modulates acetylation of the CIITA and MHC II promoters in human macrophages. (A) Representative micrograph of primary human macrophages transduced with empty or NSP5-expressing lentiviral vectors. Cells were stained for acetyl-lysine (Lysac, cyan) and with ATTO647N-labeled MHC II FISH probes (yellow), with the FRET signal between the Lysac and FISH probes within the boxed area shown in the FRET panel. Arrows highlight individual FISH probes (top) and the cosponsoring FRET signal (bottom). Scale bars: 10 µm. (B,C) Quantification of the nuclear:cytosolic acetyl-lysine (Lysac) distribution (B) and total cellular acetyl-lysine content (C) in primary human macrophages transduced with empty or NSP5-expressing lentiviral vectors and treated with scrambled (siScrm) or HDAC2-targeting (siHDAC2) siRNAs. ‘Untransduced’ quantifies macrophages that did not take up the empty or NSP5-expressing lentiviral vector. (D–F) Quantification of the acetylation of the CIITA pI (D), CIITA pIII/IV (E) and MHC II (F) promoters, as quantified by the FRET efficiency between Cy3-labeled anti-acetyl-lysine staining and ATTO647N-stained FISH probes in the same cells used for quantification of B and C. Data are representative of (A) or quantify (B–F) three independent experiments, and are plotted as interquartile range with median (box and line) with whiskers representing the 5–95th percentiles. *P<0.05; n.s., not significant (Kruskal–Wallis test with Dunn correction). Horizontal bars over columns indicate the statistical significance for all groups beneath; brackets indicate the statistical significance between the groups below the bracket arms.
Fig. 5.
Fig. 5.
NSP5 suppresses CIITA promoter activity via IRF3. (A,B) Fluorescence micrographs (A) and quantification (B) of NSP5 (yellow) and HDAC2 (magenta) nuclear localization in HeLa cells transfected with wild-type (WT) or mutant NSP5. The nucleus has been stained with DAPI (cyan). Scale bar: 10 µm. (C) IRF3 co-immunoprecipitation with wild-type NSP5 and with the H41A and C145S NSP5 catalytic mutants. n=3. (D–F) Quantification of FISH-FRET at the CIITA pI (D), CIITA pIII/IV (E) and MHC II (F) promoters in NSP5-transfected A549 cells treated with IFNγ and a non-targeting (siScrm) or IRF3-depleating siRNA (siIRF3). (G) Impact of wild-type (NSP5) versus protease-inactivated H41A and C145S NSP5 mutants on the activity of the wild-type (pIII/IV) or IRF3-binding site deleted (ΔIRF3) CIITA pIII/IV promoter in A549 cells, as quantified by a dual-luciferase assay. Empty, cells are transfected with the empty vector used to express NSP5. Images are representative of a minimum of 30 cells imaged over three independent experiments. Data are representative of (A) or quantify (B–F) three independent experiments, and are plotted as interquartile range with median (box and line) with whiskers representing the 5–95th percentiles (B,D–F) or showing the mean (line, G). *P<0.05; n.s., not significant (Kruskal–Wallis test with Dunn correction compared to WT (B) or the indicated groups (D–G)].
Fig. 6.
Fig. 6.
NSP5 interactions are conserved with HDAC2, but not with IRF3. (A–C) Domain structure, amino acid conservation [Shannon entropy, H (X)] and phylogenetic trees for HDAC2 (A) and IRF3 (B) across a range of vertebrate species which humans frequently contact or which are possible vectors of SARS-CoV2, and NSP5 (C) across representative coronaviral species. HDAC2 consists of four major domains, a homodimerization (HD) domain, deacetylase domain, an IAC (E/D)E motif, and a coiled-coil domain, which mediate interactions with other transcription factors. IRF3 contains three major domains: a DNA-binding domain (DBD), an IRF-association domain (IAD) and a BH3 domain. NSP5 contains a bipartite protease domain (A/B) with two critical catalytic residues (H41 and C145), and a B′ C-terminal domain, which stabilizes ligands in the protease domain. (D) Co-immunoprecipitation (IP) of endogenous HDAC2 from cells co-transfected with IRF3–V5 and with a FLAG-tagged NSP5 from SARS-CoV-2, from human coronavirus 229E, or from human coronavirus HKU1. Lysate, 5%. Images are representative of three repeats. (E) Dual-luciferase quantification of CIITA promoter pIII/IV in INF-γ-stimulated A549 cells co-transfected with NSP5 from SARS-CoV-2, human coronavirus 229E or human coronavirus HKU1. ‘Empty’ indicates cells co-transfected with the dual-luciferase vectors and the empty version of the vector used to express NSP5. n=4, line shows the mean. *P<0.05; n.s., not significant [Kruskal–Wallis test with Dunn correction compared to empty-vector transduced cells].
Fig. 7.
Fig. 7.
Model of MHC II transcriptional control and NSP5 activity at the MHC II promoter. (A) MHC II expression in myeloid cells is induced by a combination of IFN-γ and STAT1 together with TLR or IL-1 family cytokine signaling, which respectively activate IRF1 and IRF3. IRF1 and IRF3 then bind to the CIITA promoter and induce CIITA expression (left). Once synthesized, CIITA directly acetylates histones in the MHC II promoter via its intrinsic acetyltransferase activity. Once the MHC II promoter is acetylated, CIITA, RFX5 and NF-Y form an activating complex on the W, X1, X2 and Y motifs found in the core of the MHC II promoter, inducing expression of MHC II (right). (B) During SARS-CoV-2 infection, NSP5 binds to HDAC2, and via interactions with IRF3, delivers HDAC2 to the CIITA promoter. Here, HDAC2 deacetylates and inactivates the CIITA promoter, thereby suppressing the expression of CIITA, with the resulting loss of CIITA then leading to the cessation of MHC II expression. Figure produced in BioRender.

Similar articles

Cited by

References

    1. Balnis, J., Madrid, A., Hogan, K. J., Drake, L. A., Chieng, H. C., Tiwari, A., Vincent, C. E., Chopra, A., Vincent, P. A., Robek, M. D.et al. (2021). Blood DNA methylation and COVID-19 outcomes. Clin. Epigenet. 13, 118. 10.1186/s13148-021-01102-9 - DOI - PMC - PubMed
    1. Bensussen, A., Álvarez-Buylla, E. R. and Díaz, J. (2021). SARS-CoV-2 Nsp5 protein causes acute lung inflammation, a dynamical mathematical model. Front. Syst. Biol. 1, 10.3389/fsysb.2021.764155. 10.3389/fsysb.2021.764155 - DOI
    1. Beresford, G. W. and Boss, J. M. (2001). CIITA coordinates multiple histone acetylation modifications at the HLA-DRA promoter. Nat. Immunol. 2, 652-657. 10.1038/89810 - DOI - PubMed
    1. Berg, S., Kutra, D., Kroeger, T., Straehle, C. N., Kausler, B. X., Haubold, C., Schiegg, M., Ales, J., Beier, T., Rudy, M.et al. (2019). ilastik: interactive machine learning for (bio)image analysis. Nat. Methods 16, 1226-1232. 10.1038/s41592-019-0582-9 - DOI - PubMed
    1. Bergwerk, M., Gonen, T., Lustig, Y., Amit, S., Lipsitch, M., Cohen, C., Mandelboim, M., Levin, E. G., Rubin, C., Indenbaum, V.et al. (2021). Covid-19 breakthrough infections in vaccinated health care workers. N. Engl. J. Med. 385, 1474-1484. 10.1056/NEJMoa2109072 - DOI - PMC - PubMed

Publication types

MeSH terms