. 2024 Aug 6;150(6):451-465.
doi: 10.1161/CIRCULATIONAHA.122.061833. Epub 2024 Apr 29.

ABCG2-Expressing Clonal Repopulating Endothelial Cells Serve to Form and Maintain Blood Vessels

Affiliations

ABCG2-Expressing Clonal Repopulating Endothelial Cells Serve to Form and Maintain Blood Vessels

Yang Lin et al. Circulation. .

Abstract

Background: Most organs are maintained lifelong by resident stem/progenitor cells. During development and regeneration, lineage-specific stem/progenitor cells can contribute to the growth or maintenance of different organs, whereas fully differentiated mature cells have less regenerative potential. However, it is unclear whether vascular endothelial cells (ECs) are also replenished by stem/progenitor cells with EC-repopulating potential residing in blood vessels. It has been reported recently that some EC populations possess higher clonal proliferative potential and vessel-forming capacity compared with mature ECs. Nevertheless, a marker to identify vascular clonal repopulating ECs (CRECs) in murine and human individuals is lacking, and, hence, the mechanism for the proliferative, self-renewal, and vessel-forming potential of CRECs is elusive.

Methods: We analyzed colony-forming, self-renewal, and vessel-forming potential of ABCG2 (ATP binding cassette subfamily G member 2)-expressing ECs in human umbilical vessels. To study the contribution of Abcg2-expressing ECs to vessel development and regeneration, we developed Abcg2CreErt2;ROSA TdTomato mice and performed lineage tracing during mouse development and during tissue regeneration after myocardial infarction injury. RNA sequencing and chromatin methylation chromatin immunoprecipitation followed by sequencing were conducted to study the gene regulation in Abcg2-expressing ECs.

Results: In human and mouse vessels, ECs with higher ABCG2 expression (ABCECs) possess higher clonal proliferative potential and in vivo vessel-forming potential compared with mature ECs. These cells could clonally contribute to vessel formation in primary and secondary recipients after transplantation. These features of ABCECs meet the criteria of CRECs. Results from lineage tracing experiments confirm that Abcg2-expressing CRECs (AbcCRECs) contribute to arteries, veins, and capillaries in cardiac tissue development and vascular tissue regeneration after myocardial infarction. Transcriptome and epigenetic analyses reveal that a gene expression signature involved in angiogenesis and vessel development is enriched in AbcCRECs. In addition, various angiogenic genes, such as Notch2 and Hey2, are bivalently modified by trimethylation at the 4th and 27th lysine residue of histone H3 (H3K4me3 and H3K27me3) in AbcCRECs.

Conclusions: These results are the first to establish that a single prospective marker identifies CRECs in mice and human individuals, which holds promise to provide new cell therapies for repair of damaged vessels in patients with endothelial dysfunction.

Keywords: angiogenesis; blood vessels; developmental biology; endothelial cells.


Conflict of interest statement

Dr Rafii is a cofounder of and a nonpaid consultant to Angiocrine Bioscience. Dr Yoder is a scientific cofounder of Vascugen.

Figures
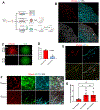
Figure 1.
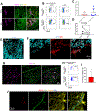
Figure 1.. AbcCRECs have in vitro EC colony forming potential and in vivo vessel forming potential.
A, Schematics of in vitro colony forming assay and in vivo vessel formation assays using AbcCRECs from ABCG2TT mice. B, Distribution of AbcCRECs (TdTomato+, red) in P1 mouse heart blood vessels (TdTomato, red; CD31, cyan; ERG, gray) after tamoxifen injection at P0. Arrows indicate examples of co-localization of TdTomato and CD31 in capillaries (dashed) and large vessels (solid). C, OP9 co-cultured in vitro EC colonies (7 days) derived from TdTomato+ (top panels) or TdTomato (bottom panels) heart ECs of P1 ABCG2TT mice after tamoxifen injection at P0. Data represents results derived from 4 mice. D, Quantitation of frequencies of colony forming cells in heart TdTomato+ (red bar) and TdTomato (blue bar) ECs from P1 ABCG2TT mice after tamoxifen injection at P0. Data represent mean ± s. d. (n=4 mice from 2 independent experiments). E, Representative picture (from 4 mice) showing the perfusion of P1 ABCG2TT mouse heart single TdTomato+ ECs derived vessel 2 weeks after transplantation (TdTomato, red; CD31, cyan; Isolectin B4 (IB4), yellow). F, Representative pictures of P1 ABCG2TT-GFP heart ECs (P0 tamoxifen injected) derived vessels after primary (top panels) and secondary (bottom panels) transplantation in Matrigel plugs. (TdTomato, red; GFP, green; CD31, cyan; DAPI, gray). All donor derived cells (including OP9 stromal cells) were labeled with GFP using lentivirus. G, Percentage of TdTomato+ ECs in P1 ABCG2TT-GFP heart ECs (P0 tamoxifen injected, all donor cells were labeled with GFP using lentivirus) before transplant and after 1st and 2nd transplantations in Matrigel plugs. Data represent mean ± s. d. (n=6 donor mice). p values, one-way ANOVA.
Figure 2.
Figure 2.. Human CRECs are labeled by ABCG2.
A, Representative pictures (from 3 patients) showing the distribution of ABCG2+ ECs (arrows) in human umbilical artery (HUAEC, top panels) and vein (HUVEC, bottom panels). Right panels show merged picture with ABCG2, CD31 and DAPI (ABCG2, magenta; hCD31, green, CD31; DAPI, yellow). B, Flow cytometry data (represents 6 patients) showing the percentage of ABCG2+ ECs in freshly isolated human umbilical artery (HUAEC) or vein (HUVEC) ECs. C, Quantitation of data from B. Data represent mean ± s. d. p values (n=6 patients). D, Percentage of EC colony forming cells in freshly isolated ABCG2+ and ABCG2 CD31+CD45 HUVECs. p values, Wilcoxon signed-rank test. (n=7 patients from 5 independent experiments). E, Single ABCG2+ HUVEC derived blood vessels (represent 4 patients) 2 weeks after transplantation (hCD31, cyan). F, Single ABCG2+ HUVEC derived arteries (arrow) and capillaries 2 weeks after co-transplantation with OP9-DL1. Right panel shows merged picture with CD31 and SMA (hCD31, cyan, smooth muscle actin α (SMA), red). G, ABCG2+ ECs (arrows) in adult human saphenous vein (hCD31, green; ABCG2, magenta). H, Representative flow cytometry analysis showing the percentage of ABCG2+ ECs in human adipose tissues. I, Quantitation of data from H. Data represent mean ± s. d. p values (n=4 patients). J. Representative pictures showing the localization of ABCG2+ ECs (arrows) in human adipose tissue (ABCG2, red; hCD31, green; Perillipin, yellow; DAPI, blue).
Figure 3.
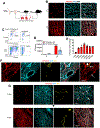
Figure 3.. AbcCRECs contribute to vessel growth in vivo during development.
A, Schematics of lineage tracing experiment using ABCG2TT mice to test the contribution of P1 AbcCRECs to vasculature development in multiple organs. B, P1 (top panels, representative of 5 animals) and 3-week-old (bottom panels, representative of 7 animals) ABCG2TT mice heart after tamoxifen injection at P0 (TdTomato, red; CD31, cyan; ERG, gray). Single TdTomato+ AbcCREC (arrows) at P1 developed into contiguous TdTomato+ vessels at P21. C, Representative flow cytometry chart (from 5 P1 and 7 P21 mice) showing the increase of the percentage of TdTomato+ ECs from P1 (top) to P21 (bottom) heart in ABCG2TT mice (left panels) after P0 tamoxifen injection. D, Quantitation of TdTomato+ (red bars) and TdTomato (blue bars) EC number in P1 (left) and P21 (right) ABCG2TT mice heart after tamoxifen injection at P0. Data represent mean ± s. d. (P1: n=5; P21: n=7. From 2 independent experiments). E, Quantitation of percentage of TdTomato+ ECs in multiple developmental stages of ABCG2TT mice heart after tamoxifen injection at P0. Data represent mean ± s. d. (P1: n=5; P3: n=6; P10: n=4; P21: n=7; P56: n=5; P300: n=7; P540: n=3. From 2 independent experiments). F, Representative pictures (from 7 mice) show the contribution of P0 labeled TdTomato+ (red) AbcCRECs to arterial (arrowhead), venous (dashed arrow) and capillary ECs (CD31, cyan), but not smooth muscle cells (SMA, yellow, arrow) of 3-week-old ABCG2TT mice heart. G, Representative pictures showing the contribution of P0 labeled TdTomato+ AbcCRECs (red, arrows) at P1 skin contribute to arteries (SMA, yellow) and capillary ECs of P7 ABCG2TT mice skin. Data represents the results derived from 7 mice.
Figure 4.
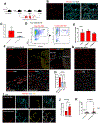
Figure 4.. AbcCRECs maintain adult blood vessels.
A, Schematics of lineage tracing experiment using ABCG2TT mice to test the contribution of adult AbcCRECs to vasculature development in multiple organs. B. Representative pictures (from 5 mice) showing the distribution of TdTomato+ AbcCRECs (arrows) in 6-week-old heart of ABCG2TT mice 24 hours after tamoxifen injection (TdTomato, red; CD31, cyan; DAPI, gray). C, Frequency of colony forming cells in TdTomato+ and TdTomato EC from 6-week-old ABCG2TT heart with tamoxifen injected 24 hours before sorting. Data represent mean ± s. d. (n=4 mice). D, Flow cytometry data showing the percentage of TdTomato+ cells in adult heart ECs of ABCG2TT mice that had received tamoxifen injection 24 hours (left panel) and 6 weeks (right panel) before the analysis. E, Quantitation of percentage of TdTomato+ ECs in adult ABCG2TT mice heart 1 day, 6 weeks, and 12 weeks after tamoxifen injection at 6-week-old. Data represent mean ± s. d. (1 day, n=5; 6 weeks, n=4;12 weeks, n=5). F, Representative pictures (from 3 mice) showing the heart of ABCG2TT mice 4 weeks after myocardial infarction (MI) injury. Lower panels show areas of infarct area (bottom left) and remote zone (bottom right. TdTomato, red; CDH5, yellow; ERG, cyan). G, Representative pictures (from 3 mice) showing the heart of ABCG2TT mice 4 weeks after sham operation (TdTomato, red; ERG, cyan). H, Percentage of AbcCRECs derived TdTomato + ECs in heart infarct area, remote zone 4 weeks after MI injury, and heart 4 weeks after sham operation. Data represent mean ± s. d. p value, one-way ANOVA (n=3 mice). I, Representative pictures showing 1 day (top panel, from 4 mice) after tamoxifen was injected into adult mice, TdTomato+ ECs were mostly single cells (arrows) while after 6 weeks (bottom panel, from 4 mice) TdTomato+ ECs formed clusters that contain several TdTomato+ ECs (dashed arrows. TdTomato, red; CD31, cyan; SMA, yellow). J, Quantitation of percentage of TdTomato+ ECs in adult ABCG2TT mice skin 1 day and 12 weeks after tamoxifen injection at 8-week-old. Data represent mean ± s. d. (n=5 mice). K, Quantitation of the number of nuclei in each continuous TdTomato+ EC cluster from skin of ABCG2TT mice 1 day or 6 weeks after tamoxifen injection at 8-week-old. Data represent mean ± s. d. p values, Mann-Whitney U test. (1 day: n= 143 clusters from 4 mice; 6 weeks: n=177 clusters from 4 mice). Pictures correlate to Figure S4H.
Figure 5.
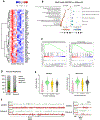
Figure 5.. Transcriptome and epigenetic analysis for AbcCRECs.
A, Heatmap of blood vessel developmental genes and self-renewal genes differently expressed (∣LogFC∣ >1, FDR < 0.05, colors indicate LogFC) in adult heart AbcCRECs and mature ECs (n=5). B, Gene Ontology Biological Process (GOBP) analysis of enriched biological process pathways in adult heart AbcCRECs versus mature ECs. Top 15 pathways with FDR < 0.05 are shown. C, Gene set enrichment analysis (GSEA) of the enriched expression values of Notch pathway (left panel) genes and Wnt signaling pathway (right panel) genes in adult heart AbcCRECs. D, Genes carry histone H3-lysine4 trimethylation (K4me3, K4) and lysine 27 trimethylation (K27me3, K27) at promoter region in adult heart AbcCRECs and mature ECs. E, Expression level of K4me3 modified, K27me3 modified, bivalently modified, or not modified genes in adult heart AbcCRECs and mature ECs. Y-axis indicates the relative expression of each gene (After inter-library normalization and linear model dispersion). F, K4me3 and K27me3 histone modifications on promoter regions of gene Notch2 and Hey2 in adult heart AbcCRECs and mature ECs. Horizontal bars represent significantly peaks.

References

    1. Barker N. Adult intestinal stem cells: critical drivers of epithelial homeostasis and regeneration. Nature reviews Molecular cell biology. 2014;15:19–33. - PubMed
    1. Eaves CJ. Hematopoietic stem cells: concepts, definitions, and the new reality. Blood. 2015;125:2605–13. - PMC - PubMed
    1. Ingram DA, Mead LE, Tanaka H, Meade V, Fenoglio A, Mortell K, Pollok K, Ferkowicz MJ, Gilley D and Yoder MC. Identification of a novel hierarchy of endothelial progenitor cells using human peripheral and umbilical cord blood. Blood. 2004;104:2752–60. - PubMed
    1. Ingram DA, Mead LE, Moore DB, Woodard W, Fenoglio A and Yoder MC. Vessel wall-derived endothelial cells rapidly proliferate because they contain a complete hierarchy of endothelial progenitor cells. Blood. 2005;105:2783–6. - PubMed
    1. Naito H, Wakabayashi T, Kidoya H, Muramatsu F, Takara K, Eino D, Yamane K, Iba T and Takakura N. Endothelial Side Population Cells Contribute to Tumor Angiogenesis and Antiangiogenic Drug Resistance. Cancer research. 2016;76:3200–10. - PubMed

MeSH terms

Substances

LinkOut - more resources