. 2024 Jun 24;52(11):6298-6316.
doi: 10.1093/nar/gkae313.

Senescence of human pancreatic beta cells enhances functional maturation through chromatin reorganization and promotes interferon responsiveness

Affiliations

Senescence of human pancreatic beta cells enhances functional maturation through chromatin reorganization and promotes interferon responsiveness

Milan Patra et al. Nucleic Acids Res. .

Erratum in

Abstract

Senescent cells can influence the function of tissues in which they reside, and their propensity for disease. A portion of adult human pancreatic beta cells express the senescence marker p16, yet it is unclear whether they are in a senescent state, and how this affects insulin secretion. We analyzed single-cell transcriptome datasets of adult human beta cells, and found that p16-positive cells express senescence gene signatures, as well as elevated levels of beta-cell maturation genes, consistent with enhanced functionality. Senescent human beta-like cells in culture undergo chromatin reorganization that leads to activation of enhancers regulating functional maturation genes and acquisition of glucose-stimulated insulin secretion capacity. Strikingly, Interferon-stimulated genes are elevated in senescent human beta cells, but genes encoding senescence-associated secretory phenotype (SASP) cytokines are not. Senescent beta cells in culture and in human tissue show elevated levels of cytoplasmic DNA, contributing to their increased interferon responsiveness. Human beta-cell senescence thus involves chromatin-driven upregulation of a functional-maturation program, and increased responsiveness of interferon-stimulated genes, changes that could increase both insulin secretion and immune reactivity.


Figures

Graphical Abstract
Graphical Abstract
Figure 1.
Figure 1.
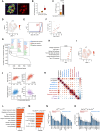
p16high beta cells express genes associated with senescence and functional maturity. (A) Pancreatic islets from adult human subject stained for Insulin (INS) marking beta cells, and for p16. Blue (DAPI) marks DNA. Scale bar = 50 μm. (B) p16 protein levels in individual beta cells from 5 adult human subjects measured by image analysis of stained sections. Cells are divided into p16neg (bottom 20th percentile) n = 804, p16low (20–80th percentile) n = 2410, and p16high (top 20th percentile) n = 804. y axis fluorescence intensity values represent arbitrary units (a.u.). (C) Percentage of p16high beta cells detected in 11 human subjects, divided into age groups as indicated. t test. (D) UMAP of 3679 single pancreatic beta cells from 31 human subjects included in the analyzed scRNA-seq dataset, showing expression levels of the senescence marker gene p16 (CDKN2A). (E) p16 mRNA levels in the same cells, sorted by transcript levels. Values represent log2((counts per million/10) + 1). Red rectangle marks cells in which the p16 transcript was detected. (F) Percentage of cells with detected p16 transcript expression in patients with known ages in the datasets shown in panel 1D, and in Supplementary Figure S2A. n = 19, non-diabetic subjects. R indicates Pearson correlation value. (G) Plot of all protein-coding genes expressed in beta cells (dots) ranked by the degree of the correlation of their expression levels to p16 across analyzed beta cells, calculated by SAVER. Left brackets indicate the top 100 most correlated genes, defined as the p16-associated signature, as well as the top 250 and top 500 ranked genes. Boxes show representative genes from enriched gene sets, labeled by color. (H) Gene-set enrichment analysis (GSEA) of genes ranked by their correlation to p16 expression across cells. x axis indicates normalized enrichment scores (NES) of gene sets in positively correlated genes (Padj ≤ 0.1). (I) UMAP of the pancreatic beta cells showing expression levels of p21 (CDKN1A). (J) Plots indicating the expression score of the p16-associated signature (x axis) in individual beta cells (dots) relative to scores of other indicated gene signatures in the same cells. R values indicate Pearson correlation between the signatures across cells. P< 10−55 for all correlations. (K) Matrix of Pearson correlation values between expression scores of indicated gene signatures (as individually plotted in panel J). Matrix colors indicate R values as in scale on right. Asterisks indicate P values of correlations: *P< 0.05, **P< 0.005, ***P< 0.0005. Gene sets associated with senescence are labeled in blue (IR = ionizing radiation, sen = senescence), gene sets associated with beta cell functional maturation are labelled in red, and gene sets associated with the cell cycle are labelled in purple. (L) Upregulated gene sets in p16high relative to p16neg beta cells (top and bottom 30th percentiles, respectively, as defined by SAVER, n = 714 each). x axis indicates –log(Padj), hypergeometric test (Metascape). (M) Upregulated gene sets in cells expressing high levels of the replicative senescence signature (Rep Senhigh) relative to cell expressing low levels of this signature (Rep Senlow, top and bottom 30th percentiles, respectively, n = 714). (N, O) mRNA levels of indicated beta-cell functional maturation genes (left) and senescence and p53-target genes (right) in p16high vs p16neg beta cells (N) and in Rep Senhigh versus Rep Senlow beta cells (O). Cells of non-diabetic individuals are included. Values indicate mean of log2 fold-change (FC) of senescent versus non-senescent, Padj < 0.05 for all comparisons. Error bars indicate 95% confidence interval.
Figure 2.
Figure 2.
p16high beta cells express elevated levels of interferon-response genes but no SASP. (A) Matrix of Pearson correlation values between expression scores of indicated gene signatures in individual beta cells (as analyzed in Figure 1K). Gene sets associated with senescence are labeled in blue, gene sets associated with the interferon response are labelled in green. (B) Plots indicating the expression score of the p16-associated signature (x axis) in individual beta cells (dots) relative to scores of other indicated gene signatures in the same cells. R values indicate Pearson correlation between the signatures across cells. P< 10−110 for all correlations, except P= 0.05 for the SASP signature. (C) Average scores of the IFN-response and SASP signatures in p16high versus p16neg cells. (D, E) mRNA levels of indicated interferon response (left) and SASP genes (right) in p16high versus p16neg beta cells (D) and in Rep Senhigh versus Rep Senlow beta cells (E). Cells of non-diabetic individuals are included. Values indicate mean of log2 fold-change (FC) of senescent versus non-senescent. Padj < 0.05 for all comparisons. Error bars indicate 95% confidence interval. (F) Pancreatic islets from adult human subject stained for Insulin (INS) marking beta cells, for p16, and for HLA-I. Blue (DAPI) marks DNA. Arrows indicate p16high cells. Scale bar = 10 μm. (G) HLA-I protein levels in individual beta cells in p16neg and p16high measured by image analysis of stained sections. n = 907 per group, from seven subjects. t test. (H) FACS analysis of dissociated human islet cells obtained live from adult human donor, stained for ENTPD3 marking beta cells, SA-βGal marking senescence, and HLA-I. Plots include only beta cells. Blue and black lines indicate HLA-I levels in the SA-βGal+ versus the SA-βGal cell fraction in the same islets; red and orange lines indicate levels in the same cell fractions in islets treated with IFNα for 24 h. (I) Average HLA-I levels in senescent and non-senescent beta cells in human islets obtained from three adult human donors, treated with IFNα for 24 h or untreated, as shown in panel H. Values indicate mean fluorescent intensity (MFI) of samples, normalized to non-senescent untreated cells, ±SEM, t test.
Figure 3.
Figure 3.
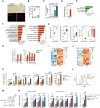
Senescence of cultured human beta-like cells induces functional maturation genes and increases interferon responsiveness. (A) EndoC-βH3 cells with or without CreER activation (non-Sen and Sen, respectively) stained for the senescence marker SA-βGal (top, blue) or for Insulin (bottom, red) and the proliferation marker Ki67 (green). Scale bar = 100 μm. (B) Percentage of Ki67+ non-senescent and senescent EndoC-βH3 cells stained as in (A). Mean of n = 6 replicates ± SEM, t test. (C) Glucose-stimulated insulin secretion (GSIS) of non-senescent and senescent EndoC-βH3 cells. Insulin levels in medium were measured by ELISA in cells exposed to low (1.5 mM) or high (20 mM) glucose levels. Mean of n = 3 replicates ± SEM, t test. (D) Levels of p21 mRNA in senescent and non-senescent cells as measured by mRNA-seq. Mean of n = 6 replicates ± SEM Padj < 0.001, DESeq2. (E) Gene sets downregulated in senescent EndoC-βH3 cells. x axis indicates log(Padj) (Metascape). (F) Gene sets upregulated in senescent EndoC-βH3 cells, measured by mRNA-seq, calculated by Metascape (left) or by MSigDB (right). (G) Scores of indicated signatures in non-senescent and senescent EndoC-βH3 cells. Boxes indicate interquartile values with indicated median of n = 6 replicates, t test. (H) Relative mRNA levels of indicated genes in non-senescent and senescent EndoC-βH3 cells measured by mRNA-seq. Mean of n = 6 replicates ± SEM, Padj < 0.001 for all comparisons, DESeq2. (I, J) Heat maps representing scaled log2 expression levels of PDX1 and MAF target genes (I) and of interferon-stimulate genes (J) in non-senescent and senescent EndoC-βH3 cells (n = 4 replicates). (K) mRNA levels of indicated interferon-stimulated genes in non-senescent and senescent EndoC-βH3 cells untreated or treated with IFNα, measured by qRT-PCR. Mean of n = 3 experimental repeats ± SEM, normalized to untreated non-senescent cells, t test. (L) FACS analysis HLA-I levels in non-senescent and senescent EndoC-βH3 cells, untreated or treated with IFNα for 24 h. (M) Western blot of phospho-STAT1 and total STAT1 levels in non-senescent and senescent EndoC-βH3 cells, untreated or treated with IFNα for 24 h. GAPDH serves as loading control. (N) mRNA levels of indicated functional maturation and interferon-stimulated genes in non-senescent and senescent EndoC-βH3 cells expressing a control vector or a p16 overexpression vector, measured by qRT-PCR. Mean of n = 3 experimental repeats ± SEM, normalized to control non-senescent cells, t test.
Figure 4.
Figure 4.
Enhancers of functional maturation and interferon-response genes are activated in senescent beta-like cells. (A) Staining of heterochromatin marks H3K27me3 (green) and H3K9me3 (red) in representative non-senescent and senescent EndoC-βH3 cell nuclei. Note heterochromatic foci in the senescent nucleus. Scale bar = 5 μm. (B) Percentage of cells containing heterochromatic foci per microscopic field in non-senescent and senescent EndoC-βH3 cells. Mean of n = 15 microscopic fields ± SEM, t test. (C) Binding levels of H3K27ac in gene promoters (rows) showing increased (top, n = 232) or decreased (bottom, n = 940) levels in senescent EndoC-βH3 cells (fold change > 1.5, Padj < 0.05). Shown are promoters in which all three activation markers – H3K27ac, H3K4me3 and ATAC-Seq accessibility – were changed. Panels show 6 kb regions spanning the transcription start sites (TSS). Color scale indicates coverage of H3K27ac binding. (D) Gene sets enriched among gene promoters with reduced (green, top) or increased (red, bottom) activation markers in senescent cells (Metascape). (E) ChIP-seq traces showing H3K27ac binding on promoter of the MKI67 cell-cycle gene in non-senescent and senescent cells. y axis shows scaled cumulative read counts. (F) Transcription factor binding motifs enriched in promoters with reduced H3K27ac binding in senescent cells. (G) ChIP-seq traces showing H3K27ac binding on the promoter of the senescence gene CDKN1A (p21) in non-senescent and senescent cells. (H) Binding levels of H3K27ac in gene enhancers (rows) showing increased (top) or decreased (bottom) levels upon senescence of EndoC-βH3 cells (fold change > 1.5, Padj < 0.05). (I) Gene sets enriched among gene enhancers with increased H3K27ac binding in senescent cells (Metascape). (J) ChIP-seq traces showing H3K27ac binding on enhancers of beta-cell regulator genes MAFA, and FOXO1. Bottom marks (red) indicate positions of published enhancer loci (Miguel-Escalada et al.). (K) Transcription factor binding motifs enriched in enhancers with increased H3K27ac binding in senescent cells. (L) Transcription factor footprinting analysis using ATAC-seq data, indicating elevated MAFA binding on active enhancers in senescence. (M, N) Relative levels of H3K27ac binding (M) and of accessibility (ATAC-Seq, N) in enhancers of indicated interferon-stimulated genes, in control and senescent cells. Values indicated mean of DESeq2 normalized counts relative to non-senescent controls. n = 3, ±SEM, t test.
Figure 5.
Figure 5.
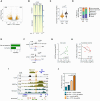
CTCF binding rearrangement in beta-cell senescence. (A) Volcano plot of differential CTCF bound genomic loci (dots) in non-senescent and senescent EndoC-βH3 cells (fold change > 1.5, Padj < 0.2). Shown are sites that contain a CTCF binding motif. x axis indicates log2 fold change of CTCF binding, y axis shows –log10Padj values. (B) CTCF binding levels in genomic sites showing increased (top) or decreased (bottom) binding in senescent cells. (C) Chromatin accessibility in regions (±5 kb) of decreased (dec) or increased (inc) CTCF binding. y axis indicates Log2FC of ATAC-seq signal in senescent versus non-senescent cells. (D) Percentages of indicated genomic regions among decreased and increased CTCF binding sites in senescent EndoC-βH3 cells. (E) Gene set enrichments among genes with reduced promoter CTCF binding in senescent cells. (F) CTCF binding traces on the promoters of the E2F1 and ANK3 cell-cycle genes. (G) Correlation between changed CTCF binding levels (x axis) in sites located on cell-cycle gene promoters (dots) and changed H3K27ac promoter binding. Axes indicate Log2 fold change. (H) Correlation between CTCF binding change (x axis) in sites (dots) located on TAD boundaries between enhancers and promoters, and H3K27ac binding on promoters of associated beta cell functional-maturation genes. (I) CTCF binding traces in the INS gene region in non-senescent and senescent cells, relative to H3K27ac and H3K4me1 binding. Red and green marks on bottom indicate previously characterized enhancers (Miguel-Escalada et al., and Greenwald et al., respectively). The CTCF binding site labelled by yellow rectangle is located between the INS promoter and a distal enhancer cluster. (J) Pre-insulin mRNA levels in non-senescent and senescent cells carrying an sgRNA targeting the region containing the CTCF binding site indicated in panel (I) or a control sgRNA measured by qRT-PCR. Values are mean of n = 3 replicates, normalized to control non-senescent cells ± SEM, t test.
Figure 6.
Figure 6.
Senescent beta cells harbor elevated levels of cytoplasmic DNA. (A) Non-senescent and senescent EndoC-βH3 cells stained with antibodies against Insulin (white, left) and against dsDNA (green, right). DNA foci in the cytoplasms of senescent cells are indicated by arrows. (B) Same cells stained with the sensitive DNA dye SYBR Gold indicating cytoplasmic DNA foci (arrows). (C) Percentage of non-senescent and senescent EndoC-βH3 cells carrying cytoplasmic DNA foci, as stained in (A). Values indicate mean of 387 non-senescent cells in n = 5 microscopic fields and 459 senescent cells in n = 17 fields, ±SEM, t test. (D) Senescent EndoC-βH3 cell with a micronucleus (arrow) stained with the DNA dye SYBR Gold and an antibody against Histone H3 (red). (E) Percentage of non-senescent and senescent EndoC-βH3 cells carrying micronuclei, scored as in panel C. (F) Section of adult human pancreatic islet stained for Insulin (green), p16 (red), and dsDNA (white). Upper panel shows low magnification of islet (scale bar = 50 μm); lower panels show higher magnification of a p16high beta cell containing cytoplasmic DNA foci (arrows). (G) Percentage of p16neg and p16high cells carrying cytoplasmic DNA foci, as stained in (F). Values indicate mean percentage in n = 4 subjects ± SEM, t test. A total of 506 p16neg and 776 p16high cells were scored. (H) mRNA levels of indicated interferon-stimulated genes in non-senescent and senescent EndoC-βH3 cells infected for 3 days with a control shRNA vector, or an shRNA targeting cGAS, measured by qRT-PCR. (I) mRNA levels of indicated interferon-stimulated genes in non-senescent and senescent EndoC-βH3 cells, untreated or treated with the STING inhibitor H-151 overnight, measured by qRT-PCR. Graphs in H, I show mean of n = 3 experimental repeats ± SEM, normalized to control non-senescent cells, t test. Scale bar in A, C, G, E (bottom) =1 0 μm, in E (top) = 50 μm.

References

    1. He S., Sharpless N.E. Senescence in health and disease. Cell. 2017; 169:1000–1011. - PMC - PubMed
    1. Gorgoulis V., Adams P.D., Alimonti A., Bennett D.C., Bischof O., Bishop C., Campisi J., Collado M., Evangelou K., Ferbeyre G. et al. . Cellular senescence: defining a path forward. Cell. 2019; 179:813–827. - PubMed
    1. Di Micco R., Krizhanovsky V., Baker D., d’Adda di Fagagna F. Cellular senescence in ageing: from mechanisms to therapeutic opportunities. Nat. Rev. Mol. Cell Biol. 2021; 22:75–95. - PMC - PubMed
    1. Olan I., Narita M. Senescence: an identity crisis originating from deep within the nucleus. Annu. Rev. Cell Dev. Biol. 2022; 38:219–239. - PubMed
    1. Krishnamurthy J., Torrice C., Ramsey M.R., Kovalev G.I., Al-Regaiey K., Su L., Sharpless N.E. Ink4a/Arf expression is a biomarker of aging. J. Clin. Invest. 2004; 114:1299–1307. - PMC - PubMed

MeSH terms