. 2024 Jul 1;14(7):1324-1355.
doi: 10.1158/2159-8290.CD-23-0428.

Senescence Defines a Distinct Subset of Myofibroblasts That Orchestrates Immunosuppression in Pancreatic Cancer

Affiliations

Senescence Defines a Distinct Subset of Myofibroblasts That Orchestrates Immunosuppression in Pancreatic Cancer

Jad I Belle et al. Cancer Discov. .

Abstract

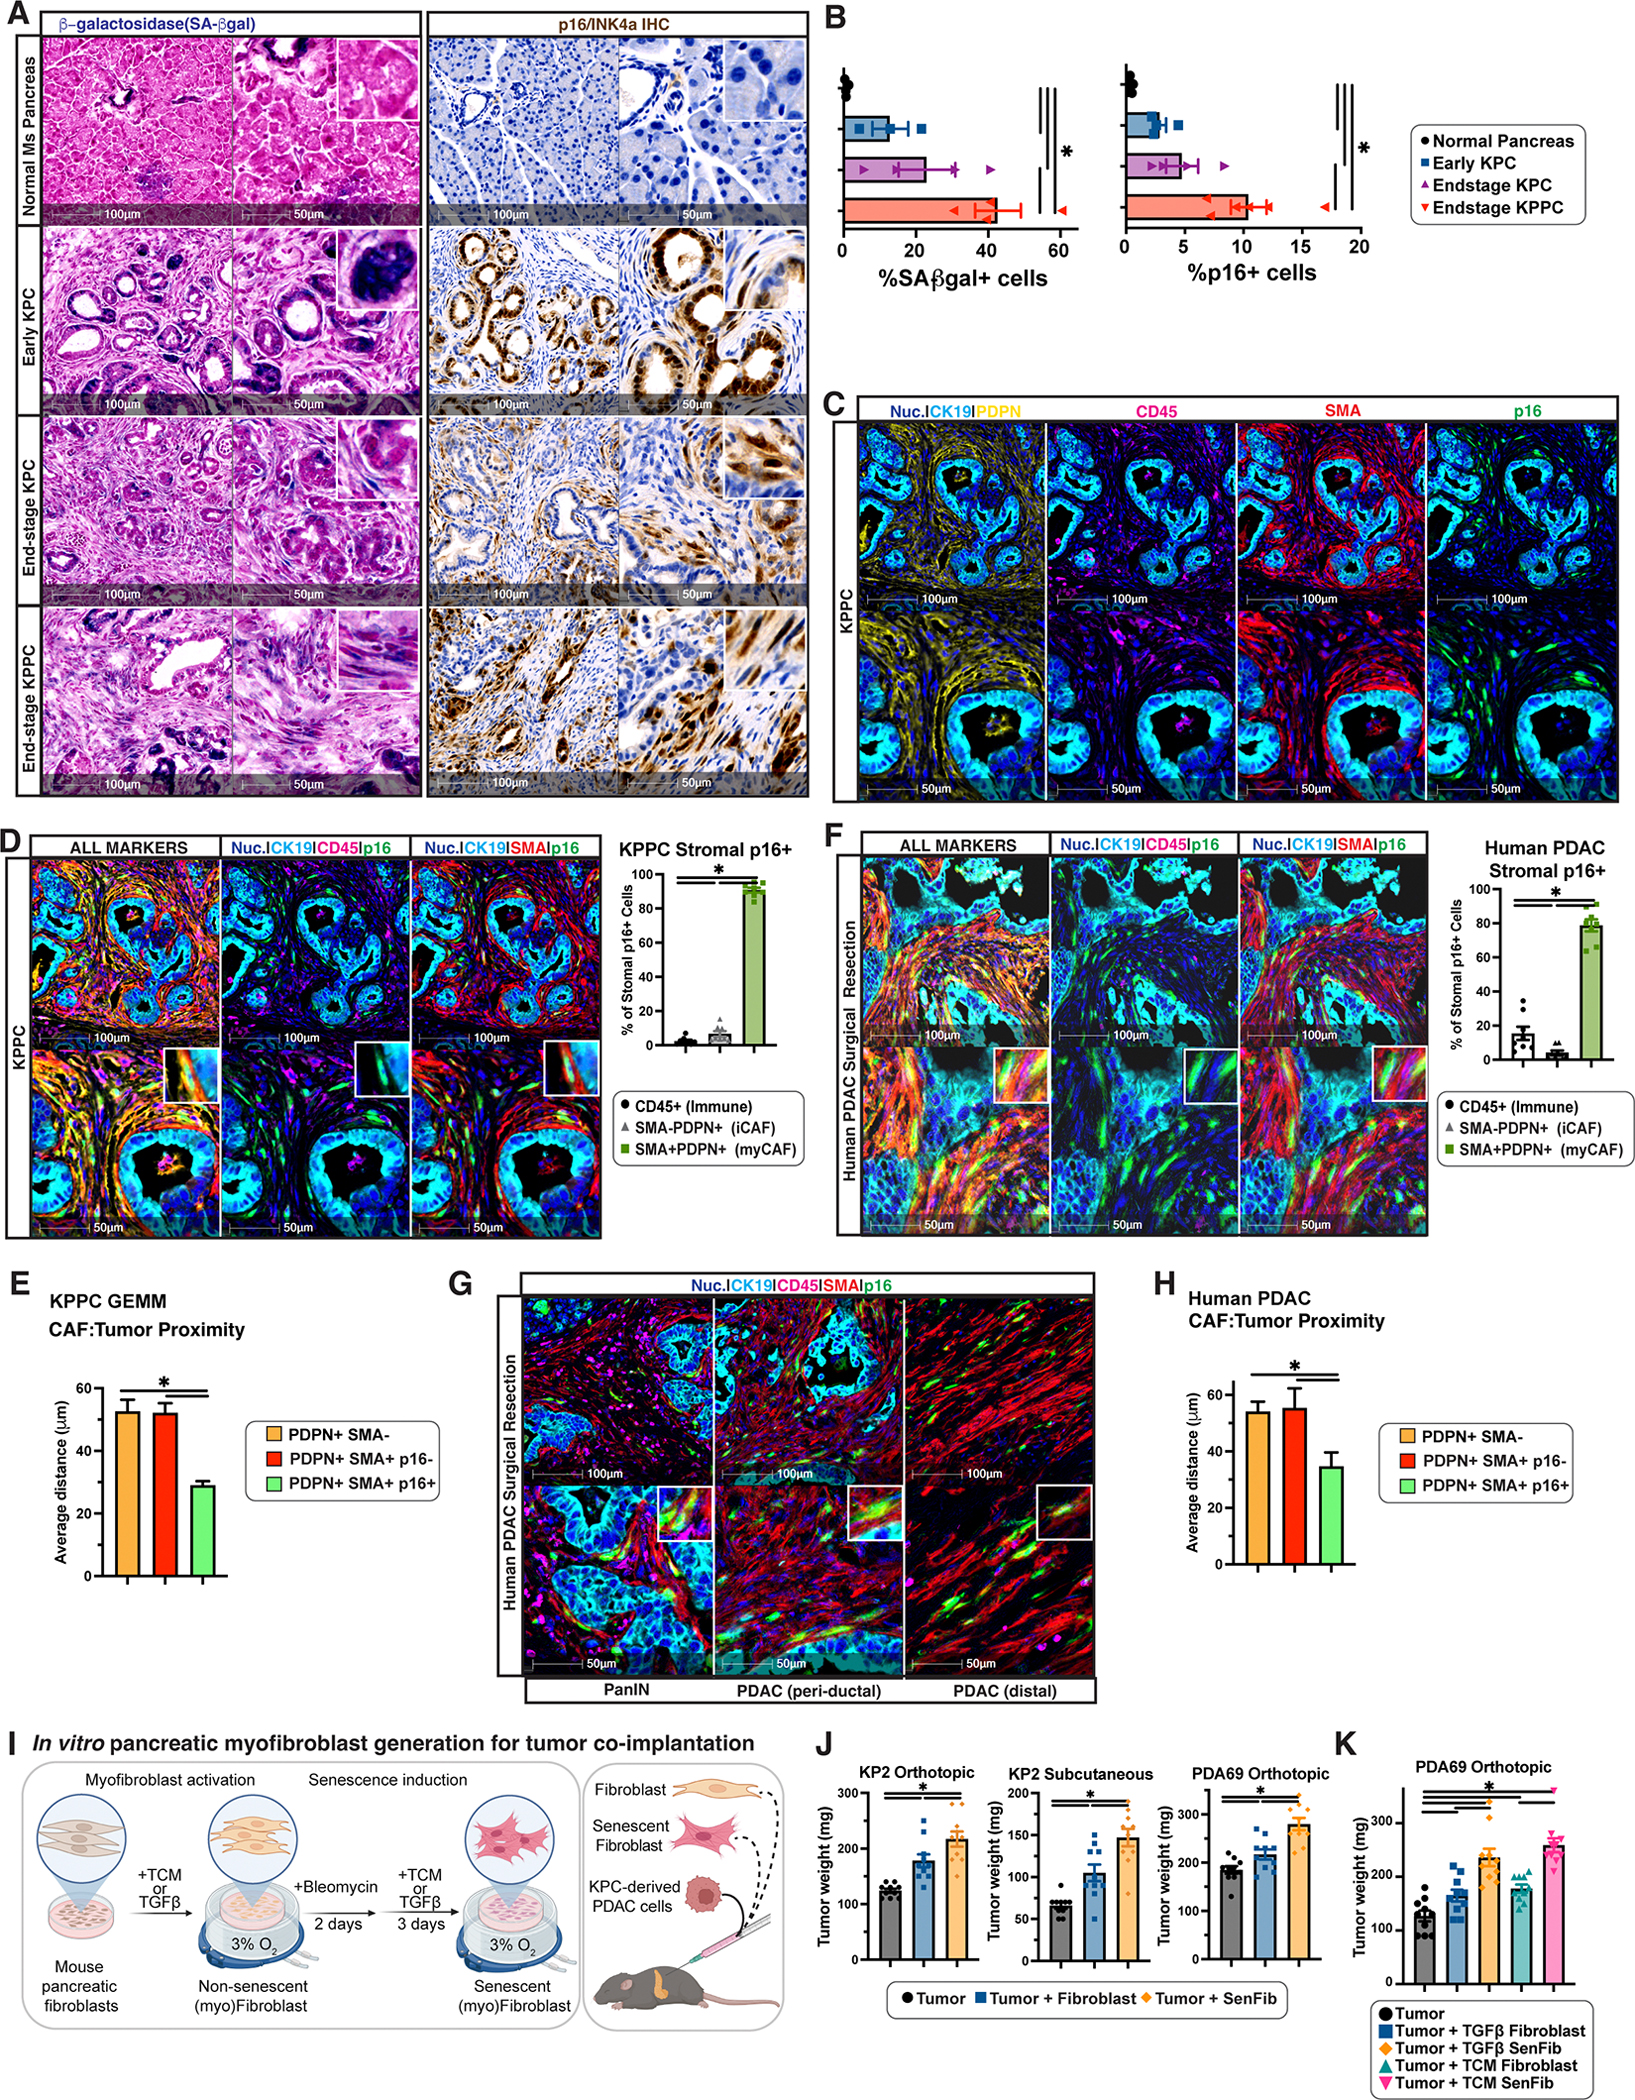
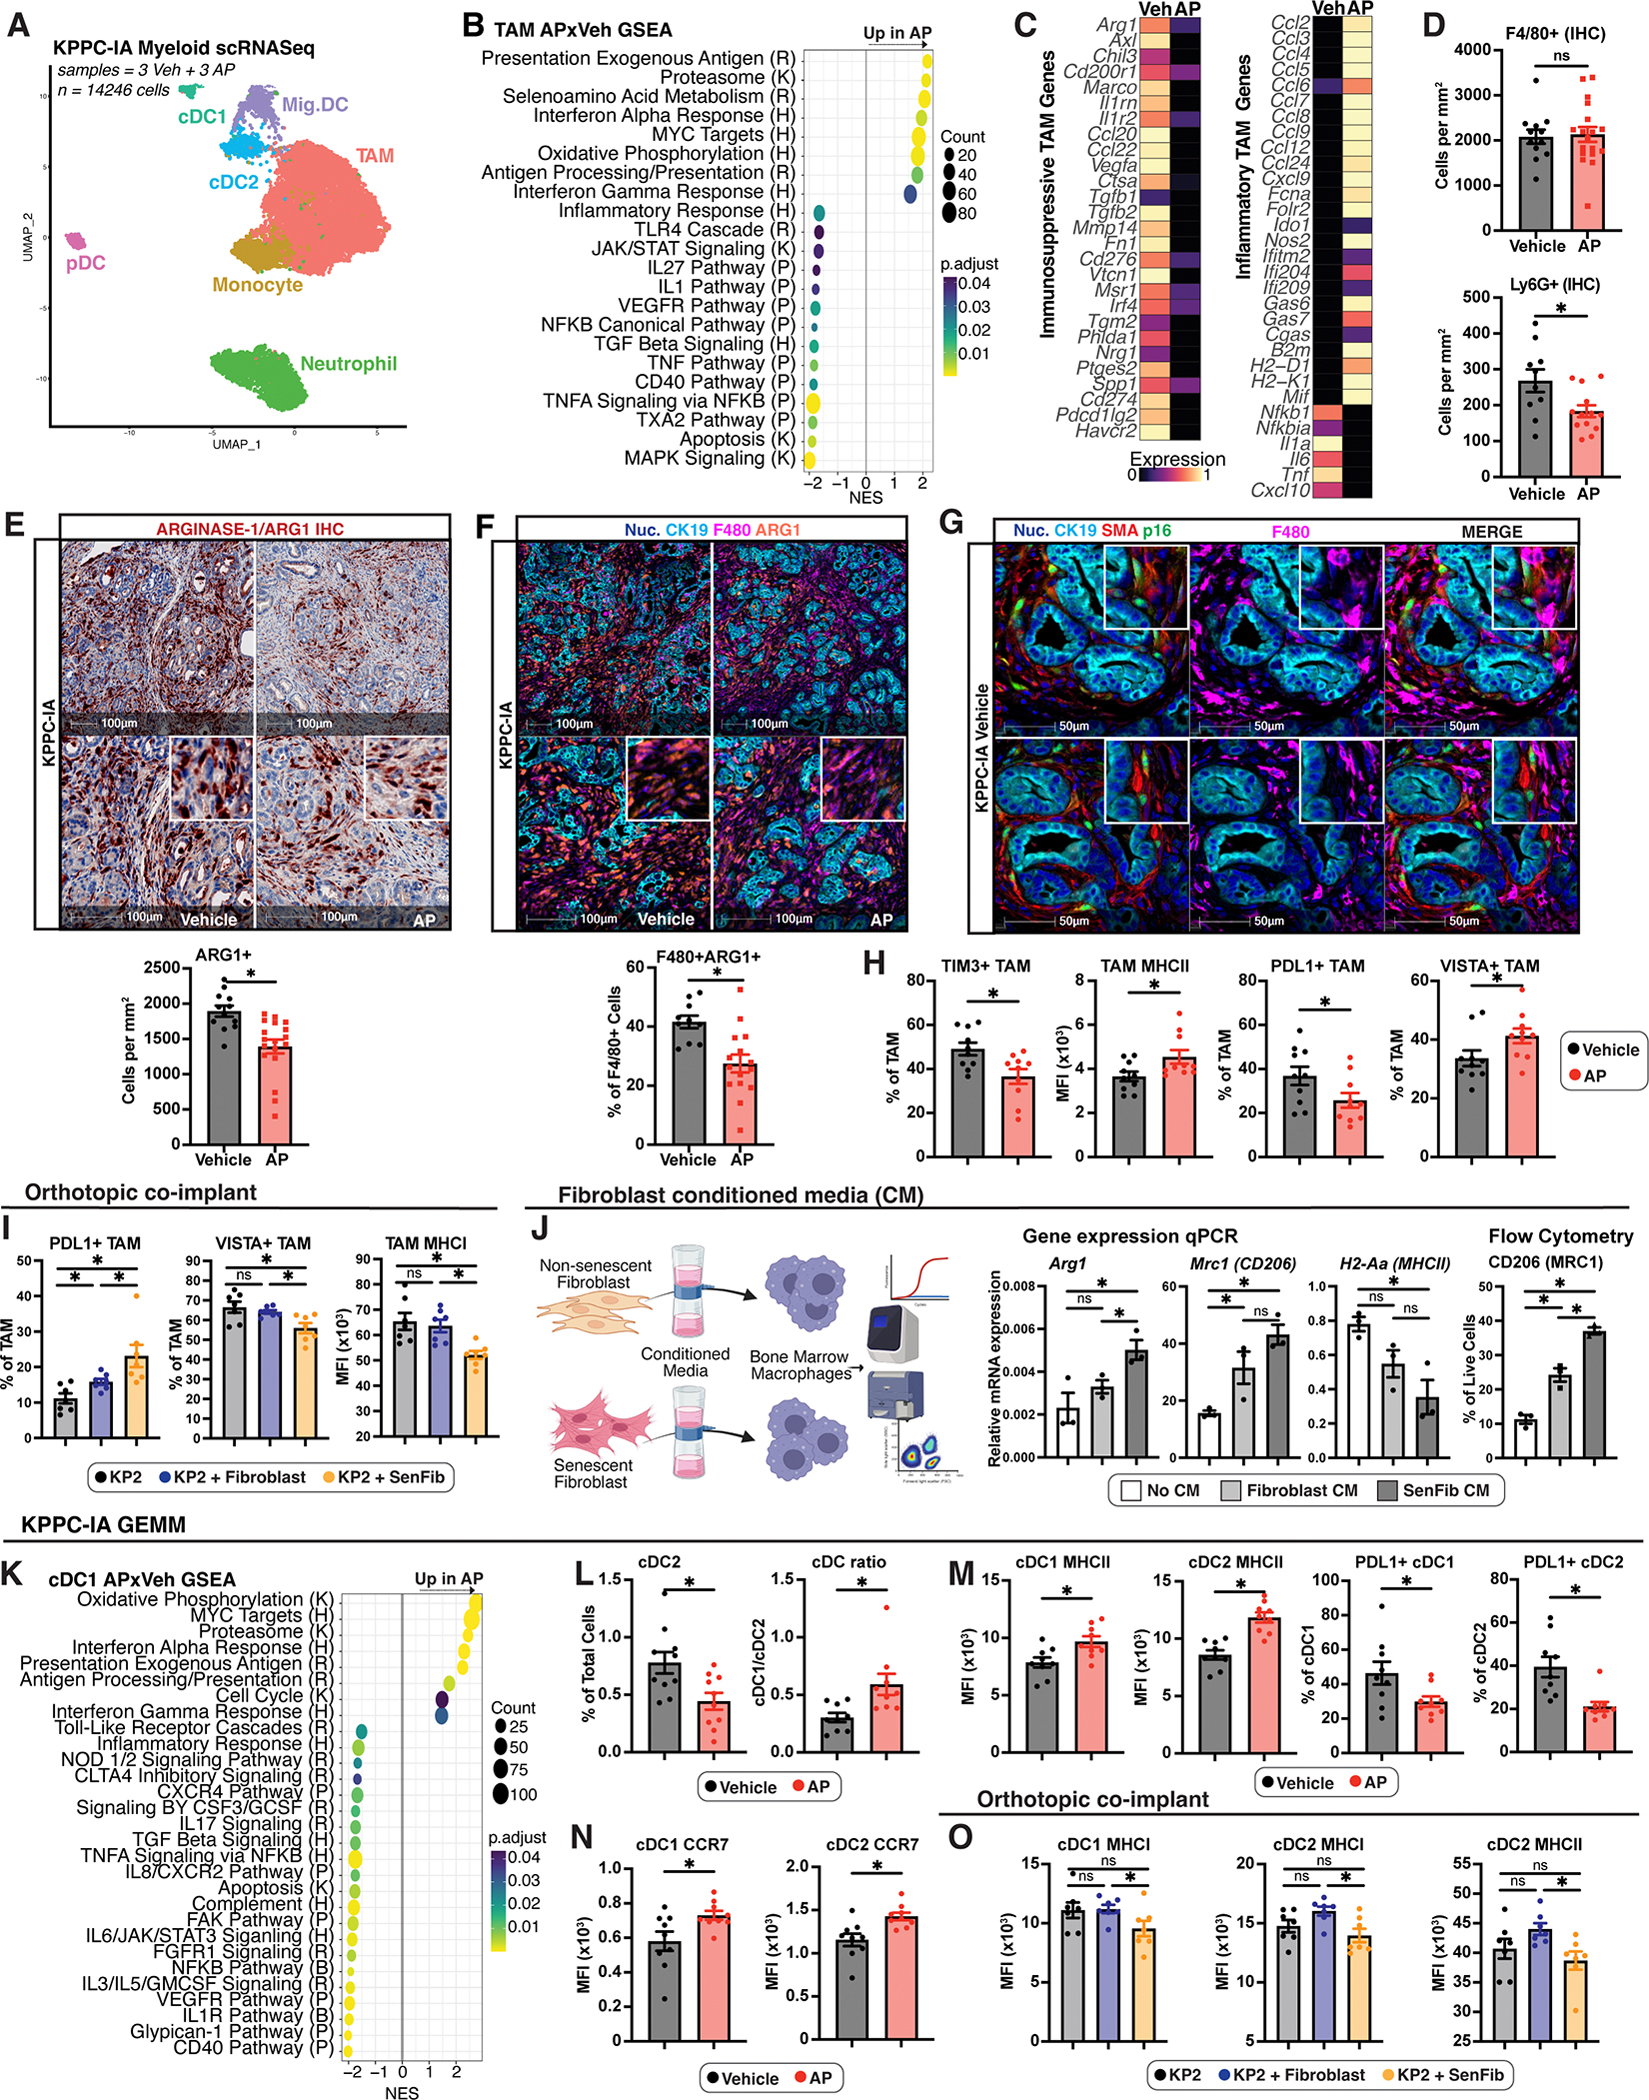
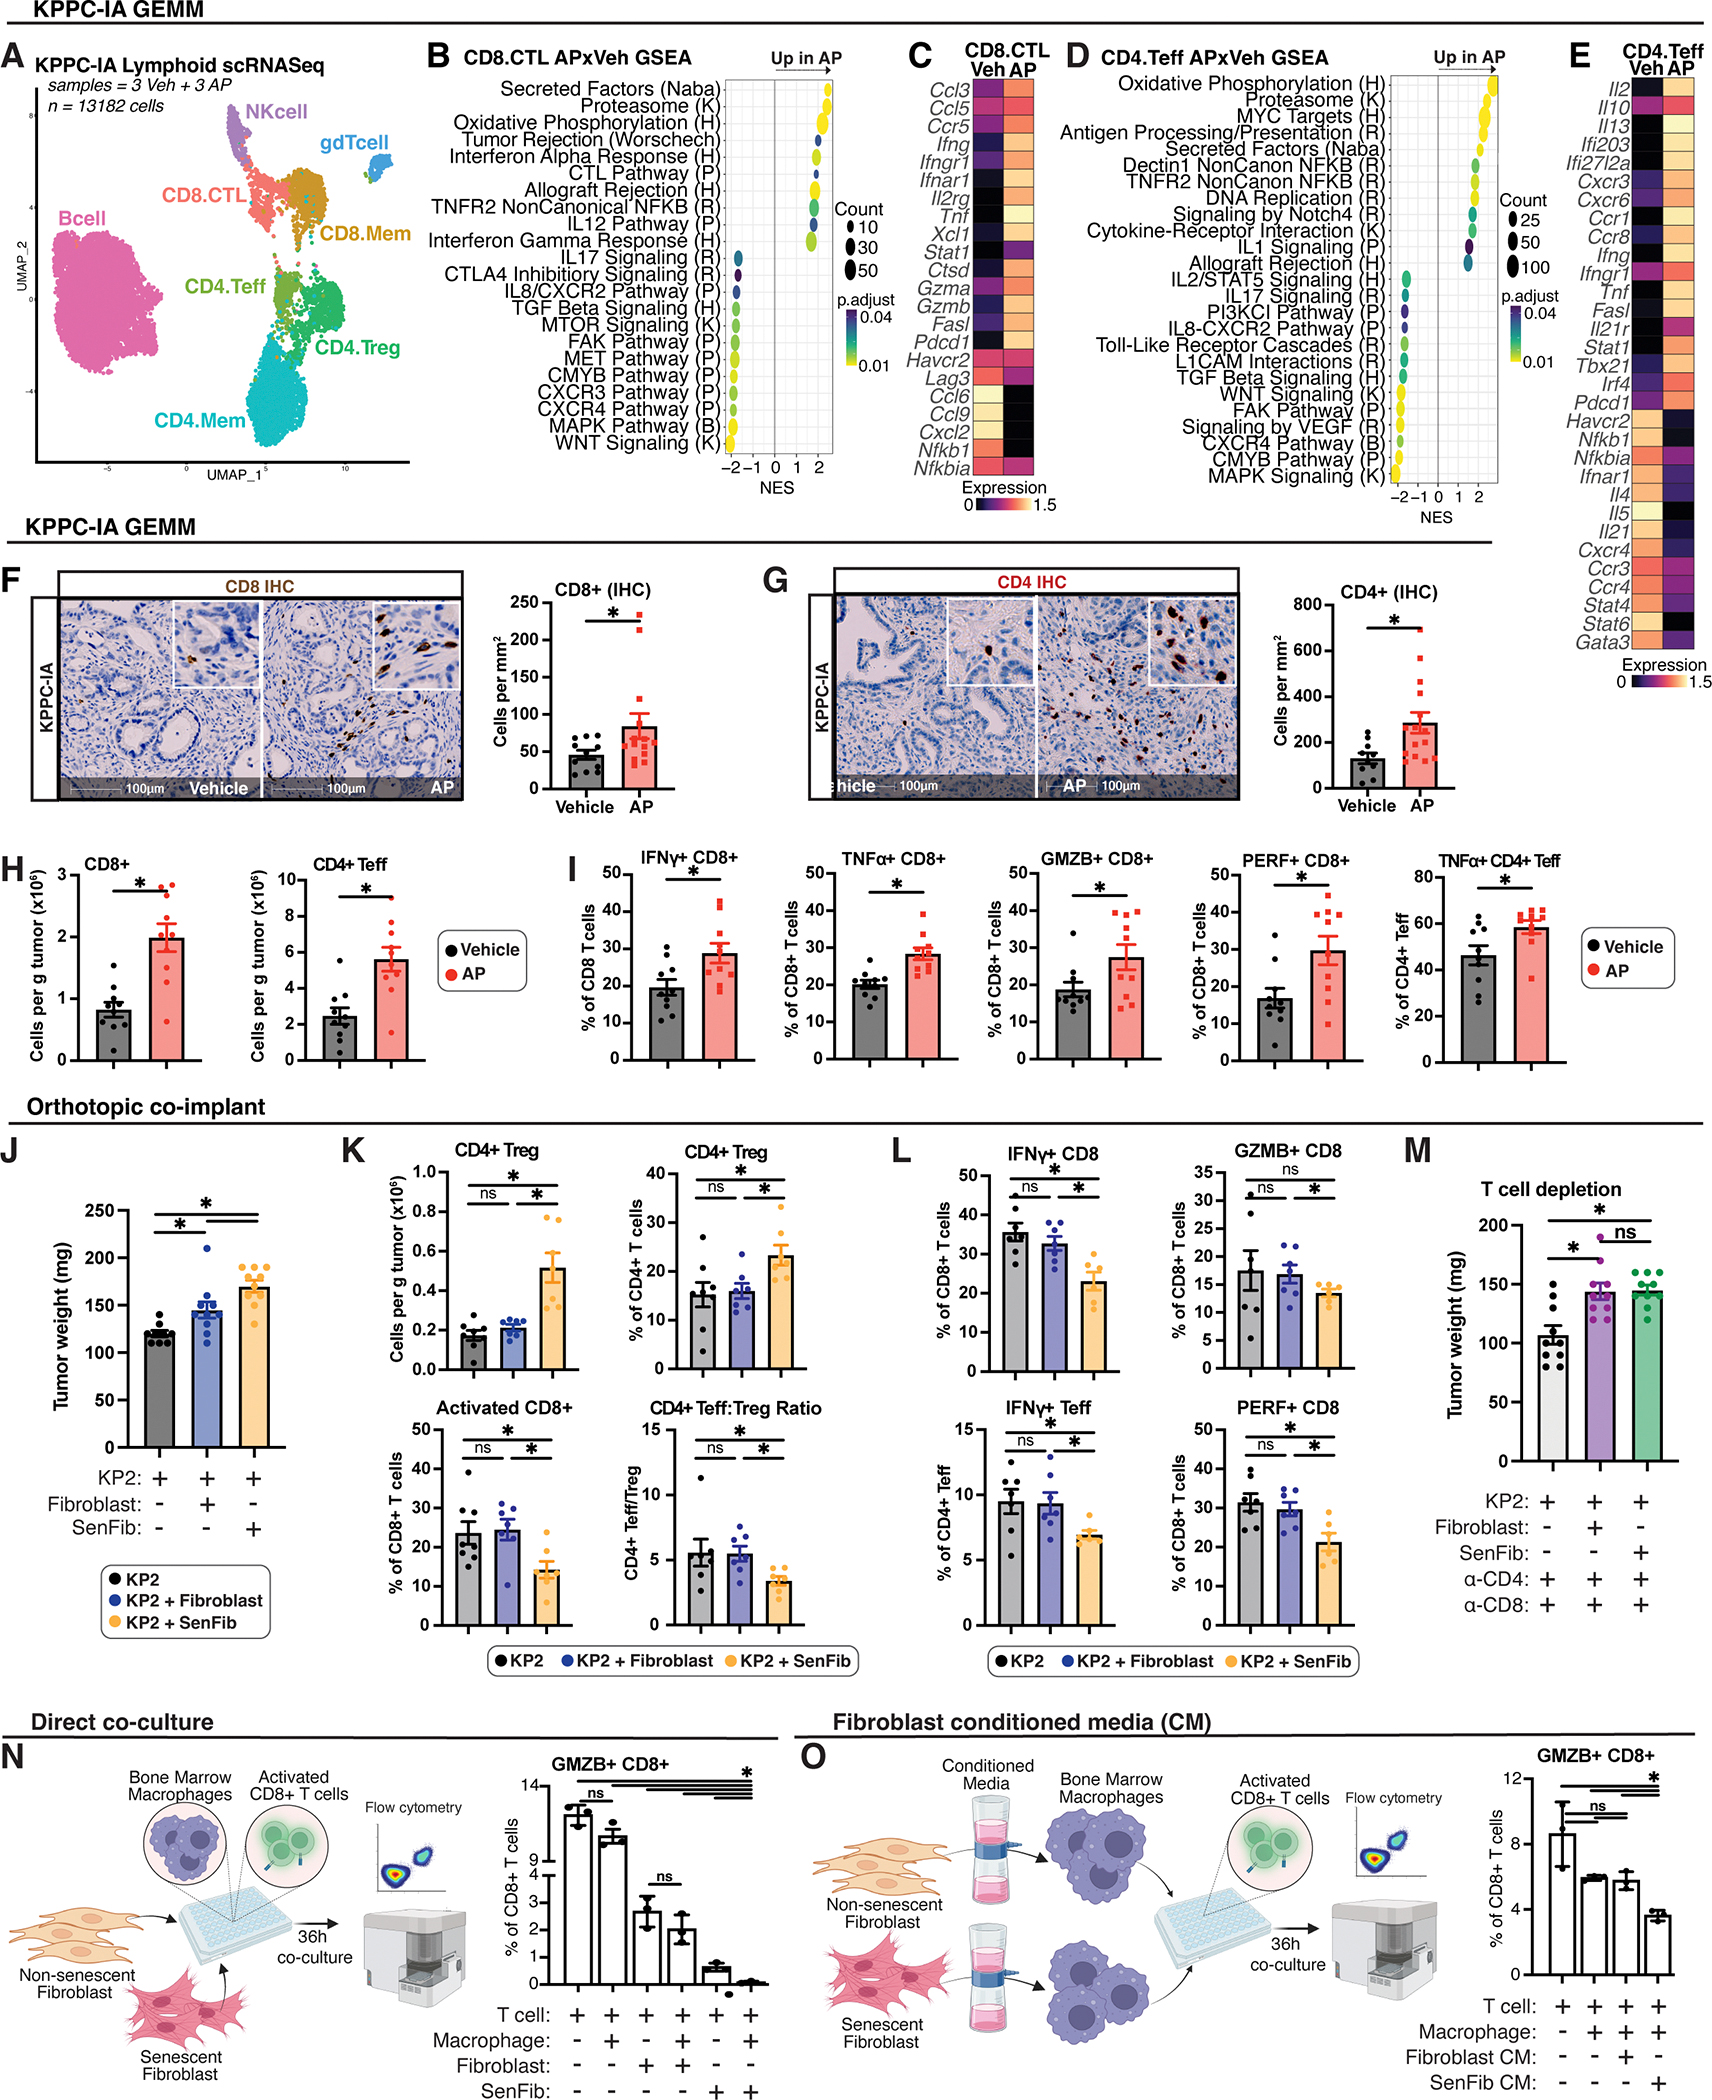
Pancreatic ductal adenocarcinoma (PDAC) therapeutic resistance is largely attributed to a unique tumor microenvironment embedded with an abundance of cancer-associated fibroblasts (CAF). Distinct CAF populations were recently identified, but the phenotypic drivers and specific impact of CAF heterogeneity remain unclear. In this study, we identify a subpopulation of senescent myofibroblastic CAFs (SenCAF) in mouse and human PDAC. These SenCAFs are a phenotypically distinct subset of myofibroblastic CAFs that localize near tumor ducts and accumulate with PDAC progression. To assess the impact of endogenous SenCAFs in PDAC, we used an LSL-KRASG12D;p53flox;p48-CRE;INK-ATTAC (KPPC-IA) mouse model of spontaneous PDAC with inducible senescent cell depletion. Depletion of senescent stromal cells in genetic and pharmacologic PDAC models relieved immune suppression by macrophages, delayed tumor progression, and increased responsiveness to chemotherapy. Collectively, our findings demonstrate that SenCAFs promote PDAC progression and immune cell dysfunction. Significance: CAF heterogeneity in PDAC remains poorly understood. In this study, we identify a novel subpopulation of senescent CAFs that promotes PDAC progression and immunosuppression. Targeting CAF senescence in combination therapies could increase tumor vulnerability to chemo or immunotherapy. See related article by Ye et al., p. 1302.


Conflict of interest statement

Conflict of interest disclosure: The authors declare no potential conflicts of interest.

Figures

Figure 1:
Figure 1:. Senescent stromal cells accumulate with PDAC progression.
(A-B) Representative images and quantification analysis of senescence-associated beta-galactosidase (SA-βgal) enzymatic activity and p16 protein IHC during mouse PDAC progression. Representative regions arranged in rows from top-bottom: mouse normal pancreas, early KPC tumor, end-stage KPC tumor, and end-stage KPPC tumor (n=4 mice/group). Each region is shown at 5X and 10X magnification in columns from left-right, with a 20X inset. (C) Representative images of KPPC multiplex IHC (mIHC) staining panel for senescent cells including hematoxylin/Nuclear counterstain (blue), tumor marker cytokeratin19/CK19 (cyan), pan-CAF marker podoplanin/PDPN (yellow), myCAF marker smooth muscle actin/SMA (red), and senescence marker p16 (green). Each region is shown at 10X and 20X magnifications in rows from top-bottom. (D) Representative images of p16+PDPN+SMA+ CAF mIHC in KPPC tumors. Each region is shown at 10X and 20X magnifications in rows from top-bottom, with a 40X inset. The quantification graph shows p16+PDPN+SMA+/− CAFs and p16+CD45+ leukocytes as a fraction of KPPC stromal p16+ cells (n= 8 mice). (E) mIHC proximity analysis measuring the average distance of tumor cells to SMA CAFs, p16+SMA+ CAFs, and p16SMA CAFs in KPPC tumors (n= 8 mice). (F) Representative mIHC images of p16+PDPN+SMA+/− CAFs in human PDAC tumors from surgical resections. Each region is shown at 10X and 20X magnifications in rows from top-bottom, with a 40X inset. The quantification graph shows p16+PDPN+SMA+/− CAFs and p16+CD45+ leukocytes as a fraction of human PDAC stromal p16+ cells (n= 10 patients). (G) Representative mIHC images from human tumors showing p16+ CAF localization patterns in pancreatic intraepithelial neoplasia (PanIN), and in peri-ductal and distant regions of PDAC (H) mIHC proximity analysis measuring the average distance of tumor cells to SMA CAFs, p16+SMA+ CAFs, and p16SMA+ CAFs in human pancreatic tumors (n=10 patients). Each region is shown at 10X and 20X magnifications in rows from top-bottom, with a 40X inset. (I) Schematic of pancreatic fibroblast generation, polarization, and senescence induction for co-implantation experiments with tumor cell lines and primary non-senescent or senescent pancreatic fibroblasts. (J) Tumor measurement graphs for tumor cells with/without fibroblasts are shown for KP2 (p53fl/+) and PDA69 (p53mut/+) tumor cell lines implanted orthotopically, and KP2 implanted subcutaneously (n= 8–10 mice per group). (K) Tumor measurement graphs for orthotopic implantation of PDA69 tumor cells with/without non-senescent or senescent fibroblasts that were polarized with either TGFb or TCM (n= 8–10 mice per group). All graphs depict group mean +/− SEM. Groups were compared by two-tailed unpaired t-test. ns (not significant), *p<0.05. In all histological analyses, stained sections were imaged with a whole slide scanner, and the full tissue areas were analyzed using HALO imaging software for cell segmentation, stain detection, and unbiased algorithmic quantification. Schematics were created with BioRender.
Figure 2:
Figure 2:. Identification of a transcriptionally distinct senescent CAF subset in mouse PDAC.
(A) UMAP of CAF scRNAseq (CD45EPCAMCD31PDPN+) sorted from KPPC tumors (n=3 mice, 13447 cells) showing 5 clusters (apCAF in red, iCAF in yellow, myCAF1 in green, myCAF2 in blue, myCAF3 in purple). (B) Gene expression dotplot of CAF markers in KPPC CAF scRNAseq with dot size representing percent expression in the cluster and dot color scaled by expression level. (C) Violin plots of CAF marker gene expression in KPPC CAF scRNAseq showing 2 markers for each of apCAF, iCAF, and myCAF subsets. (D) Gene expression heatmap of KPPC CAF scRNAseq showing the top 10 marker genes of each CAF cluster, down-sampled to 100 cells per cluster. (E) Violin plots of cell cycle inhibitor gene expression in KPPC CAF scRNAseq. (F) Gene expression heatmap of KPPC CAF scRNAseq showing the top 25 myCAF3 marker genes, down-sampled to 100 cells per cluster. Genes that have been previously implicated in senescence are marked as SASP genes with a dot. (G) Bar plot of scRNAseq pseudo-bulk GSEA (clusterProfiler) showing normalized enrichment scores (NES) of the “Fridman Senescence” gene set across KPPC myCAF subsets. (H) Heatmaps of single sample GSEA (escape) showing cluster average NES of myCAF3-enriched senescence-related gene sets across myCAF clusters. (I) Violin plot of Plaur(uPAR) gene expression across myCAF clusters. (J) Flow cytometry representative scatter plots of uPAR expression in SMA+ and SMA CAF (CD45EPCAMCD31PDPN+) populations of KPPC tumors (K) Flow cytometry representative histogram and quantification of p16 mean fluorescence intensity (MFI) across KPPC CAF populations and an IgG negative control. (L) Heatmaps of GSEA (escape) showing cluster average NES of myCAF3-enriched ECM-related and signaling pathway gene sets across myCAF clusters. (M) Heatmaps of GSEA (escape) showing cluster average NES of myCAF3 negatively enriched gene sets across myCAF clusters. (N) Representative images and quantification of mIHC analysis combining the hypoxia probe pimonidazole in yellow with cell type markers (PDPN in red, CK19 in cyan, and p16 in green) in KPPC tumors. Each row shows a distinct KPPC tumor at 20X magnification, with a 40X inset. (O) Slingshot and Tradeseq trajectory analysis of KPPC CAF scRNAseq data showing predicted lineage trajectories (lineage1/myCAF3 in green, lineage2/iCAF in blue). Trajectory paths are overlaid together on the cluster-based UMAP, and separately on UMAPs colored by the pseudotime of the respective lineage. (P) Trajectory analysis overlaid UMAP gene expression plot and expression vs. pseudotime scatter plot showing downregulation of a representative KPPC myCAF1-enriched gene in the progression of both lineages. (Q) Trajectory analysis overlaid UMAP gene expression plot and expression vs. pseudotime scatter plot showing upregulation of a representative KPPC myCAF3-enriched genes in the progression of the lineage1/myCAF3 trajectory. All graphs depict group mean +/− SEM. Groups were compared by two-tailed unpaired t-test. ns (not significant), *p<0.05.
Figure 3:
Figure 3:. Identification of senescent CAFs in human PDAC.
(A) Schematic of three human PDAC scRNAseq datasets including 24 tumor and 11 benign/normal from Peking Union Medical College Hospital (PUMCH), 8 tumors from Translational Genomics Research Institute (TGEN), and 16 tumors from Washington University School of Medicine/Human Tumor Atlas Network (WUSM-HTAN). All samples were derived from surgical resections, and libraries were prepared by droplet-based 10X chromium 3’ end scRNAseq kits. All libraries were aligned with the same genome assembly and CellRanger version, then merged and analyzed with Seurat (B) UMAP of CAF scRNAseq from human PDAC tumors (n=60 patients, 100 samples, 36413 cells) showing 5 clusters (apCAF in red, iCAF in yellow, myCAF1 in green, myCAF2 in blue, and myCAF3 in purple). (C) UMAP of human PDAC CAF scRNAseq split into the three integrated datasets. (D) Dotplot of human PDAC CAF scRNAseq showing CAF marker gene expression across CAF subsets with dot size representing percent expression in the cluster and dot color scaled by expression level (E) scRNAseq violin plots of CAF marker genes across human PDAC CAF subsets showing 2 markers for each of apCAF, iCAF, and myCAF subsets. (F) Module score violin plots and UMAP of KPPC CAF scRNAseq showing the expression of the KPPC myCAF3 marker gene signature across human PDAC CAF clusters. (G) UMAP of human pancreatic fibroblast scRNAseq split into normal/benign and tumor samples. Boxplot shows frequencies of CAF subtypes in normal/benign and tumor samples. (H) Gene expression heatmap of human PDAC CAF scRNAseq showing the top 25 myCAF3 marker genes, down-sampled to 100 cells per cluster. Genes that have been previously implicated in senescence are marked as SASP genes with a dot. (I) Heatmap of human PDAC CAF scRNAseq GSEA (escape) showing cluster average NES of senescence-related gene sets across myCAF clusters. (J) Violin plot of human PDAC CAF scRNAseq showing PLAUR(uPAR) expression in myCAF clusters. (K) Heatmap of human PDAC CAF scRNAseq GSEA (escape) showing average NES per cluster for select ECM-related, signaling pathway across myCAF clusters. (L) Heatmap of human PDAC CAF scRNAseq GSEA (escape) showing average NES per cluster for myCAF3 downregulated gene sets across myCAF clusters. (M) Violin plots of human PDAC CAF scRNAseq showing LRRC15, and LRRC15 cell signature expression across myCAF clusters. In all histological analyses, stained sections were imaged with a whole slide scanner, and the full tissue areas were analyzed using HALO imaging software for cell segmentation, stain detection, and unbiased algorithmic quantification.
Figure 4:
Figure 4:. Focal adhesion signaling maintains PDAC CAF senescence.
(A) Heatmap of KPPC CAF scRNAseq single sample GSEA (escape) showing cluster average NES of myCAF3-enriched focal adhesion related gene sets across myCAF clusters. (B-C) Representative images and quantification of KPPC mIHC analysis for phosphorylated FAK (pFAK) in magenta with CK19 in cyan, SMA in red, and p16 in green (n= 10 mice). Each region is shown at 10X and 20X magnifications in rows from top-bottom, with a 40X inset. (D) UMAP of KPPC CAF scRNAseq sorted from untreated and FAKi-treated KPPC tumors (n= 3 mice/group, 13448 cells untreated, 7343 cells FAKi). (E) Stacked bar plot of KPPC CAF scRNAseq showing CAF cluster frequencies in untreated and FAKi-treated tumors. (F) Module score heatmap showing cluster average expression of KPPC cell signature scores across CAF clusters in untreated and FAKi-treated tumors. (G) Gene expression heatmap of KPPC CAF scRNAseq split by treatment showing cluster average expression of select senescence-related and CAF marker genes affected by FAKi treatment. (H) Heatmaps of myCAF2 & myCAF3 scRNAseq GSEA (escape) showing treatment group average NES for senescence-related, ECM-related, signaling pathways, and upregulated gene sets. (I) Representative images of KPPC mIHC and quantification of frequency and density of p16+SMA+ CAFs in untreated and FAKi-treated KPPC tumors. Each region is shown at 10X and 20X magnifications in rows from top-bottom, with a 40X inset. (J-L) RT-FAK clinical trial NCT04331041 evaluating stereotactic body radiotherapy (SBRT) and Defactinib (FAKi) in locally advanced PDAC with pre and pos-treatment fine needle aspirate with sample collection by endoscopic ultrasound (FNA-EUS) biopsy and droplet-based scRNAseq library preparation and analysis. UMAP and frequency bar plots of scRNAseq CAF subpopulations in RT-FAK treated human PDAC, comparing paired samples collected before (Pre-Rx) and after (Post-Rx) treatment (n= 12 patients, 5038 cells). (J) Cells are first clustered by CAF subset showing myCAF, iCAF, and apCAF; (K) then cells are clustered by senescent CAF (SenCAF) status determined by the expression of the KPPC myCAF3 cell signature module score; and (L) finally, myCAFs are further subclustered into myCAF1–3. All graphs depict group mean +/− SEM. Groups were compared by two-tailed unpaired t-test. ns (not significant), *p<0.05. In all histological analyses, stained sections were imaged with a whole slide scanner, and the full tissue areas were analyzed using HALO imaging software for cell segmentation, stain detection, and unbiased algorithmic quantification. Schematics were created with BioRender.
Figure 5:
Figure 5:. Senescent cell depletion delays progression and limits fibrosis in KPPC tumors.
(A) Schematic of transgenes in the KPPC-IA (INK-ATTAC) mouse model, and senescence depletion treatment regimen with intraperitoneal injections of 10mg/kg AP20187 3 times per week for 3 weeks from weaning (mouse age timepoint = day 35). (B) Representative images of KPPC-IA mIHC and density quantification of senescent p16+SMA+ CAFs in tumors from vehicle and AP-treated mice. Regions are shown at 20X magnification with a 40X inset. (C) Representative images of KPPC-IA H&E and quantification of histopathological grade in tumors from vehicle and AP-treated mice. Regions are shown at 5X magnification. (D) Images depicting loss of E-Cadherin typical in high-grade PDAC lesions (left) along with images and quantitation of GATA6+ expression in PDAC cells. (E-F) Representative images and quantification of KPPC-IA Sirius red (collagen) staining and hyaluronic acid binding protein (HABP) IHC in tumors from vehicle and AP-treated mice. Regions are shown at 5X and 10X magnification. (G) Representative images of peri-ductal Sirius red/collagen staining in tumors from vehicle and AP-treated KPPC-IA mice. Violin and box plots show quantification analysis of collagen fiber count, width, length, and periductal matrix density in tumors from vehicle and AP-treated KPPC-IA tumors. (H) Schematic of transgenes in the KPPC mouse model (Top), and senescence depletion treatment regimen using per day oral gavage of 50mg/kg ABT-263/Navitoclax daily for 14 days after tumor diagnosis (experiment timepoint = day 0) (Down). (I) Representative images of KPPC mIHC and density quantification of senescent p16+SMA+ CAFs in tumors from vehicle and ABT263-treated mice. Regions are shown at 20X magnification with a 40X inset. (J) Representative images of KPPC H&E and quantification of histopathological grade in tumors from vehicle and ABT263-treated mice. Regions are shown at 5X magnification. (K-L) Representative images and quantification of KPPC Sirius red (collagen) staining and hyaluronic acid binding protein (HABP) IHC in tumors from vehicle and ABT263-treated mice. Regions are shown at 5X and 10X magnification. (M) UMAP of human PDAC CAF scRNAseq grouped by CAF subtype and split into cells from treatment naive and chemotherapy (FOLFIRINOX or Gemcitabine +Nab Paclitaxel). Cells were down-sampled to equal cell numbers across treatment groups for visual comparison. Graph showing the frequency of myCAF3 amongst CAFs in tumors from naive and chemo-treated patients. (N) Schematic of KPPC-IA (INK-ATTAC) standard senescence depletion treatment regimen along with intraperitoneal injections of 10mg/kg AP20187 3 times per week for 3 weeks from weaning, with or without gemcitabine + paclitaxel started one week later and given every 5 days (3 doses). The graph shows endpoint tumor weights in KPPC-IA mice that received no treatment, AP20187 alone, GEM/PTX alone, or combination therapy. All graphs depict group mean +/− SEM. Groups were compared by two-tailed unpaired t-test. ns (not significant), *p<0.05. In all histological analyses, stained sections were imaged with a whole slide scanner, and the full tissue areas were analyzed using HALO imaging software for cell segmentation, stain detection, and unbiased algorithmic quantification. Schematics were created with BioRender.
Figure 6:
Figure 6:. Senescent fibroblasts promote immunosuppressive TAM phenotypes in PDAC
(A) UMAP of KPPC-IA CD45+ scRNAseq showing myeloid populations in tumors from vehicle and AP-treated mice (n= 2–3 mice/sample, 2–3 samples/group, 14246 cells). (B) Dotplot of KPPC-IA myeloid scRNAseq GSEA (clusterProfiler) showing NES of significantly up/downregulated gene sets in TAMs from AP-treated tumors. Dot size depicts enriched gene count, and dot color depicts multiple testing adjusted p-values. (C) Gene expression heatmaps of KPPC-IA myeloid scRNAseq showing treatment-split cluster averages for immunosuppressive and inflammatory genes that were significantly differentially expressed in TAMs from AP-treated tumors. (D) IHC density quantification of macrophages (F480+) and granulocytes (LY6G+) in tumors from vehicle and AP-treated KPPC-IA mice. (E-F) Representative images and quantification of Arginase-1 (ARG1+) IHC and F480+ARG1+ mIHC analysis in vehicle and AP-treated KPPC-IA tumors. Each region is shown at 5X and 10X magnifications in rows from top-bottom, with a 20X inset. (G) Representative images of mIHC in KPPC tumors combining macrophage (F480 in magenta), tumor cell (CK19 in cyan), and senescent CAF (SMA in red, p16 in green) markers. Each row shows a distinct tumor at 20X magnification with a 40X inset. (H) Flow cytometry quantification of TAM MHCII mean fluorescence intensity (MFI) and frequencies of TIM3+, PDL1+, and VISTA+ TAMs in KPPC-IA tumors. (I) Flow cytometry quantification of TAM MHCI MFI, and frequencies of PDL1+ and VISTA+ TAMs in orthotopic co-implant tumors with KP2 alone or combined with non-senescent or senescent pancreatic fibroblasts. (J) Schematic showing indirect co-culture of fibroblast conditioned media (CM) with bone marrow-derived macrophages, followed by reverse transcription qPCR and flow cytometric measurement of macrophage phenotypic markers. (K) Dotplot of KPPC-IA myeloid scRNAseq GSEA (clusterProfiler) showing NES of significantly up/downregulated gene sets in cDC1 from AP-treated tumors. (L-N) Flow cytometry quantification of cDC frequencies, MHCII MFI, PDL1+ frequencies, and CCR7 MFI in vehicle and AP-treated KPPC-IA tumors. (O) Flow cytometry quantification of cDC MHCI and MHCII MFI in KP2-fibroblast orthotopic co-implant tumors. All graphs depict group mean +/− SEM. Groups were compared by two-tailed unpaired t-test. ns (not significant), *p<0.05. In all histological analyses, stained sections were imaged with a whole slide scanner, and the full tissue areas were analyzed using HALO imaging software for cell segmentation, stain detection, and unbiased algorithmic quantification. Schematics were created with BioRender.
Figure 7:
Figure 7:. Senescent fibroblasts promote T lymphocyte dysfunction.
(A) UMAP of KPPC-IA CD45+ scRNAseq showing lymphoid populations in tumors from vehicle and AP-treated mice (n= 2–3 mice/sample, 2–3 samples/group, 13182 cells). (B) Dotplot of KPPC-IA lymphoid scRNAseq GSEA (clusterProfiler) showing NES of significantly up/downregulated gene sets in CD8 cytotoxic T cells (CD8.CTL). Dot size depicts enriched gene count, and dot color depicts multiple testing adjusted p-values. (C) Gene expression heatmaps of KPPC-IA lymphoid scRNAseq showing treatment-split cluster averages for genes that were significantly differentially expressed in CD8.CTL from AP-treated tumors. (D) Dotplot of KPPC-IA lymphoid scRNAseq GSEA (clusterProfiler) showing NES of significantly up/downregulated gene sets in CD4 effector T cells (CD4.Teff) from AP treated KPPC-IA tumors. Dot size depicts enriched gene count, and dot color depicts multiple testing adjusted p-values. (E) Gene expression heatmaps of KPPC-IA lymphoid scRNAseq showing treatment-split cluster averages for genes that were significantly differentially expressed in CD4.Teff from AP-treated tumors. (F-G) Representative images and density quantification of CD8+ and CD4+ T cell IHC in vehicle and AP-treated KPPC-IA tumors. Region is shown at 10X magnification with a 20X inset. (H) Flow cytometry quantification of CD8+ and CD4+ T cell frequencies in vehicle and AP-treated KPPC-IA tumors. (I) Flow cytometry quantification measuring TNFa+ CD4+ Teff and IFNg+, TNFa+, GZMB+, and PERF+ CD8+ T cells after a 6-hour ex vivo PMA/Ionomycin stimulation of whole tumor digests from vehicle and AP-treated KPPC-IA mice. (J) Tumor weight measurements of KP2-fibroblast co-implant orthoptic tumors (n= 8–10 mice/group). (K) Flow cytometry quantification of CD4+ T cells, and frequencies of activated (CD44+) CD8+ T cells in orthotopic co-implant tumors (n= 6–7 mice/group). (L) Flow cytometry quantification measuring IFNg+ CD4 Teff and IFNg+, GZMB+, and PERF+ CD8+ T cells after a 6hour PMA/Ionomycin stimulation of whole tumor digests from orthotopic co-implant tumors. (M) Tumor weight measurements of KP2-fibroblast co-implant orthoptic tumors with CD4+ & CD8+ T cell antibody-mediated depletion (n= 8–10 mice/group). (N) Schematic of direct co-culture of fibroblasts, bone marrow macrophages, and splenic T cells, followed by flow cytometry quantification of GZMB+ CD8+ T cells (n=3 replicates/condition). (O) Schematic of culture with fibroblast conditioned media (CM), bone marrow macrophages, and splenic T cells followed by flow cytometry quantification of GZMB+ CD8+ T cells (n=3 replicates/condition). All graphs depict group mean +/− SEM. Groups were compared by two-tailed unpaired t-test. ns (not significant), *p<0.05. For scRNAseq gene expression multiple testing adjusted p-values. In all histological analyses, stained sections were imaged with a whole slide scanner, and the full tissue areas were analyzed using HALO imaging software for cell segmentation, stain detection, and unbiased algorithmic quantification. Schematics were created with BioRender.

References

    1. Mizrahi JD, Surana R, Valle JW, Shroff RT. Pancreatic cancer. The Lancet 2020;395(10242):2008–20 doi 10.1016/s0140-6736(20)30974-0. - DOI - PubMed
    1. Hessmann E, Buchholz SM, Demir IE, Singh SK, Gress TM, Ellenrieder V, et al. Microenvironmental Determinants of Pancreatic Cancer. Physiological Reviews 2020;100(4):1707–51 doi 10.1152/physrev.00042.2019. - DOI - PubMed
    1. Hosein AN, Brekken RA, Maitra A. Pancreatic cancer stroma: an update on therapeutic targeting strategies. Nature Reviews Gastroenterology & Hepatology 2020;17(8):487–505 doi 10.1038/s41575-020-0300-1. - DOI - PMC - PubMed
    1. Bachem MG, Schünemann M, Ramadani M, Siech M, Beger H, Buck A, et al. Pancreatic carcinoma cells induce fibrosis by stimulating proliferation and matrix synthesis of stellate cells. Gastroenterology 2005;128(4):907–21 doi 10.1053/j.gastro.2004.12.036. - DOI - PubMed
    1. Erez N, Truitt M, Olson P, Hanahan D. Cancer-Associated Fibroblasts Are Activated in Incipient Neoplasia to Orchestrate Tumor-Promoting Inflammation in an NF-κB-Dependent Manner. Cancer Cell 2010;17(2):135–47 doi 10.1016/j.ccr.2009.12.041. - DOI - PubMed

MeSH terms