. 2024 Apr 29;81(1):199.
doi: 10.1007/s00018-024-05234-y.

Tyrosine kinase 2 modulates splenic B cells through type I IFN and TLR7 signaling

Affiliations

Tyrosine kinase 2 modulates splenic B cells through type I IFN and TLR7 signaling

Irene Bodega-Mayor et al. Cell Mol Life Sci. .

Erratum in

Abstract

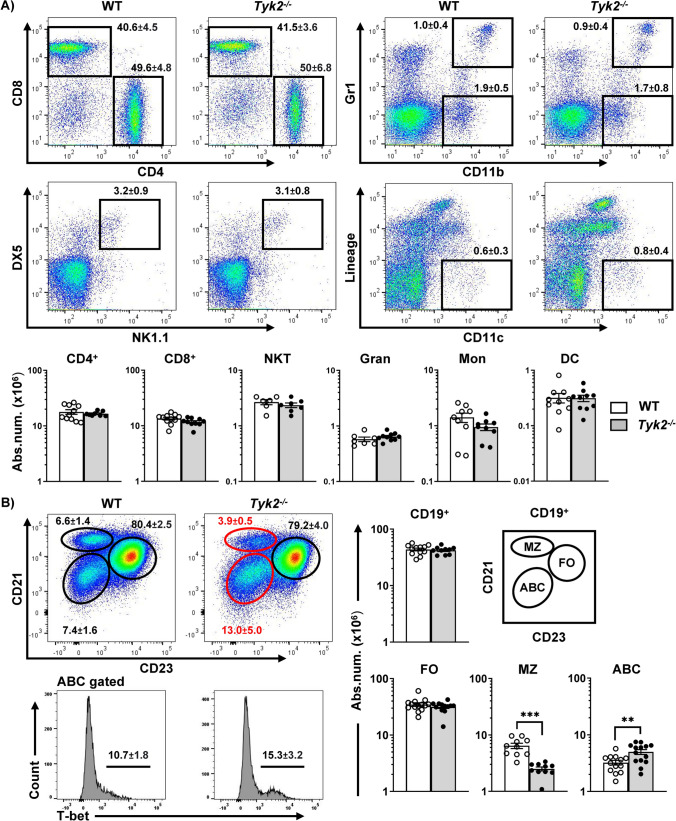
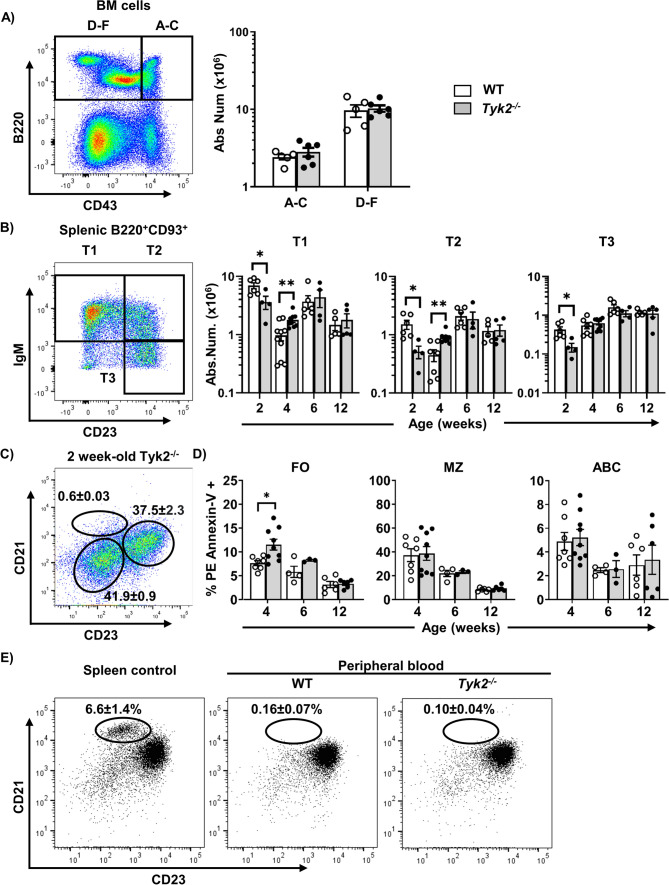
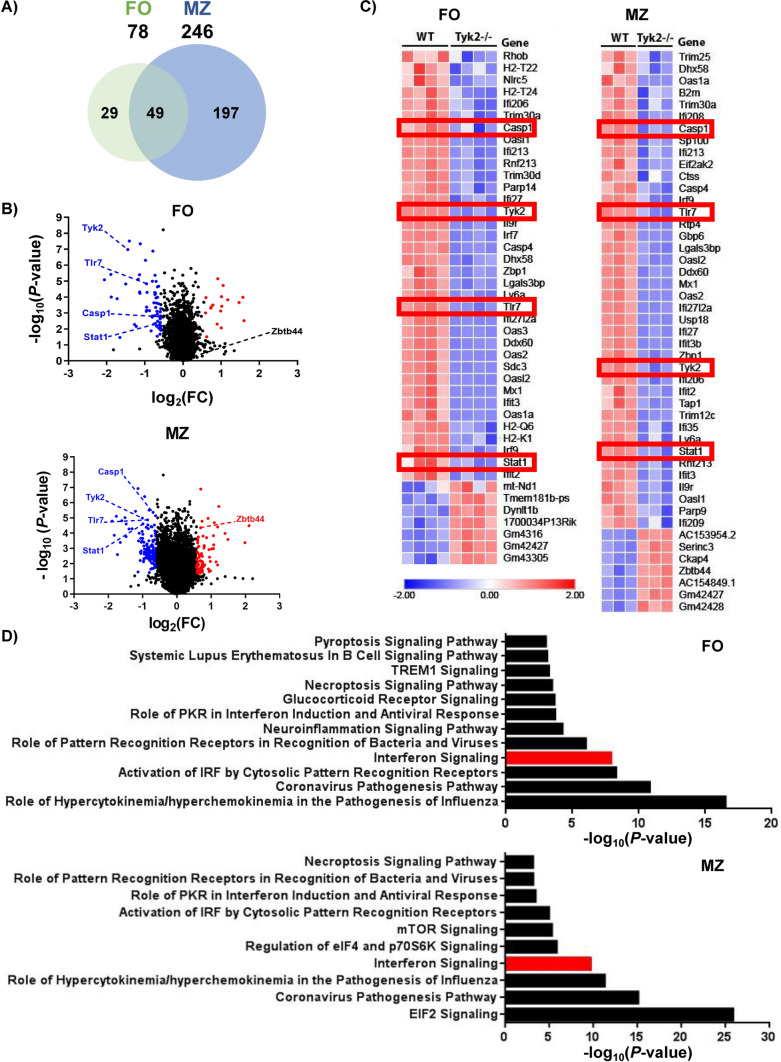
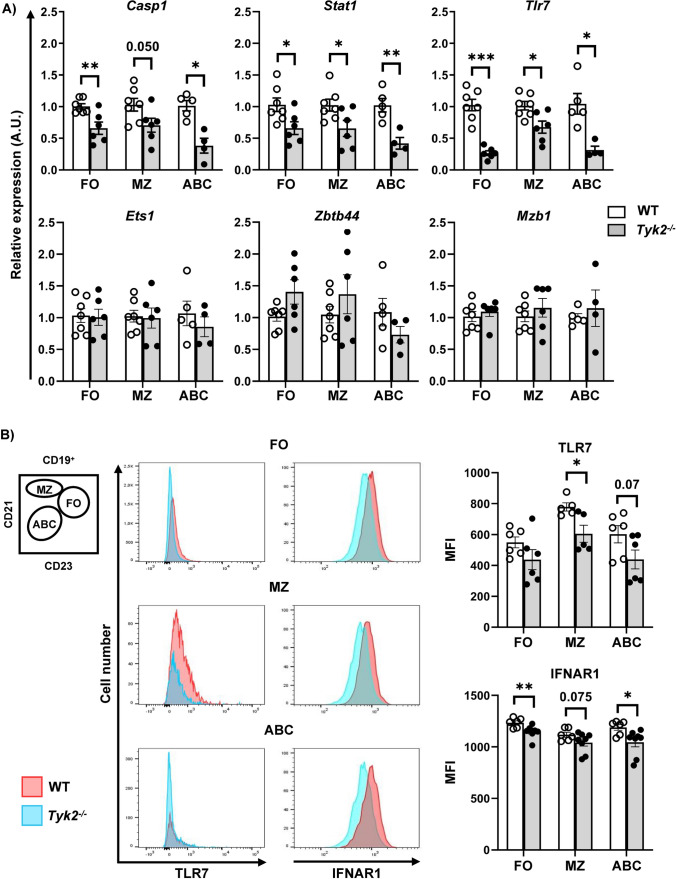
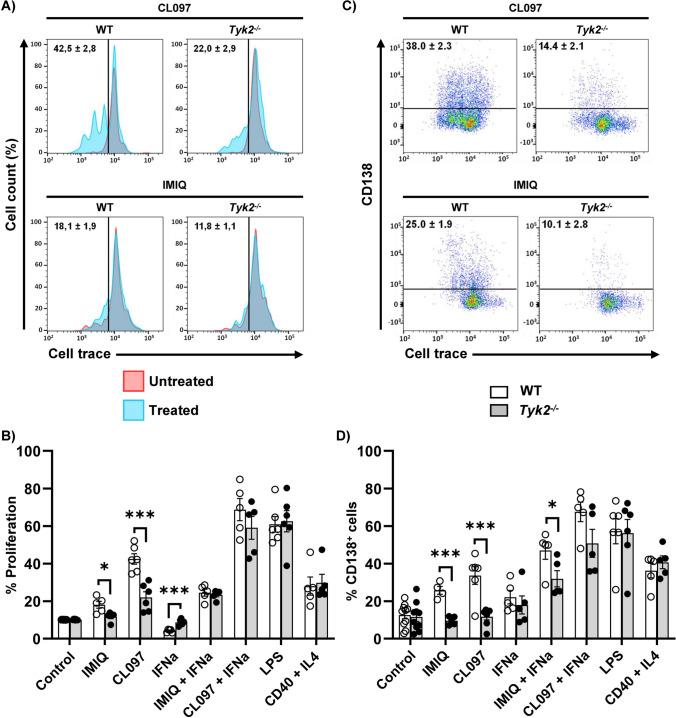
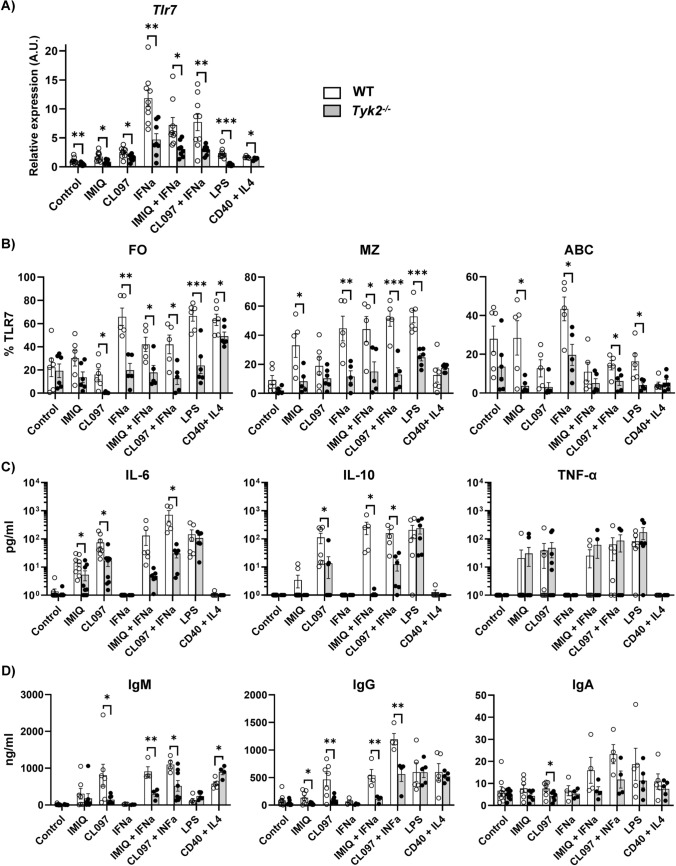
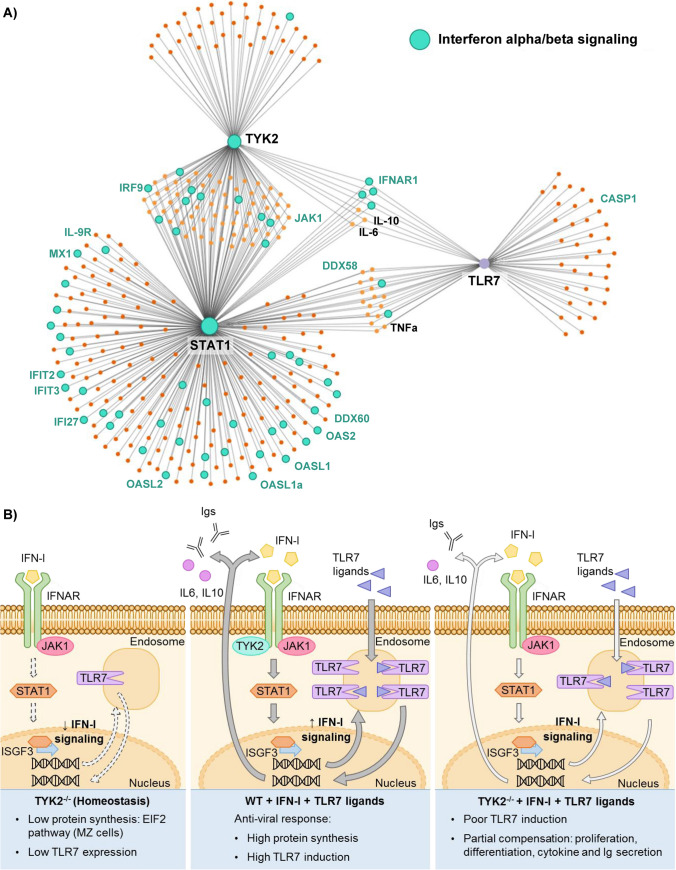
Tyrosine kinase 2 (TYK2) is involved in type I interferon (IFN-I) signaling through IFN receptor 1 (IFNAR1). This signaling pathway is crucial in the early antiviral response and remains incompletely understood on B cells. Therefore, to understand the role of TYK2 in B cells, we studied these cells under homeostatic conditions and following in vitro activation using Tyk2-deficient (Tyk2-/-) mice. Splenic B cell subpopulations were altered in Tyk2-/- compared to wild type (WT) mice. Marginal zone (MZ) cells were decreased and aged B cells (ABC) were increased, whereas follicular (FO) cells remained unchanged. Likewise, there was an imbalance in transitional B cells in juvenile Tyk2-/- mice. RNA sequencing analysis of adult MZ and FO cells isolated from Tyk2-/- and WT mice in homeostasis revealed altered expression of IFN-I and Toll-like receptor 7 (TLR7) signaling pathway genes. Flow cytometry assays corroborated a lower expression of TLR7 in MZ B cells from Tyk2-/- mice. Splenic B cell cultures showed reduced proliferation and differentiation responses after activation with TLR7 ligands in Tyk2-/- compared to WT mice, with a similar response to lipopolysaccharide (LPS) or anti-CD40 + IL-4. IgM, IgG, IL-10 and IL-6 secretion was also decreased in Tyk2-/- B cell cultures. This reduced response of the TLR7 pathway in Tyk2-/- mice was partially restored by IFNα addition. In conclusion, there is a crosstalk between TYK2 and TLR7 mediated by an IFN-I feedback loop, which contributes to the establishment of MZ B cells and to B cell proliferation and differentiation.

Keywords: Aged B cells; Follicular B cells; IFNα; Marginal zone B cells; TYK2-deficient mice; Toll-like receptor 7 (TLR7); Type I IFN; Tyrosine kinase 2 (TYK2); β receptor.


Conflict of interest statement

The authors have no relevant financial or non-financial interests to disclose.

Figures

Fig. 1
Fig. 1
Altered distribution of splenic MZ cells in Tyk2−/− mice under homeostatic conditions. Splenic cell suspensions from WT (white) and Tyk2−/− mice (grey) were prepared, counted and stained for flow cytometry analyses (see Materials and Methods for details). A Representative dot plots of 3-month-old WT and Tyk2−/− mice are shown on the left, with numbers inside the plots displaying the frequencies of each population indicated in the boxes (mean ± SEM; n = 6–11). Absolute numbers of live spleen NKT cells (CD3+DX5+NK-1.1+), granulocytes (Gran, CD11b+Gr-1+), monocytes (Mon, CD11b+Gr-1), dendritic cells (Lineage: Gr-1CD19DX5CD90.2, CD11c+) and T cells (CD3+CD4+ and CD3+CD8+) determined by flow cytometry are shown. B Splenic B cells were electronically gated using CD19, and MZ, FO and ABC cell compartments were identified as CD21++CD23lo (MZ, ellipse), CD21+CD23++ (FO, circle) and CD21loCD23loT-bet+ (ABC, ellipse). Representative dot plots of 3-month-old WT and Tyk2−/− mice are shown. The numbers inside the plots are the frequencies of each population (mean ± SEM; n = 10–14) among CD19+ cells. The graphs show the absolute number of spleen of B cells (CD19+), MZ, FO and ABC cells. Scales are logarithmic. Data in the graphs in A and B are shown as scatter dot plots representing individual values, and the bars are mean ± SEM depicted for each group (n = 10–14 for B cells, n = 8–11 for CD4 and CD8 cells, n = 6–7 for NKT cells and n = 7-10 for myeloid cells). These numbers were calculated from the frequencies obtained from flow cytometry of each population. Group comparisons were made using a two-tailed Student t-test: **P < 0.01, ***P < 0.001
Fig. 2
Fig. 2
Immature B cell progenitors and transitional B cells in Tyk2−/− mice under homeostatic conditions. A Bone marrow cells from adult WT and Tyk2−/− mice were processed for flow cytometry studies using anti-CD43 and anti-B220 to identify B cell progenitors [46] (see Table S2). Left, representative dot plot of the staining obtained in WT mice; Right, quantitation of CD43+ (fractions A-C) and CD43 (fractions D-F) cells in WT and Tyk2−/− mice (n = 5–6). B Splenic cells were stained with anti-B220, anti-CD93, anti-IgM and anti-CD23 in order to trace transitional B cells (T1-T3) as described [47]. Left, representative dot plot of IgM and CD23 staining on electronically gated B220+CD93+ cells, in splenic WT mice. Right, quantification of absolute number of spleen transitional (T1-T3) B cells on infant and young mice (n = 4–10). C Absence of MZ cells in 2 week-old Tyk2−/− mice (n = 4). D Apoptotic cells were determined by flow cytometry using PE Annexin-V on splenic B cell suspensions stained as in Fig. 1B to identify MZ, FO and ABC cells. Data are presented as the percentage of PE Annexin-V + cells in each population (n = 3–9). E Identification of MZ cells in peripheral blood suspensions after staining with anti-CD19, anti-CD21 and anti-CD23 as in Fig. 1B. Representative dot-plots of adult WT spleen, and adult WT and Tyk2−/− peripheral blood cells (PBMC) are shown; numbers inside the plots are the mean ± SEM (n = 3–8). Data in the bar graphs in A, B and C are presented as individual values in the scatter plots, with the bars showing the mean ± SEM. These numbers were calculated from the frequencies of each population. Group comparisons were performed with a two-tailed Student t-test: *P < 0.05, **P < 0.01
Fig. 3
Fig. 3
RNA-Seq analysis of gene expression in FO and MZ B cells in homeostasis. FACS-purified FO and MZ cells from WT and Tyk2−/− mice were used to prepare total RNA (MZ cells) or mRNA (FO cells) as indicated in the Material and Methods section. A Venn diagram showing the number of differentially expressed genes (DEGs) between WT and Tyk2−/− mice in each cell subpopulation and those shared by both populations. A gene signature of 49 genes characteristic of Tyk2 deficiency is observed in both FO and MZ cells. B Distribution of DEGs according to FO or MZ cell population plotted as a function of their variation and significance (P-value < 0.05). Labeled in red and blue are representative up- and down-regulated genes, respectively. C Heatmap of DEGs of the IFN-I signaling pathway in FO and MZ cells. Higher expression levels are indicated in red and lower expression levels in blue. The red boxes highlight genes of interest whose expression was validated. D Histograms depicting the main canonical pathways obtained with the Ingenuity Pathway Analysis (IPA) in FO and MZ cells. IFN-I signaling pathway was identified as significantly deregulated (labeled in red). P-value < 0.05 for FO and a false discovery rate (FDR) < 0.05 for MZ B cells
Fig. 4
Fig. 4
Validation of DEGs data by qPCR and flow cytometry. A RNA preparations extracted from FACS-purified splenic cell samples of FO, MZ and ABC cells were analyzed by qPCR as detailed in the Material and Methods section. The bar plots show the relative expression of Casp1, Stat1, Tlr7, Ets1, Zbtb44, and Mzb1 in the splenic B cell subpopulations. For each sample, relative mRNA levels were determined by RT-qPCR using the 2-ΔΔCt method normalized to Gapdh. Data represent individual values (empty dots, WT samples; black dots, Tyk2−/− samples) and mean ± SEM (n = 4–7; white bars WT mice and gray bars Tyk2−/− mice). B Left, schematic representation of a dot plot of splenic B cells to identify B cell subpopulations, as shown in Fig. 1. Middle, overlaid histograms corresponding to intracellular TLR7 expression (left) and surface IFNAR expression (right) in FO, MZ and ABC subpopulations of WT (red) and Tyk2−/− (blue) splenic samples. Right, the bar graphs show the median fluorescence intensity (MFI) of TLR7+ or IFNAR+ cells, in WT (white) and Tyk2−/− (grey) B cells. Data are presented as individual values (dots). Bars show the mean ± SEM (n = 5–8). Group comparisons were performed with a two-tailed Student t-test: *P < 0.05, **P < 0.01, ***P < 0.001
Fig. 5
Fig. 5
Proliferation and differentiation of splenic B cell cultures. B cells were obtained after depletion of T and plastic-adherent myeloid cells as described in Materials and Methods. The cells were loaded with Cell Trace (CellTracker™) following the manufacturer’s instructions and cultured with CL097 or Imiquimod/R837 (IMIQ, 2 μg/ml) in the absence or presence of IFNα (20 ng/ml), or with LPS (25 μg/ml) or anti-CD40 (10 μg/ml) and IL-4 (150 ng/ml) during 72 h. Cells were then recovered and dye dilution was determined by cytometry after staining with anti-CD138 to assess differentiation. A Representative overlaid histograms for CL097 and IMIQ treated cultures (histograms in blue) over untreated cultures (red histogram), displaying the cell trace signal. Proliferation was determined as the percentage of cells with dye diluted by cell division (mean ± SEM; n = 5–6). B Quantitation of cell proliferation induced by treatment of cultures with different stimuli for 72 h. C Representative dot-plots showing CD138 and cell trace staining on treated cells (untreated cells are not shown). Numbers inside are the percentage of CD138+ cells referred to the isotype control (black lines) (mean ± SEM; n = 5–6). D Quantitation of CD138+ cells after 72 h of culture with different stimuli. Data in B and D are presented as individual values (dots), and the bars show the mean ± SEM (n = 4–10). Statistical analysis was performed by Student's t-test: * P < 0.05; ** P < 0.01; *** P < 0.001
Fig. 6
Fig. 6
TLR7 expression, cytokine and humoral response in splenic B cell cultures. After 6 h, 72 h or 96 h in culture, cells were recovered and used for qPCR or were stained with anti-TLR7, anti-CD21 and anti-CD23, and the supernatants were used to quantify their cytokine or Ig content. A qPCR of Tlr7 at 6 h. RNA was extracted from samples from B cell cultures and subjected to TLR7-specific qPCR. B Cells obtained after 72 h in culture were stained as in Fig. 4B to determine the TLR7 intracellular content in the FO, MZ and ABC subpopulations developed in the cultures. Data are shown as relative numbers (%) of TLR7+ cells (referred to the corresponding isotype control). C Supernatants obtained from B cell cultures at 72 h were subjected to cytometric bead arrays (CBA) to determine their IL-6, IL-10 and TNF-α content. D Antibody secretion was measured by ELISA from cultures at 96 h. Results are presented as individual values (dots), the bars show the mean ± SEM (n = 4–6). Comparisons were performed by Student's t-test: * P < 0.05; ** P < 0.01; *** P < 0.001
Fig. 7
Fig. 7
A Gene network crosstalk between selected DEGs (TYK2, STAT1 and TLR7) created with NetworkAnalyst software [44]. Predicted protein–protein interactions involved in the canonical IFNα/β pathway are colored in turquoise. Named proteins are those found disrupted as consequence of TYK2 deficiency; in turquoise appear those shared both by MZ and by FO B cells analyzed by RNA-seq (17 out of a total of 49) or by qPCR (JAK1); in black are those analyzed by cytometry (IFNAR1) or ELISA (IL6, IL10, TNF-α). B Proposed model of the orchestration of IFN-I and TLR7 signaling by TYK2 in splenic B cells. Left panel: Tyk2−/− cells in homeostasis showed down-regulation of IFN-I signaling pathway and low TLR7 expression. Middle panel: in WT cells, in the presence of IFN-I and TLR7L forward IFN-I signaling through IFNAR induces TLR7 expression which in turn, upon binding to its ligands induces IFN-I, Igs and cytokine secretion. Right panel: upon activation with IFN-I plus TLR7L, Tyk2−/− cells poorly induce TLR7, are unable to proliferate and differentiate like WT cells and secrete lower amounts of cytokines and antibodies. TLR7 is a target of the IFN-I pathway in splenic B cells

References

    1. Smith FL, Baumgarth N (2019) B-1 cell responses to infections. Curr Opin Immunol 57:23–31. 10.1016/j.coi.2018.12.001 - PMC - PubMed
    1. LeBien TW, Tedder TF (2008) B lymphocytes: how they develop and function. Blood 112:1570–1580. 10.1182/blood-2008-02-078071 - PMC - PubMed
    1. Nickerson KM, Smita S, Hoehn KB et al (2023) Age-associated B cells are heterogeneous and dynamic drivers of autoimmunity in mice. J Exp Med 220:e20221346. 10.1084/jem.20221346 - PMC - PubMed
    1. Victora GD, Nussenzweig MC (2012) Germinal Centers. Annu Rev Immunol 30:429–457. 10.1146/annurev-immunol-020711-075032 - PubMed
    1. Martin F, Oliver AM, Kearney JF (2001) Marginal zone and B1 B cells unite in the early response against T-independent blood-borne particulate antigens. Immunity 14:617–629. 10.1016/s1074-7613(01)00129-7 - PubMed

LinkOut - more resources