. 2024 Apr 1;7(4):e248976.
doi: 10.1001/jamanetworkopen.2024.8976.

Sociodemographic Factors and Trends in Bronchiolitis-Related Emergency Department Visit and Hospitalization Rates

Affiliations

Sociodemographic Factors and Trends in Bronchiolitis-Related Emergency Department Visit and Hospitalization Rates

Sanjay Mahant et al. JAMA Netw Open. .

Abstract

Importance: Bronchiolitis is the most common and most cumulatively expensive condition in pediatric hospital care. Few population-based studies have examined health inequalities in bronchiolitis outcomes over time.

Objective: To examine trends in bronchiolitis-related emergency department (ED) visit and hospitalization rates by sociodemographic factors in a universally funded health care system.

Design, setting, and participants: This repeated cross-sectional cohort study was performed from April 1, 2004, to March 31, 2022, using population-based health administrative data from children younger than 2 years in Ontario, Canada.

Main outcome and measures: Bronchiolitis ED visit and hospitalization rates per 1000 person-years reported for the equity stratifiers of sex, residence location (rural vs urban), and material resources quintile. Trends in annual rates by equity stratifiers were analyzed using joinpoint regression and estimating the average annual percentage change (AAPC) with 95% CI and the absolute difference in AAPC with 95% CI from April 1, 2004, to March 31, 2020.

Results: Of 2 921 573 children included in the study, 1 422 088 (48.7%) were female and 2 619 139 (89.6%) lived in an urban location. Emergency department visit and hospitalization rates were highest for boys, those with rural residence, and those with least material resources. There were no significant between-group absolute differences in the AAPC in ED visits per 1000 person-years by sex (female vs male; 0.22; 95% CI, -0.92 to 1.35; P = .71), residence (rural vs urban; -0.31; 95% CI -1.70 to 1.09; P = .67), or material resources (quintile 5 vs 1; -1.17; 95% CI, -2.57 to 0.22; P = .10). Similarly, there were no significant between-group absolute differences in the AAPC in hospitalizations per 1000 person-years by sex (female vs male; 0.53; 95% CI, -1.11 to 2.17; P = .53), residence (rural vs urban; -0.62; 95% CI, -2.63 to 1.40; P = .55), or material resources (quintile 5 vs 1; -0.93; 95% CI -3.80 to 1.93; P = .52).

Conclusions and relevance: In this population-based cohort study of children in a universally funded health care system, inequalities in bronchiolitis ED visit and hospitalization rates did not improve over time.


Conflict of interest statement

Conflict of Interest Disclosures: Dr Parkin reported receiving grants from The Hospital for Sick Children Foundation and Canadian Institutes of Health Research and nonfinancial support from Mead Johnson outside the submitted work. Dr Tuna reported receiving grants from The Ottawa Hospital Research Institute during the conduct of the study. Dr Gill reported receiving grants from Physicians’ Services Incorporated Foundation, Canadian Institutes of Health Research, grants from The Hospital for Sick Children, serving as a member of the Canadian Institutes of Health Research’s Institute of Human Development Child and Youth Health advisory board, and serving on the EBMLive Steering Committee outside the submitted work. No other disclosures were reported.

Figures

Figure 1.
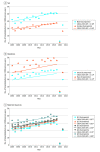
Figure 1.. Trends in Bronchiolitis Emergency Department Visit Rates Among Equity Stratifiers, 2004-2005 to 2021-2022
Emergency department visit rates are per 1000 person-years in children younger than 2 years are shown. Symbols are the crude annual (April 1 to March 31) rates from April 1, 2004, to March 31, 2022, among groups. Trends were quantified using the Joinpoint regression program, version 5.0.5 (National Cancer Institute). Annual percent change (APC) was estimated for years 2004-2005 to 2019-2020. There was no evidence of a significant joinpoint for sex, residence location, or material resources quintile (Q), indicating that the observed increases in emergency department visit rates were linear. aThe average APC was significantly different from zero at P < .001. bThe average APC was significantly different from zero at P < .01.
Figure 2.
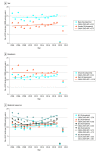
Figure 2.. Trends in Bronchiolitis Hospitalization Visit Rates Among Equity Stratifiers, 2004-2005 to 2021-2022
Hospitalization rates are per 1000 person-years in children younger than 2 years are shown. Symbols are the crude annual (April 1 to March 31) rates from April 1, 2004, to March 31, 2022, among groups. Trends were quantified using the Joinpoint regression program, version 5.0.5 (National Cancer Institute). Annual percent change (APC) was estimated for years 2004-2005 to 2019-2020. There was no evidence of a significant joinpoint for sex and residence location. For material resources, in quintile (Q) 4, there was an initial decrease in hospitalization rate from 2004 to 2008 (trend 1: APC, −5.72; 95% CI, −14.10 to 3.49; P = .19) followed by an increase from 2008 to 2019 (trend 2: APC, 1.72; 95% CI, −0.28 to 3.76; P = .09). In Q5, there was an initial decrease in hospitalization rate from 2004 to 2012 (trend 1: APC, −3.05; 95% CI, −6.51 to 0.53; P = .09) followed by an increase from 2012 to 2019 (trend 2: APC, 3.81; 95% CI, −0.70 to 8.53; P = .09). However, these trends for Q4 and Q5 were not statistically significant. The average annual percent change (AAPC) for each of the Q1 to Q5 subgroups was not significantly different from zero at the α = .05 level. The AAPC difference between Q2 to Q5 and referent Q1 were not significantly different from zero at the α = .05 level.

Similar articles

Cited by

References

    1. Fiscella K, Franks P, Gold MR, Clancy CM. Inequality in quality: addressing socioeconomic, racial, and ethnic disparities in health care. JAMA. 2000;283(19):2579-2584. doi:10.1001/jama.283.19.2579 - DOI - PubMed
    1. Public Health Agency of Canada (PHAC) . Reducing Health Inequalities: A Challenge For Our Times. Accessed November 22, 2023. https://publications.gc.ca/collections/collection_2012/aspc-phac/HP35-22...
    1. Hosseinpoor AR, Bergen N, Kirkby K, Schlotheuber A. Strengthening and expanding health inequality monitoring for the advancement of health equity: a review of WHO resources and contributions. Int J Equity Health. 2023;22(1):49. doi:10.1186/s12939-022-01811-4 - DOI - PMC - PubMed
    1. World Health Organization . Health Impact Assessment, Glossary of Terms. Accessed November 18, 2023. https://www.who.int/docs/default-source/documents/publications/glossary-...
    1. Whitehead M. The concepts and principles of equity and health. Int J Health Serv. 1992;22(3):429-445. doi:10.2190/986L-LHQ6-2VTE-YRRN - DOI - PubMed

Publication types

MeSH terms