. 2024 Apr;132(4):47014.
doi: 10.1289/EHP13556. Epub 2024 Apr 29.

Characterizing Important Dietary Exposure Sources of Perfluoroalkyl Acids in Inuit Youth and Adults in Nunavik Using a Feature Selection Tool

Affiliations

Characterizing Important Dietary Exposure Sources of Perfluoroalkyl Acids in Inuit Youth and Adults in Nunavik Using a Feature Selection Tool

Amira Aker et al. Environ Health Perspect. 2024 Apr.

Abstract

Background: Previous studies have identified the consumption of country foods (hunted/harvested foods from the land) as the primary exposure source of perfluoroalkyl acids (PFAA) in Arctic communities. However, identifying the specific foods associated with PFAA exposures is complicated due to correlation between country foods that are commonly consumed together.

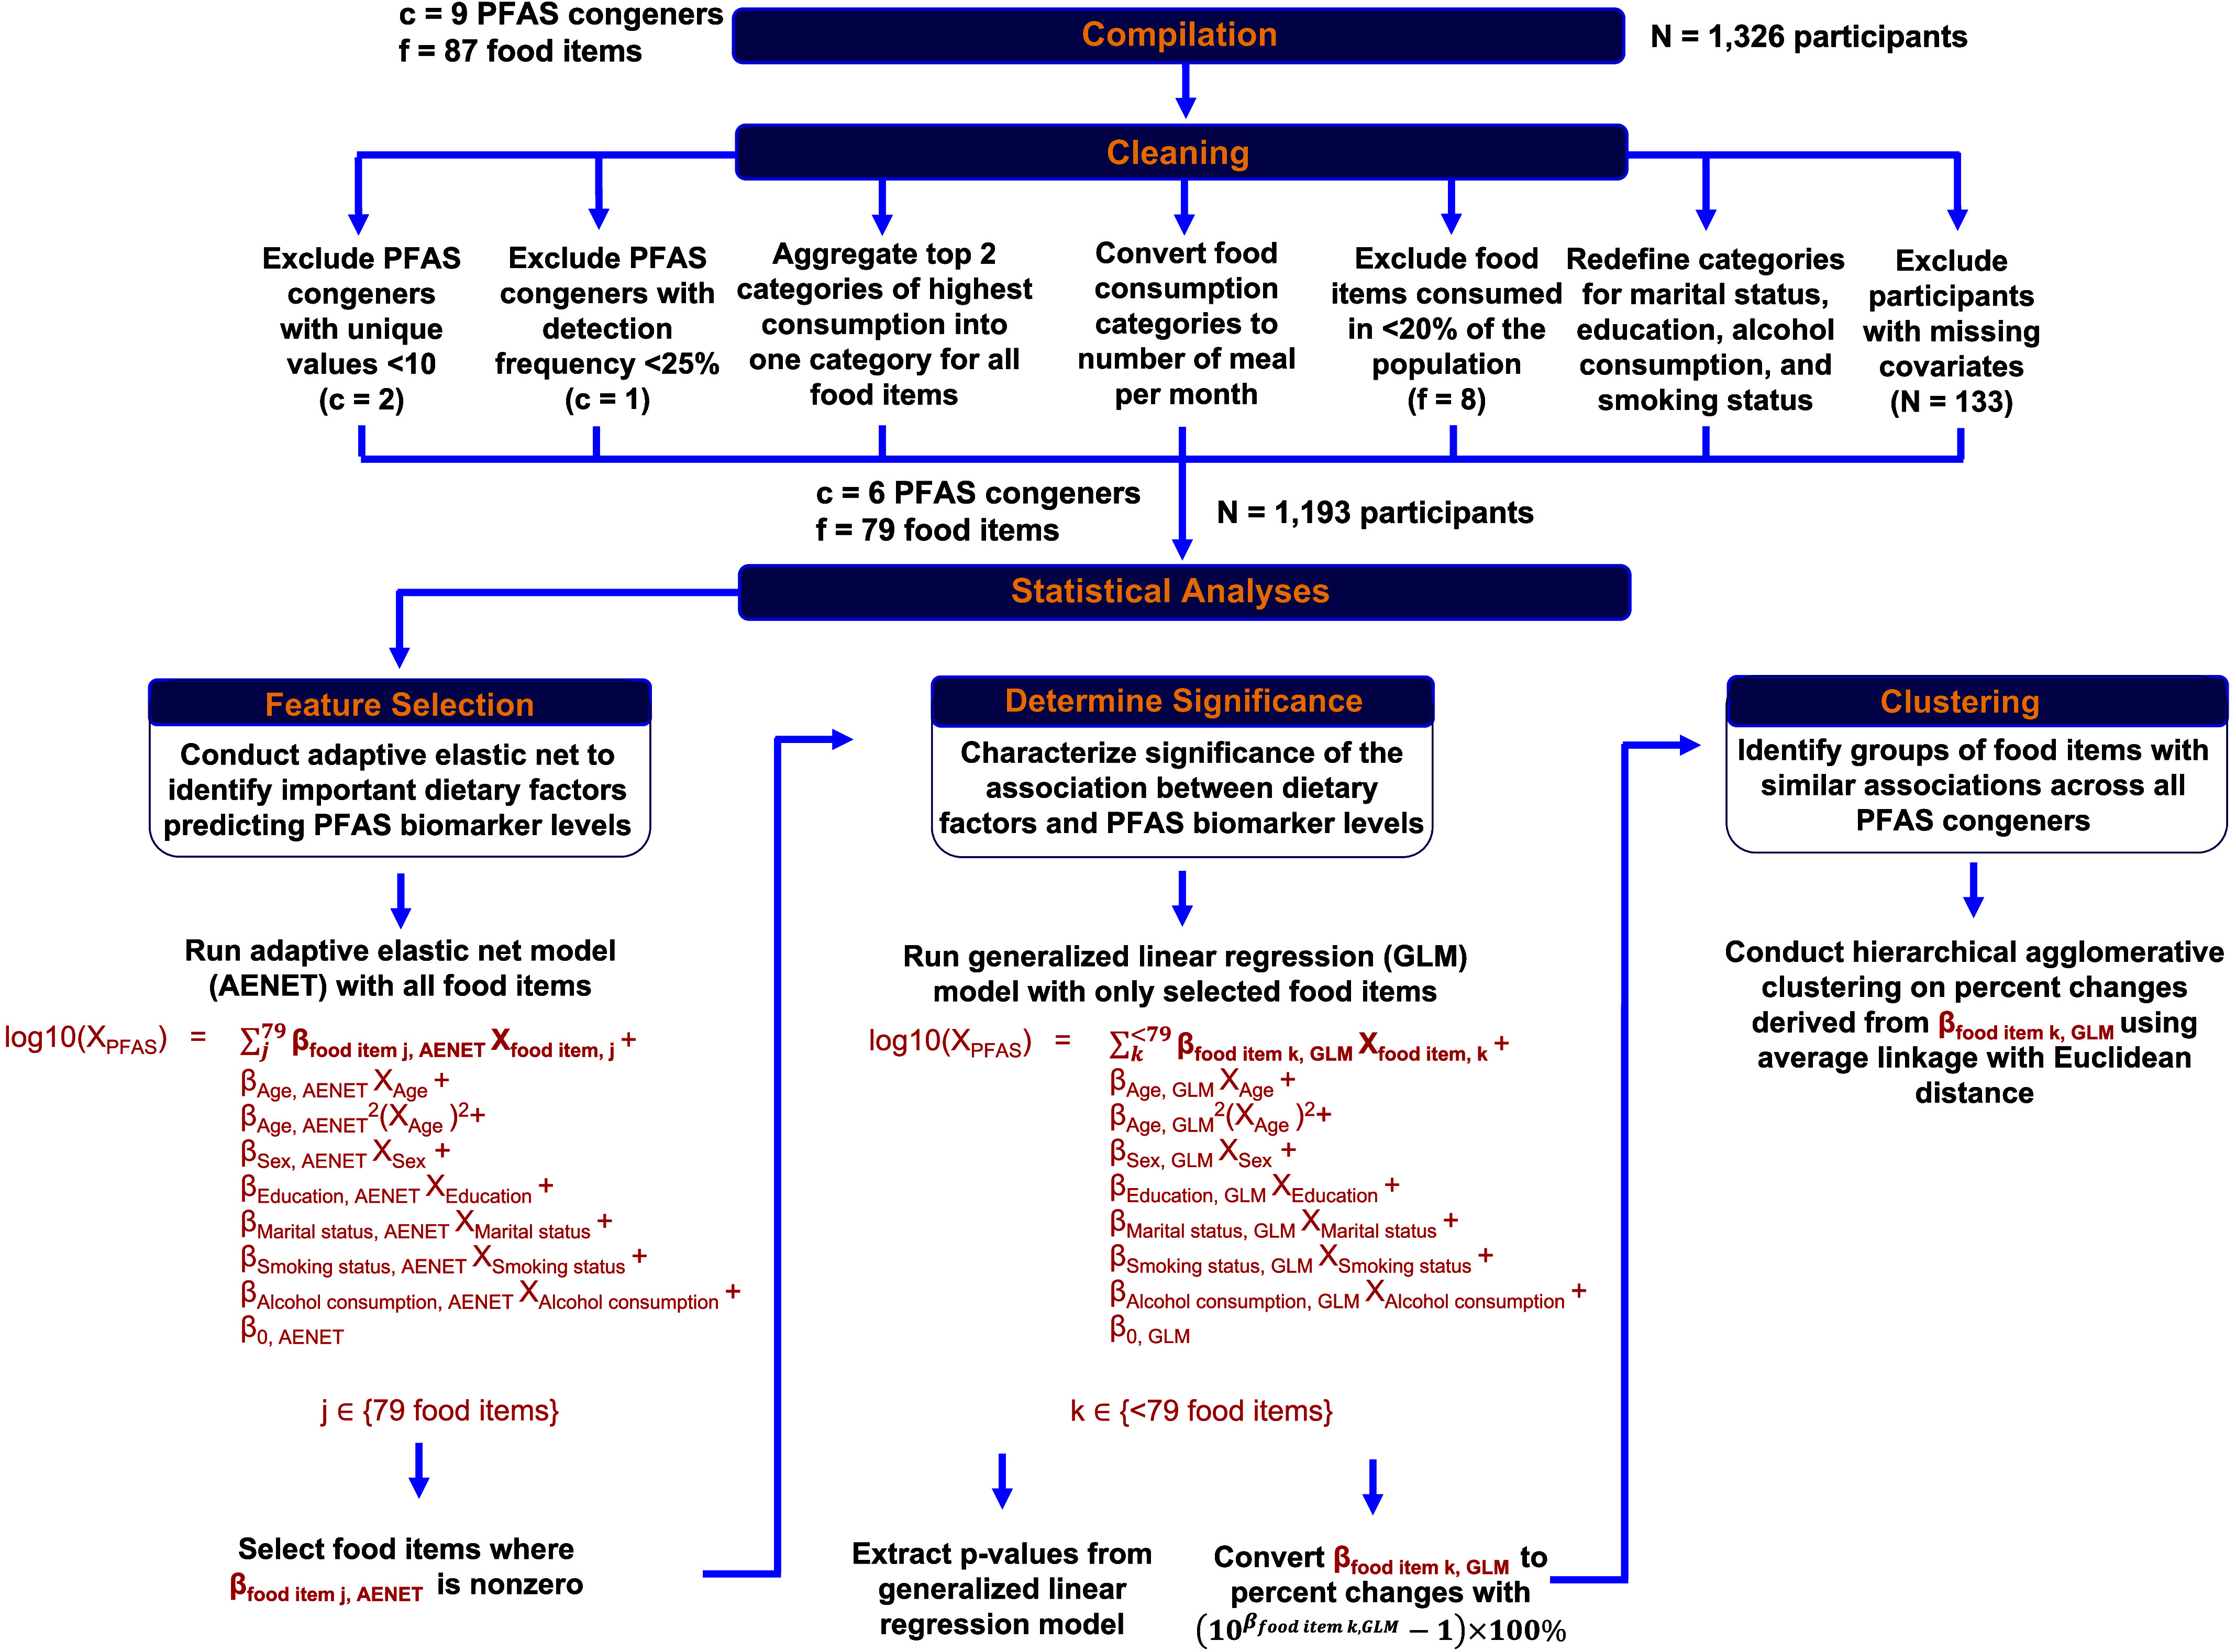
Methods: We used venous blood sample data and food frequency questionnaire data from the Qanuilirpitaa? ("How are we now?") 2017 (Q2017) survey of Inuit individuals 16 y of age residing in Nunavik (n=1,193). Adaptive elastic net, a machine learning technique, identified the most important food items for predicting PFAA biomarker levels while accounting for the correlation among the food items. We used generalized linear regression models to quantify the association between the most predictive food items and six plasma PFAA biomarker levels. The estimates were converted to percent changes in a specific PFAA biomarker level per standard deviation increase in the consumption of a food item. Models were also stratified by food type (market or country foods).

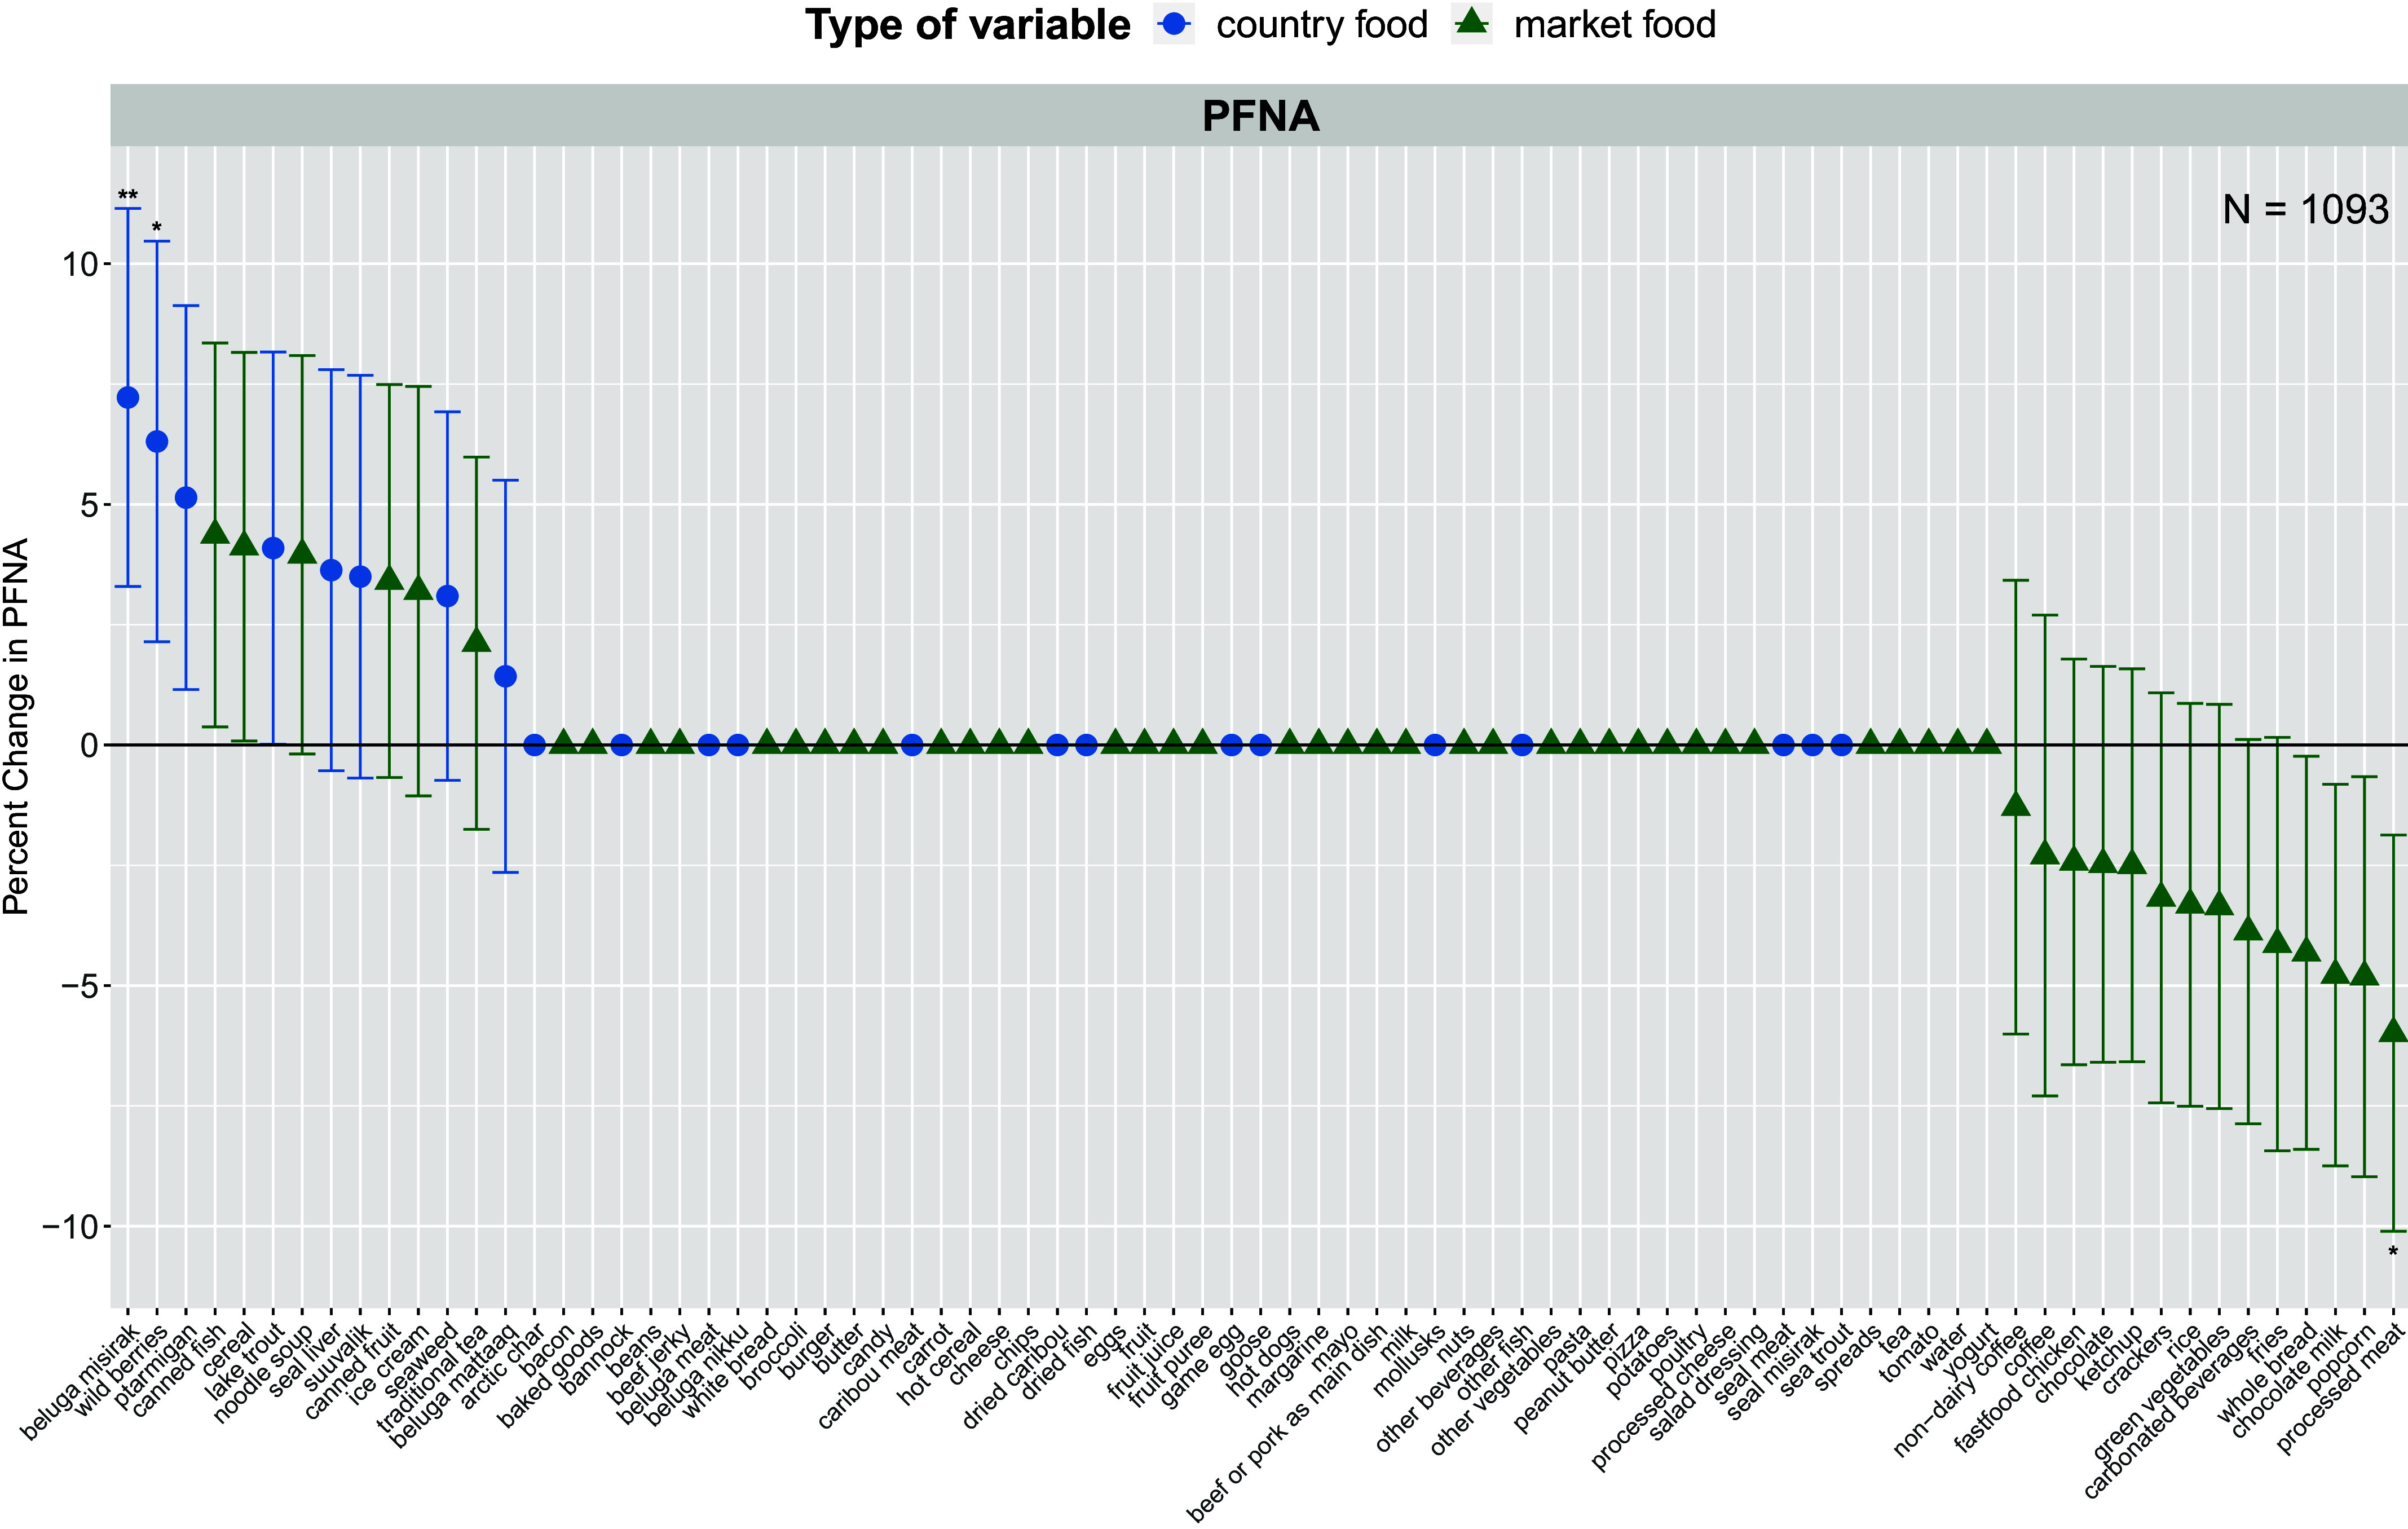
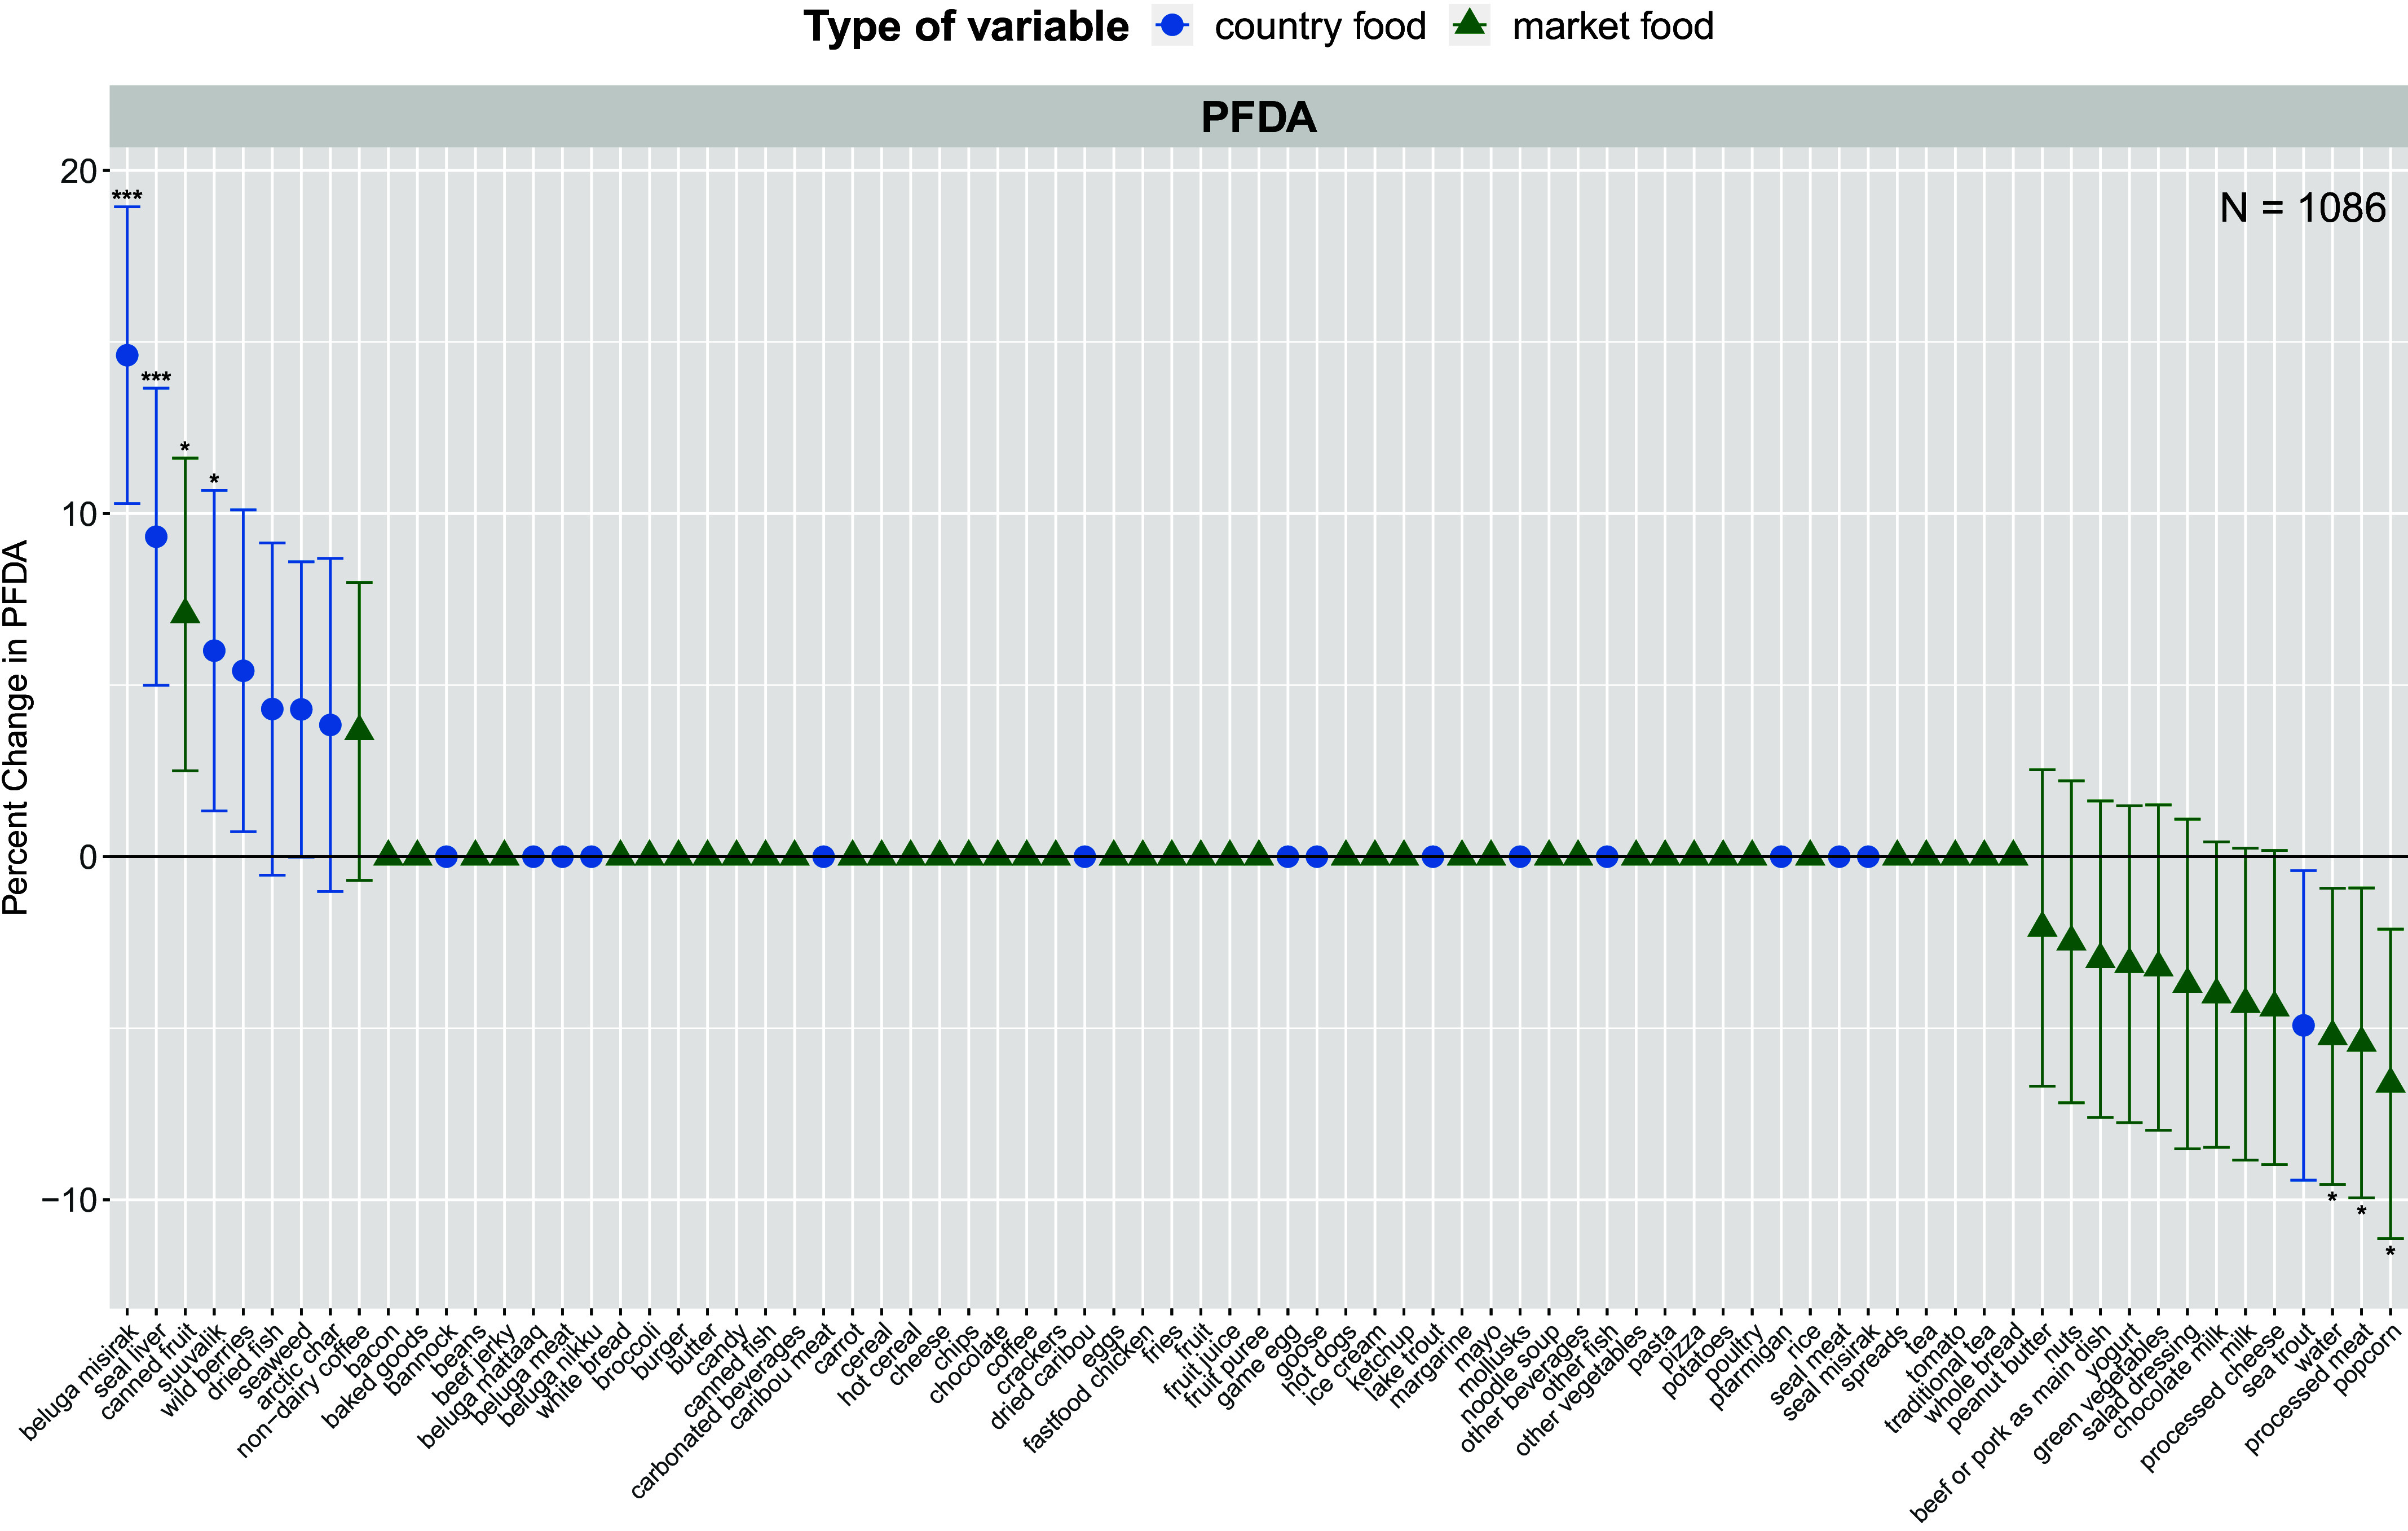
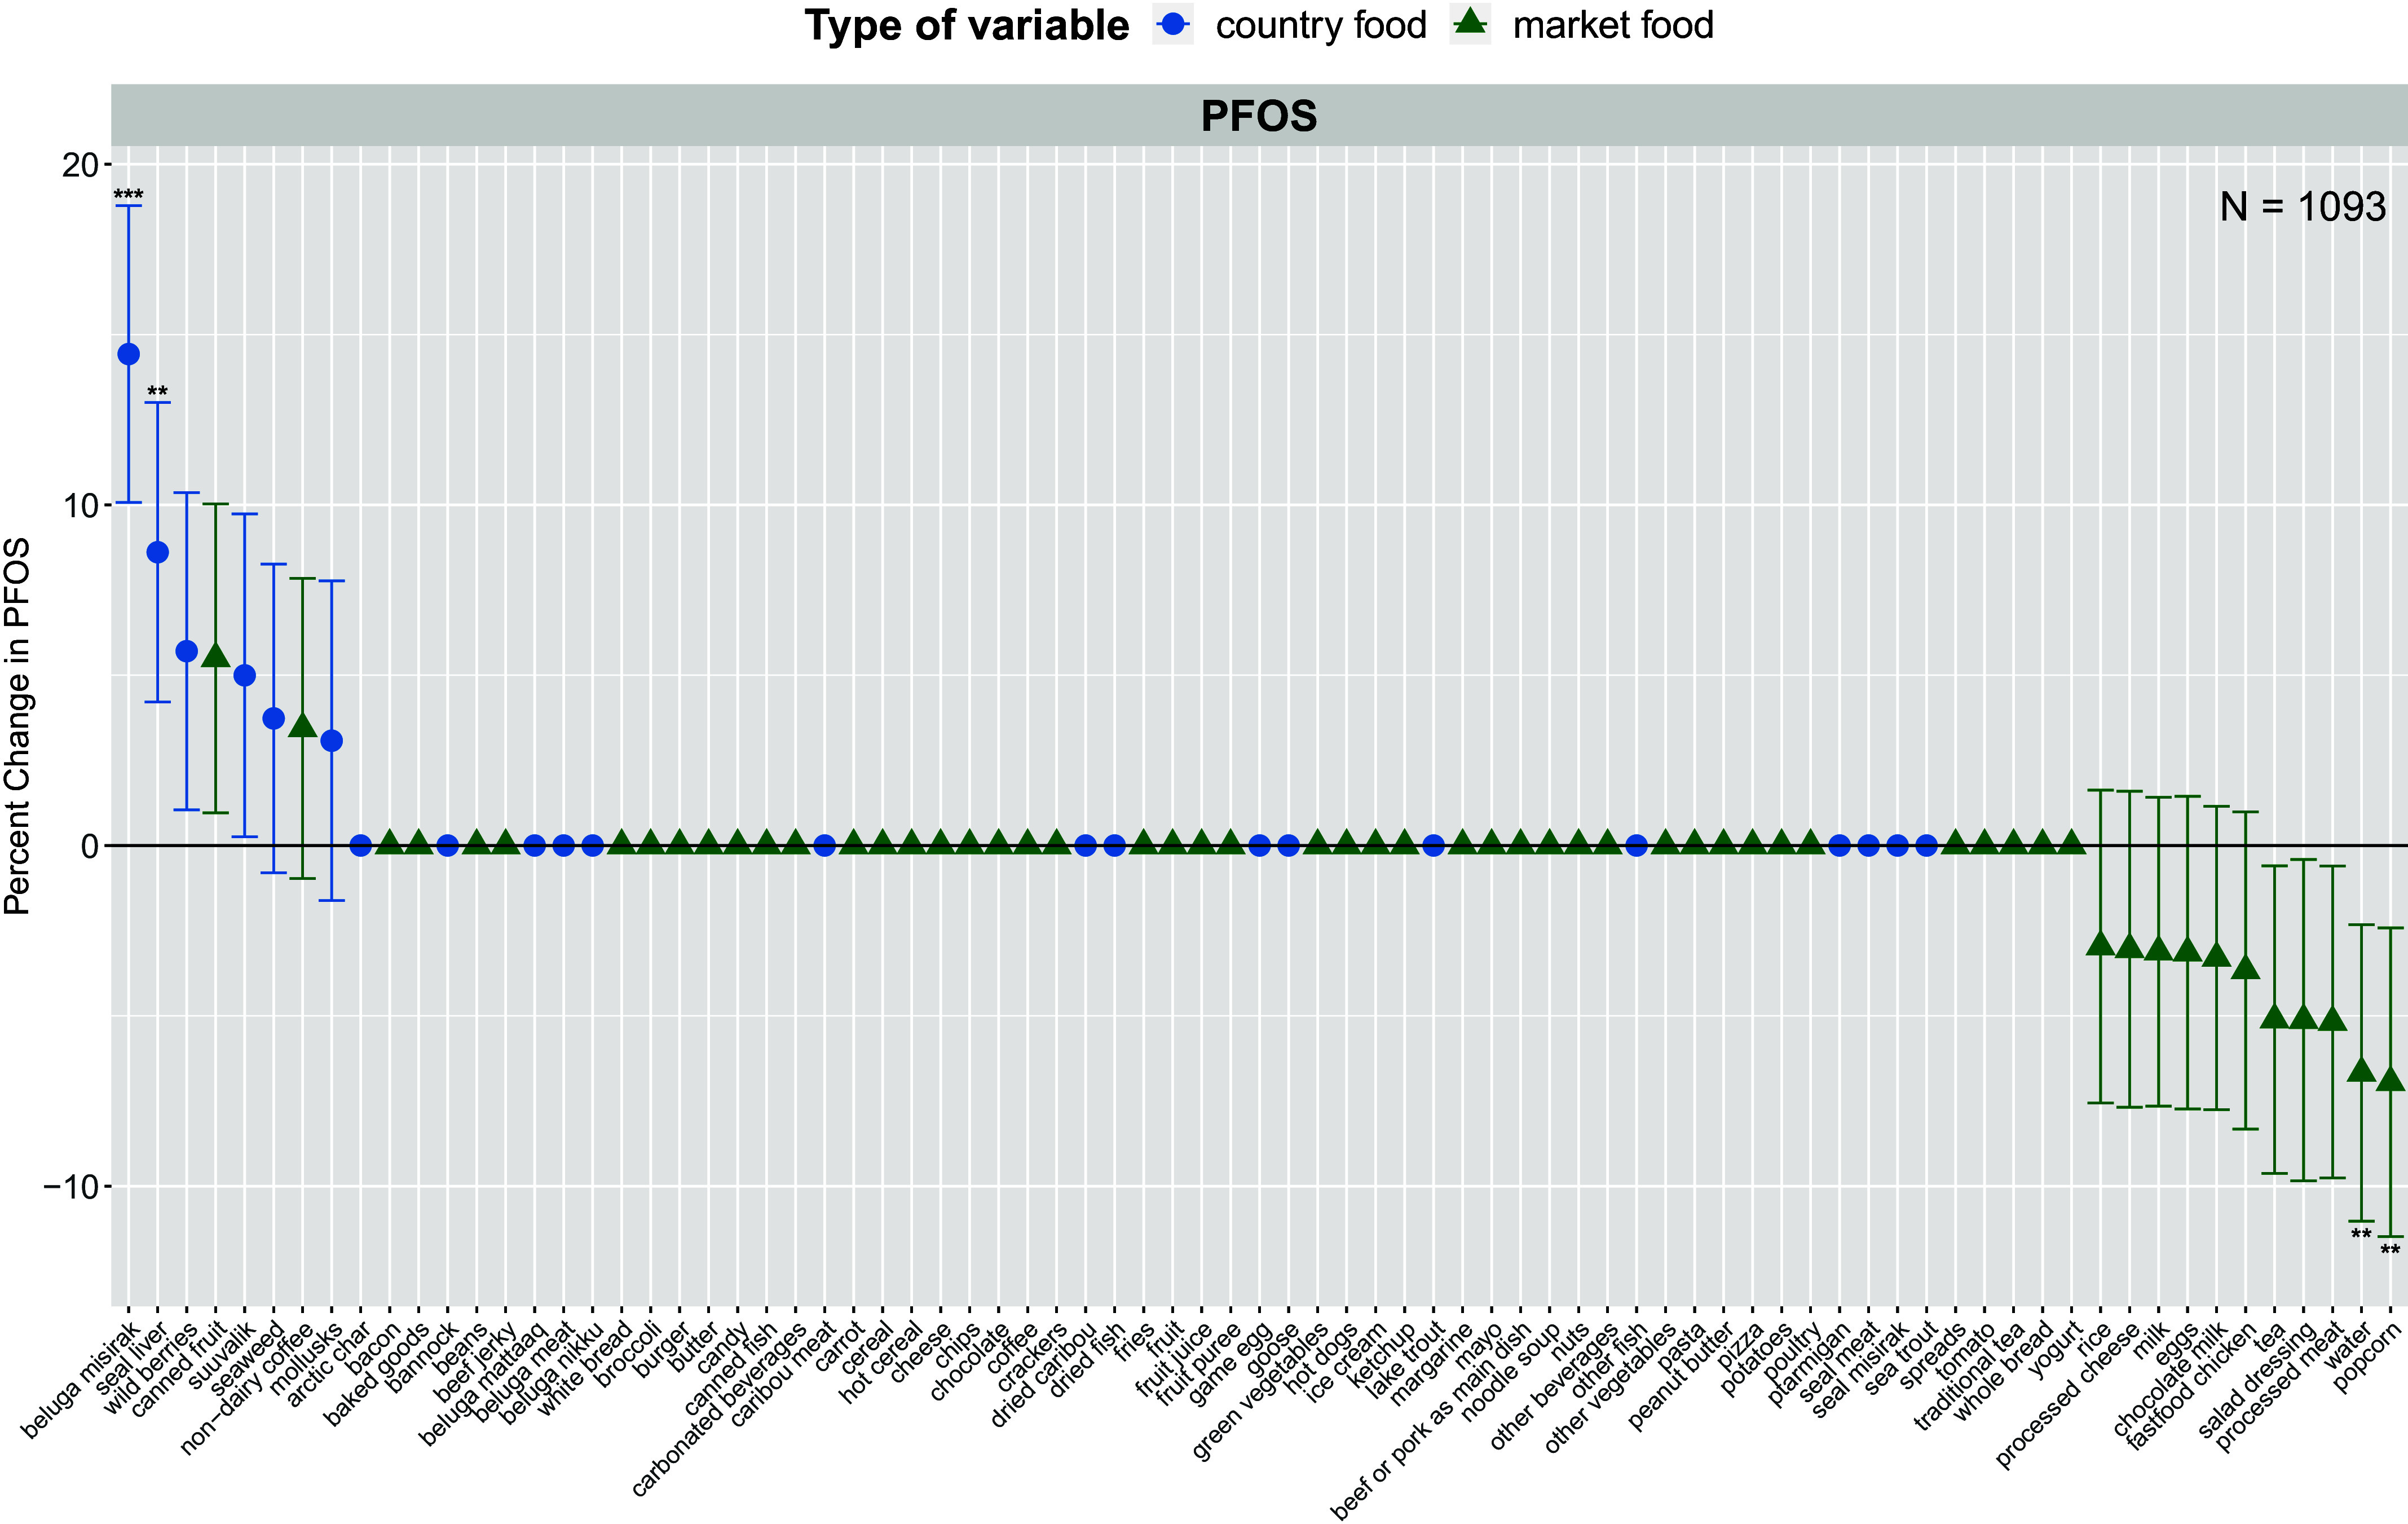
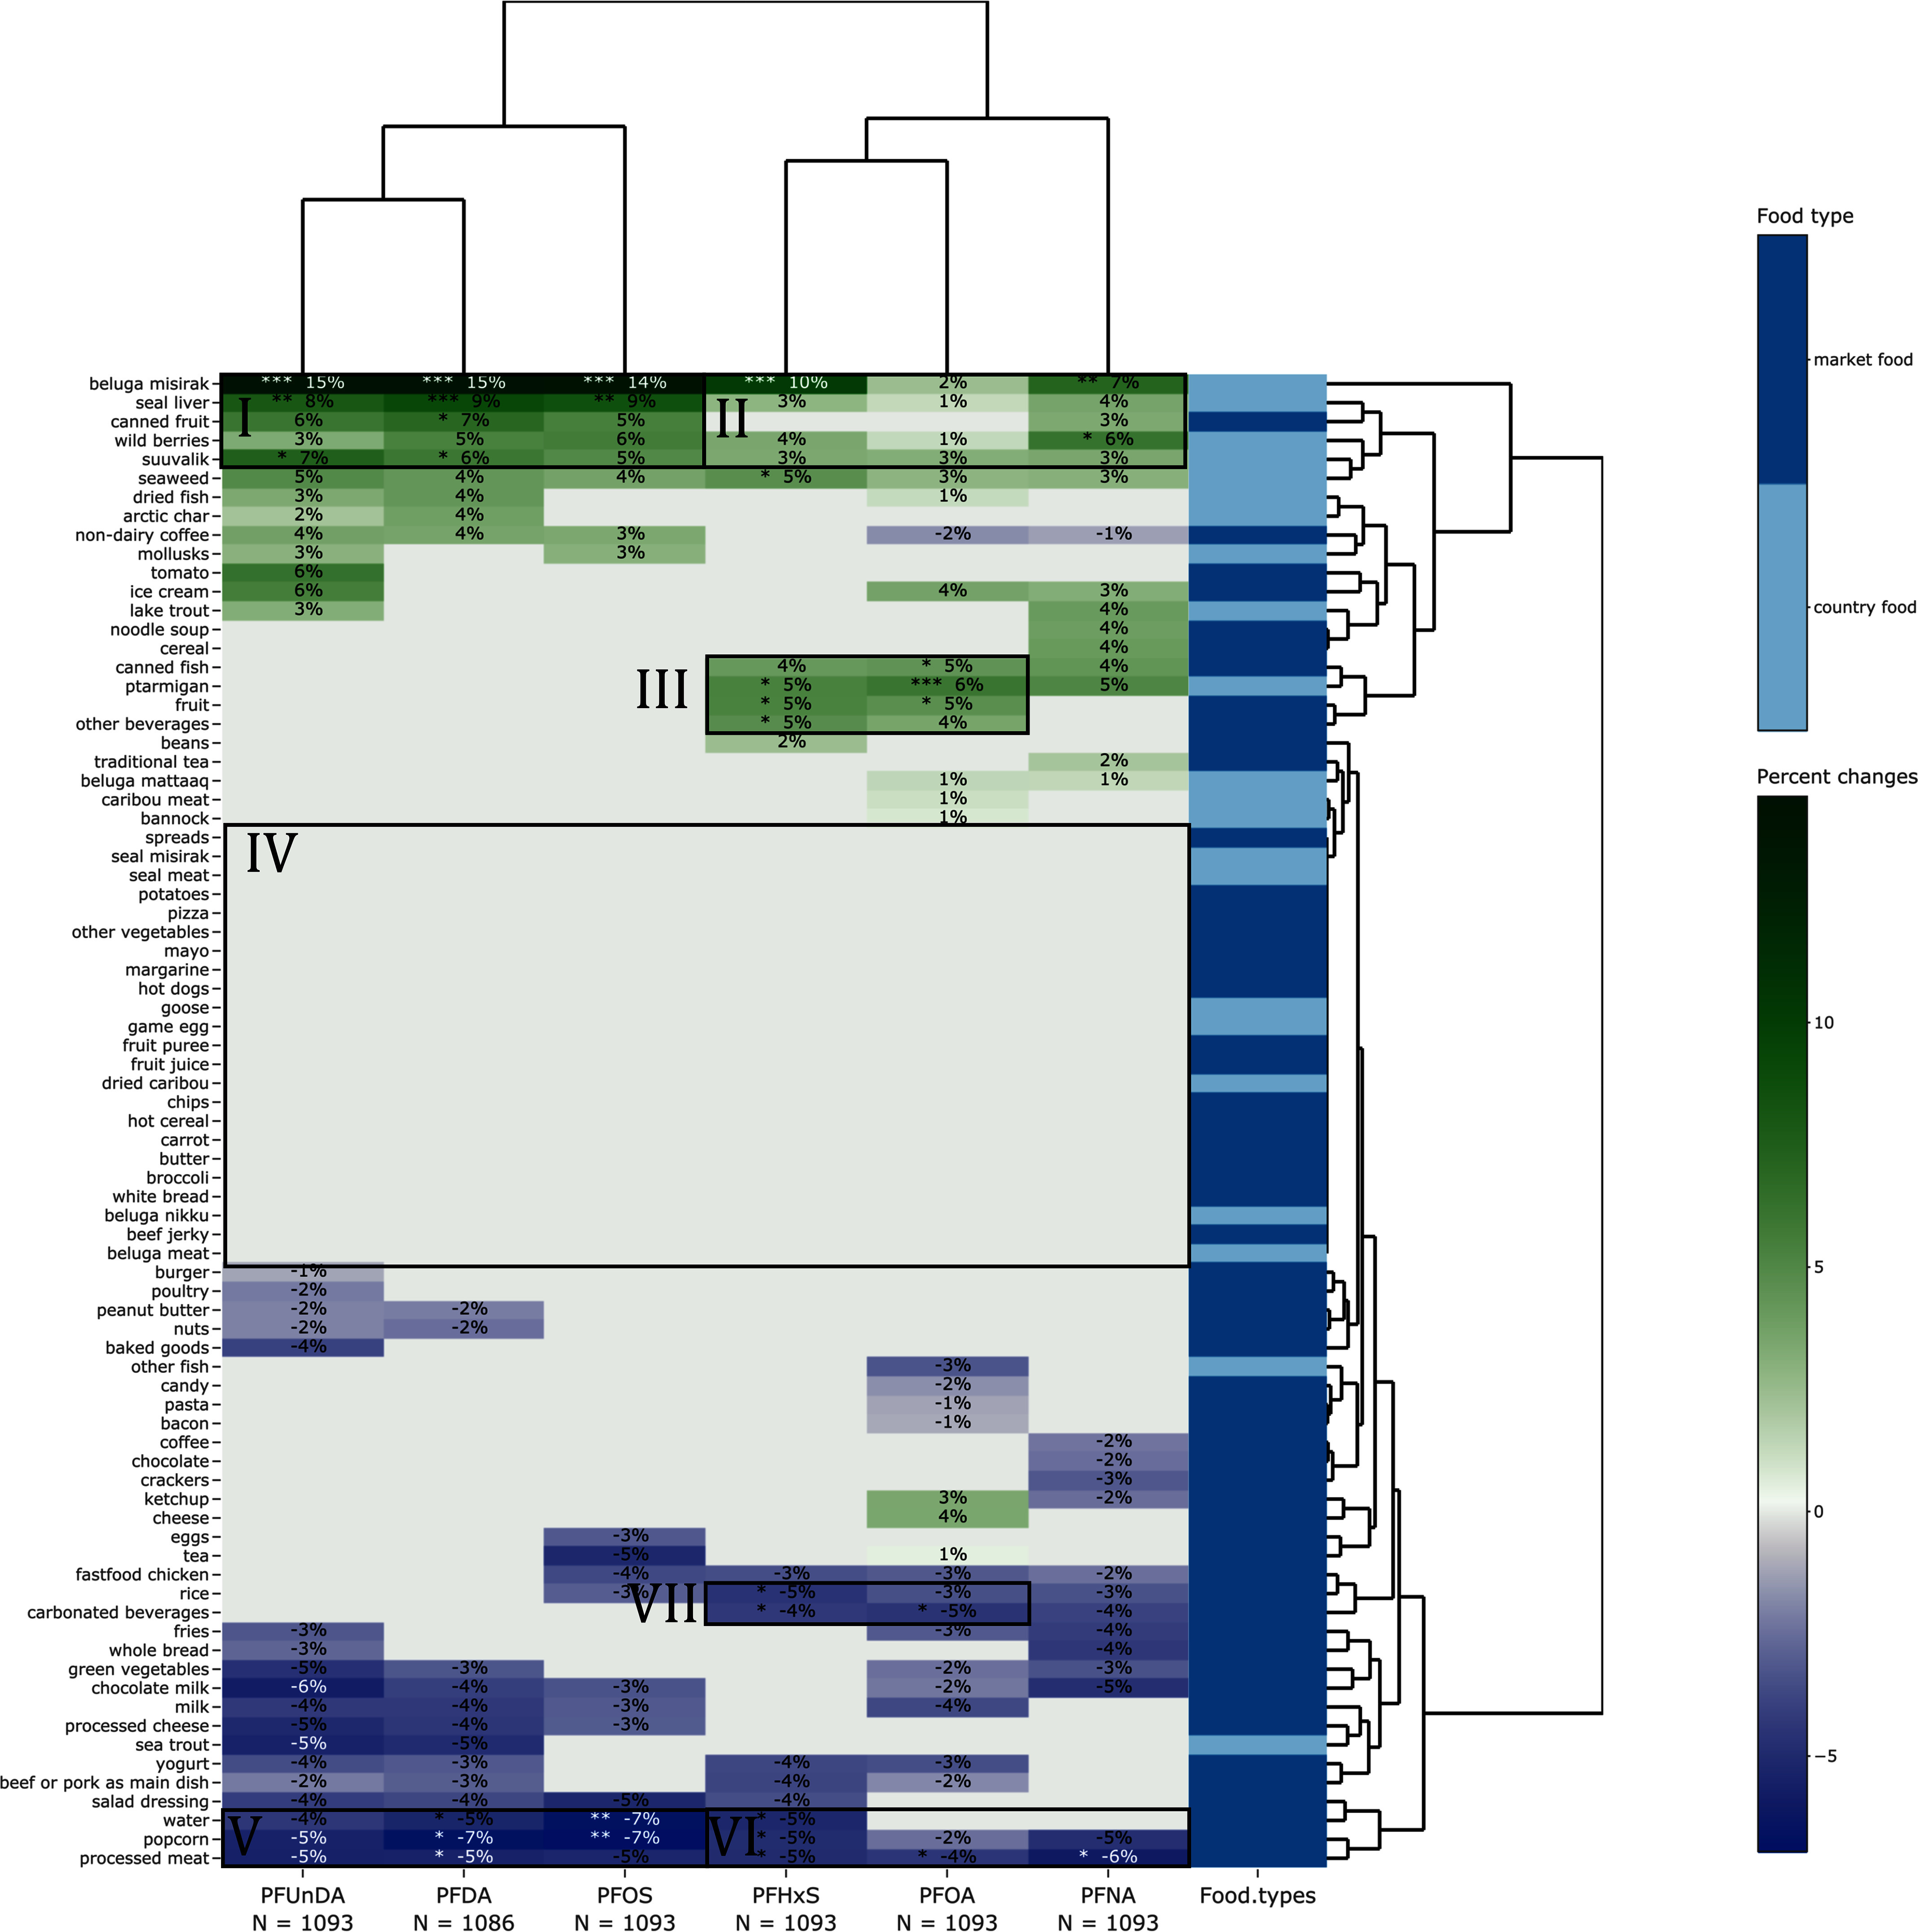
Results: Perfluorooctanesulfonic acid (PFOS), perfluorodecanoic acid (PFDA), and perfluoroundecanoic acid (PFUnDA) were associated with frequent consumption of beluga misirak (rendered fat) [14.6%; 95% confidence interval (CI): 10.3%, 18.9%; 14.6% (95% CI: 10.1%, 19.0%)], seal liver [9.3% (95% CI: 5.0%, 13.7%); 8.1% (95% CI: 3.5%, 12.6%)], and suuvalik (fish roe mixed with berries and fat) [6.0% (95% CI: 1.3%, 10.7%); 7.5% (95% CI: 2.7%, 12.3%)]. Beluga misirak was also associated with higher concentrations of perfluorohexanesulphonic acid (PFHxS) and perfluorononanoic acid (PFNA), albeit with lower percentage changes. PFHxS, perfluorooctanoic acid (PFOA), and PFNA followed some similar patterns, with higher levels associated with frequent consumption of ptarmigan [6.1% (95% CI: 3.2%, 9.0%); 5.1% (95% CI: 1.1%, 9.1%); 5.4% (95% CI: 1.8%, 9.0%)]. Among market foods, frequent consumption of processed meat and popcorn was consistently associated with lower PFAA exposure.

Conclusions: Our study identifies specific food items contributing to environmental contaminant exposure in Indigenous or small communities relying on local subsistence foods using adaptive elastic net to prioritize responses from a complex food frequency questionnaire. In Nunavik, higher PFAA biomarker levels were primarily related to increased consumption of country foods, particularly beluga misirak, seal liver, suuvalik, and ptarmigan. Our results support policies regulating PFAA production and use to limit the contamination of Arctic species through long-range transport. https://doi.org/10.1289/EHP13556.


Figures

Figure 1 is a schematic flowchart with six steps. Step 1: Compilation, including 9 cases of per- and polyfluoroalkyl substance congeners, 87 food items, and 1326 participants. Step 2: Cleaning, including 2 cases of excluded per- and polyfluoroalkyl substances Congeners with unique values less than 10, 1 case of exclude per- and polyfluoroalkyl substances congeners with detection frequency less than 25 percent, Aggregate the top 2 categories of highest consumption into one category for all food items, Convert food consumption categories to the number of meals per month, 8 cases, exclude food items consumed by less than 20 percent of the population, Redefine categories for marital status, education, alcohol consumption, and smoking status, and 133 cases of Exclude Participants with missing covariates. Step 3: Statistical analyses, including 6 cases of per- and polyfluoroalkyl substance congeners, 79 food items, and 1193 participants. Step 4: Feature Selection: Conduct an adaptive elastic net to identify important dietary factors predicting PFAS biomarker levels. This leads to Run adaptive elastic net model (A E N E T) with all food items. The equation displays the following information: Log 10 of open parenthesis uppercase x begin subscript per- and polyfluoroalkyl substances end subscript close parenthesis equals summation from lowercase italic j to 79 of lowercase beta begin subscript food item lowercase j, adaptive elastic net model end subscript uppercase x begin subscript food item, lowercase j end subscript plus lowercase beta begin subscript age, adaptive elastic net model end subscript uppercase x begin subscript age end subscript plus lowercase beta begin subscript age, adaptive elastic net model squared end subscript open parenthesis uppercase x begin subscript age end subscript close parenthesis squared plus lowercase beta begin subscript sex, adaptive elastic net model end subscript uppercase x begin subscript sex end subscript plus lowercase beta begin subscript education, adaptive elastic net model end subscript uppercase x begin subscript education end subscript plus lowercase beta begin subscript marital status, adaptive elastic net model end subscript uppercase x begin subscript marital status end subscript plus lowercase beta begin subscript smoking status, adaptive elastic net model end subscript uppercase x begin subscript smoking status end subscript plus lowercase beta begin subscript alcohol consumption, adaptive elastic net model end subscript uppercase x begin subscript alcohol consumption end subscript plus lowercase beta begin subscript 0, adaptive elastic net model end subscript. Lowercase j lowercase epsilon open brace 79 food items closed brace. Select food items where lowercase beta begin subscript food items lowercase j, the adaptive elastic net model end subscript is nonzero. Step 5: Determine Significance: Characterize the significance of the association between dietary factors and PFAS biomarker levels. This leads to a generalized linear regression (G L M) model with only selected food items. The equation displays the following information: Log 10 of open parenthesis uppercase x begin subscript per- and polyfluoroalkyl substances end subscript close parenthesis equals summation from lowercase italic k to less than 79 of lowercase beta begin subscript food item lowercase k, generalized linear regression end subscript uppercase x begin subscript food item, lowercase k end subscript plus lowercase beta begin subscript age, generalized linear regression end subscript uppercase x begin subscript age end subscript plus lowercase beta begin subscript age, generalized linear regression squared end subscript open parenthesis uppercase x begin subscript age end subscript close parenthesis squared plus lowercase beta begin subscript sex, generalized linear regression end subscript uppercase x begin subscript sex end subscript plus lowercase beta begin subscript education, generalized linear regression end subscript uppercase x begin subscript education end subscript plus lowercase beta begin subscript marital status, generalized linear regression end subscript uppercase x begin subscript marital status end subscript plus lowercase beta begin subscript smoking status, generalized linear regression end subscript uppercase x begin subscript smoking status end subscript plus lowercase beta begin subscript alcohol consumption, generalized linear regression end subscript uppercase x begin subscript alcohol consumption end subscript plus lowercase beta begin subscript 0, generalized linear regression end subscript. Uppercase k lowercase epsilon open brace less than 79 food items closed brace. Extract p-values from the generalized linear regression model and convert lowercase beta begin subscript food item lowercase k, generalized linear regression, end subscript to percent changes with open parenthesis 10 begin superscript lowercase beta begin subscript food item lowercase k, generalized linear regression end subscript end superscript minus 1 closed parenthesis times 100 percent. Step 6: Clustering: Identify groups of food items with similar associations across all per- and polyfluoroalkyl substance congeners. This leads to Conduct hierarchical agglomerative clustering on percent changes derived from lowercase beta begin subscript food item lowercase k, generalized linear regression end subscript using average linkage with Euclidean Distance.
Figure 1.
A schematic overview describing the analytical pipeline to identify the most important dietary sources predicting the PFAA biomarker levels among the Qanuilirpitaa? Nunavik Inuit Health Survey (Q2017) participants (n=1,093), Nunavik, northern Quebec, Canada. Our pipeline includes the curation process of PFAA congeners and food items, the inclusion criteria of participants, and the statistical methods used to characterize the associations between food items and PFAA biomarker levels. Note: PFAA, perfluoroalkyl acid.
Figure 2 is a forest plot titled Perfluorononanoic acid, plotting Percent Change in Perfluorononanoic acid, ranging from negative 10 to 10 in increments of 5 (y-axis) across beluga misirak, wild berries, ptarmigan, canned fish, cereal, lake trout, noodle soup, seal liver, suuvalik, canned fruit, ice cream, seaweed, traditional tea, beluga mattaaq, arctic char, bacon, baked goods, bannock, beans, beef jerky, beluga meat, beluga nikku, white bread, broccoli, burger, butter, candy, caribou meat, carrot, hot cereal, cheese, chips, dried caribou, dried fish, eggs, fruit, fruit juice, fruit puree, game egg, goose, hot dogs, margarine, mayo, beef or pork as main dish, milk, mollusks, nuts, other beverages, other fish, other vegetables, pasta, peanut butter, pizza, potatoes, poultry, processed cheese, salad dressing, seal meat, seal misirak, sea trout, spreads, tea, tomato, water, yogurt, non−dairy coffee, coffee, fast food chicken, chocolate, ketchup, crackers, rice, green vegetables, carbonated beverages, fries, whole bread, chocolate milk, popcorn, and processed meat (x-axis) for Type of variable, including country food and market food.
Figure 2.
Forest plot showing percent change in PFNA concentration and all food items in the Qanuilirpitaa? Nunavik Inuit Health Survey (Q2017), Nunavik, northern Quebec, Canada (n=1,093). Results are derived from generalized linear models with the outcome variable as biomarker concentrations of PFNA and the main predictors as the consumption of the food items normalized as z-scores. The models are adjusted for age, age2, sex, marital status, education, alcohol consumption, smoking, and food items selected by adaptive elastic net. Number of asterisks indicate statistical significance of the percent change: *p-value (0.01, 0.05), **p-value (0.001, 0.01), and ***p0.001. The p-values are corrected for multiple comparisons with the Benjamini-Hochberg false FDR procedure of 5%. Percent changes are represented by points, and 95% CIs are represented by the corresponding vertical lines. Corresponding results in Excel Table S5. Note: CI, confidence interval; FDR, false discovery rate; PFNA, perfluorononanoic acid.
Figure 3 is a forest plot titled Perfluorodecanoic acid, plotting Percent Change in Perfluorodecanoic acid, ranging from negative 10 to 20 in increments of 10 (y-axis) across beluga misirak, seal liver, canned fruit, suuvalik, wild berries, dried fish, seaweed, arctic char, non−dairy coffee, bacon, baked goods, bannock, beans, beef jerky, beluga mattaaq, beluga meat, beluga nikku, white bread, broccoli, burger, butter, candy, canned fish, carbonated beverages, caribou meat, carrot, cereal, hot cereal, cheese, chips, chocolate, coffee, crackers, dried caribou, eggs, fast food chicken, fries, fruit, fruit juice, fruit puree, game egg, goose, hot dogs, ice cream, ketchup, lake trout, margarine, mayo, mollusks, noodle soup, other beverages, other fish, other vegetables, pasta, pizza, potatoes, poultry, ptarmigan, rice, seal meat, seal misirak, spreads, tea, tomato, traditional tea, whole bread, peanut butter, nuts, beef or pork as main dish, yogurt, green vegetables, salad dressing, chocolate milk, milk, processed cheese, sea trout, water, processed meat, and popcorn (x-axis) for Type of variable, country food and market food.
Figure 3.
Forest plot showing percent change in PFDA concentration and all food items in the Qanuilirpitaa? Nunavik Inuit Health Survey (Q2017), Nunavik, northern Quebec, Canada (n=1,086). Results are derived from generalized linear models with the outcome variable as biomarker concentrations of PFDA and the main predictors as the consumption of the food items normalized as z-scores. The models are adjusted for age, age2, sex, marital status, education, alcohol consumption, smoking, and food items selected by adaptive elastic net. Number of asterisks indicate statistical significance of the percent change: *p-value (0.01, 0.05), **p-value (0.001, 0.01), and ***p 0.001. The p-values are corrected for multiple comparison with the Benjamini-Hochberg FDR procedure of 5%. Percent changes are represented by points, and 95% CIs are represented by the corresponding vertical lines. Corresponding results in Excel Table S5. Note: CI, confidence interval; FDR, false discovery rate; PFDA, perfluorodecanoic acid.
Figure 4 is a forest plot titled perfluorooctanesulfonic acid, plotting Percent Change in perfluorooctanesulfonic acid, ranging from negative 10 to 20 in increments of 10 (y-axis) across beluga misirak, seal liver, wild berries, canned fruit, suuvalik, seaweed, non−dairy coffee, mollusks, arctic char, bacon, baked goods, bannock, beans, beef jerky, beluga mattaaq,, beluga meat, beluga nikku, white bread, broccoli, burger, butter, candy, canned fish, carbonated beverages, caribou meat, carrot, cereal, hot cereal, cheese, chips, chocolate, coffee, crackers, dried caribou, dried fish, fries, fruit, fruit juice, fruit puree, game egg, goose, green vegetables, hot dogs, ice cream, ketchup, lake trout, margarine, mayo, beef or pork as main dish, noodle soup, nuts, other beverages, other fish, other vegetables, pasta, peanut butter, pizza, potatoes, poultry, ptarmigan, seal meat, seal misirak, sea trout, spreads, tomato, traditional tea, whole bread, yogurt, rice, processed cheese, milk, eggs, chocolate milk, fast food chicken, tea, salad dressing, processed meat, water, and popcorn (x-axis) for Type of variable, including country food and market food.
Figure 4.
Forest plot showing percent change in PFOS concentration and all food items in the Qanuilirpitaa? Nunavik Inuit Health Survey (Q2017), Nunavik, northern Quebec, Canada (n=1,093). Results are derived from generalized linear models with the outcome variable as biomarker concentrations of PFOS and the main predictors as the consumption of the food items normalized as z-scores. The models are adjusted for age, age2, sex, marital status, education, alcohol consumption, smoking, and food items selected by adaptive elastic net. Number of asterisks indicates statistical significance of the percent change: *p-value (0.01, 0.05), **p-value (0.001, 0.01), and ***p 0.001. The p-values are corrected for multiple comparison with the Benjamini-Hochberg FDR procedure of 5%. Percent changes are represented by points, and 95% CIs are represented by the corresponding vertical lines. Corresponding results in Excel Table S5. Note: CI, confidence interval; FDR, false discovery rate; PFOS, perfluorooctanesulfonic acid.
Figure 5 is a heatmap, plotting (top to bottom) beluga misirak, seal liver, canned fruit, wild berries, suuvalik, seaweed, dried fish, arctic char, non−dairy coffee, mollusks, tomato, ice cream, lake trout, noodle soup, cereal, canned fish, ptarmigan, fruit, other beverages, beans, traditional tea, beluga mattaaq, caribou meat, bannock, spreads, seal misirak, seal meat, potatoes, pizza, other vegetables, mayo, margarine, hot dogs, goose, game egg, fruit puree, fruit juice, dried caribou, chips, hot cereal, carrot, butter, broccoli, white bread, beluga nikku, beef jerky, beluga meat, burger, poultry, peanut butter, nuts, baked goods, other fish, candy, pasta, bacon, coffee, chocolate, crackers, ketchup, cheese, eggs, tea, fast food chicken, rice, carbonated beverages, fries, whole bread, green vegetables, chocolate milk, milk, processed cheese, sea trout, yogurt, beef or pork, as main dish, salad dressing, water, popcorn, and processed meat (y-axis) across 1093 cases of perfluoroundecanoic acid, 1086 cases of Perfluorodecanoic acid, 1093 cases of perfluorooctanesulfonic acid, 1093 cases of Perfluorohexanesulfonic acid, 1093 cases of perfluorooctanoic acid, 1093 cases of Perfluorononanoic acid, and food types (x-axis) for food types, including market food and country food. A scale depicts the percent changes ranges from negative 5 to 10 in increments of 5.
Figure 5.
Heatmap of percent changes of the six detectable PFAAs by all food items in the Qanuilirpitaa? Nunavik Inuit Health Survey (Q2017), Nunavik, northern Quebec, Canada. Results are derived from generalized linear models with the outcome variable as biomarker levels of PFAAs and the main predictors as the consumption of the food items normalized as z-scores. The models are adjusted for age, age2, sex, marital status, education, alcohol consumption, smoking, and food items selected by adaptive elastic net. The dendrogram of the food items and PFAAs are defined based on hierarchical clustering with using the complete linkage function with Euclidean distance. Number of asterisks indicates the statistical significance of the percent change: *p-value (0.01, 0.05), **p-value (0.001, 0.01), and ***p 0.001. The p-values are corrected for multiple comparisons with the Benjamini-Hochberg FDR procedure of 5%. Corresponding results in Excel Table S5. Note: CI, confidence interval; FDR, false discovery rate; PFAA, perfluoroalkyl acids.

Similar articles

References

    1. Aker A, Ayotte P, Caron-Beaudoin E, De Silva A, Ricard S, Gaudreau É, et al. . 2023. Plasma concentrations of perfluoroalkyl acids and their determinants in youth and adults from Nunavik, Canada. Chemosphere 310:136797, PMID: 36244416, 10.1016/j.chemosphere.2022.136797. - DOI - PubMed
    1. AMAP (Arctic Monitoring and Assessment Programme). 2021. POPs and Chemicals of Emerging Arctic Concern: Influence of Climate Change, Summary for Policy-Makers. Tromsø, Norway: AMAP.
    1. Caron-Beaudoin É, Ayotte P, Blanchette C, Muckle G, Avard E, Ricard S, et al. . 2020. Perfluoroalkyl acids in pregnant women from Nunavik (Quebec, Canada): trends in exposure and associations with country foods consumption. Environ Int 145:106169, PMID: 33041046, 10.1016/j.envint.2020.106169. - DOI - PubMed
    1. Sonne C, Dietz R, Jenssen BM, Lam SS, Letcher RJ. 2021. Emerging contaminants and biological effects in Arctic wildlife. Trends Ecol Evol 36(5):421–429, PMID: 33602568, 10.1016/j.tree.2021.01.007. - DOI - PubMed
    1. Evich MG, Davis MJB, McCord JP, Acrey B, Awkerman JA, Knappe DRU, et al. . 2022. Per- and polyfluoroalkyl substances in the environment. Science 375(6580):eabg9065, PMID: 35113710, 10.1126/science.abg9065. - DOI - PMC - PubMed

Publication types

LinkOut - more resources