. 2024 Apr 29;20(4):e1012030.
doi: 10.1371/journal.pcbi.1012030. eCollection 2024 Apr.

Recurrent neural networks that learn multi-step visual routines with reinforcement learning

Affiliations

Recurrent neural networks that learn multi-step visual routines with reinforcement learning

Sami Mollard et al. PLoS Comput Biol. .

Abstract

Many cognitive problems can be decomposed into series of subproblems that are solved sequentially by the brain. When subproblems are solved, relevant intermediate results need to be stored by neurons and propagated to the next subproblem, until the overarching goal has been completed. We will here consider visual tasks, which can be decomposed into sequences of elemental visual operations. Experimental evidence suggests that intermediate results of the elemental operations are stored in working memory as an enhancement of neural activity in the visual cortex. The focus of enhanced activity is then available for subsequent operations to act upon. The main question at stake is how the elemental operations and their sequencing can emerge in neural networks that are trained with only rewards, in a reinforcement learning setting. We here propose a new recurrent neural network architecture that can learn composite visual tasks that require the application of successive elemental operations. Specifically, we selected three tasks for which electrophysiological recordings of monkeys' visual cortex are available. To train the networks, we used RELEARNN, a biologically plausible four-factor Hebbian learning rule, which is local both in time and space. We report that networks learn elemental operations, such as contour grouping and visual search, and execute sequences of operations, solely based on the characteristics of the visual stimuli and the reward structure of a task. After training was completed, the activity of the units of the neural network elicited by behaviorally relevant image items was stronger than that elicited by irrelevant ones, just as has been observed in the visual cortex of monkeys solving the same tasks. Relevant information that needed to be exchanged between subroutines was maintained as a focus of enhanced activity and passed on to the subsequent subroutines. Our results demonstrate how a biologically plausible learning rule can train a recurrent neural network on multistep visual tasks.


Conflict of interest statement

The authors have declared that no competing interests exist.

Figures

Fig 1
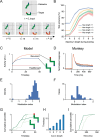
Fig 1. Example stimuli for the three tasks.
A, Trace task. The monkey makes an eye movement toward the blue dot connected to the red fixation point. The representation of the target curve in the visual cortex is enhanced because extra neuronal activity spreads over this curve (yellow). B, Search-then-trace task. The monkey searches for a marker with one of two colors and then traces the curve that starts at this marker to its other end to make an eye movement to the blue dot. This task requires visual search followed by curve-tracing. In the visual cortex, the search operation first labels the target marker with enhanced activity (light blue circle). Its position can be used as the starting position of the tracing operation which propagates enhanced activity over the target curve (light yellow). C, Trace-then-search task. The monkey first traces the target curve connected to the fixation point and identifies the color at the end of this curve. It then has to search for a disk with the same color, which is the target for an eye movement. In the visual cortex, enhanced activity first propagates across the target curve and identifies the target color (trace operation, light yellow), which is used during the subsequent search (light blue circle).
Fig 2
Fig 2. Example stimuli for the three tasks for the model.
A, Trace task. The task is to make an eye movement to the blue pixel of the curve starting with a red pixel. B, Search-then-trace task. The model searches for a target marker (here red, as cued on the left of the array) and it has to make an eye movement to the blue pixel at the other end of the curve starting with this marker. C, Trace-then-search task. The model traces the curve starting with the blue pixel to identify a colored marker at the other end (here brown), which cued the target color that the model should select at the left of the grid. Each trial started with the full stimulus in view.
Fig 3
Fig 3. Architecture of the network.
The network comprises one input layer, two hidden layers and one output layer. The input and hidden layers have four features each. In each layer, units belong to the feedforward or to the recurrent group. The activity of units in the recurrent group is gated by input of neurons in the feedforward group with the same RF so that they cannot participate in the spread of enhanced activity in case the corresponding feedforward unit is inactive.
Fig 4
Fig 4. RELEARNN for an example stimulus.
A. Correct choice by the network. In the first phase, activity propagates in the regular network that has both feedforward and recurrent connections (squares) until this network reaches a stable state. Here enhanced activity (yellow) spreads over the target curve. In the second phase, a winning unit is selected and activates the corresponding unit of the accessory network (small circles). From there, activity propagates in the accessory network (small orange circles) to tag the connections that influence the Q-value of the chosen action. After a few timesteps, activity in the accessory unit xiacc becomes proportional to the influence of the activity of the corresponding regular unit xi on the chosen output unit Qa. In the third phase, a reward is given if the action was correct, or not in case of an error, and a neuromodulator (green cloud, δ) broadcasts the reward prediction error to the network. Weights are changed according to a four-factor Hebbian learning rule (green connections between the units are increased). B. Incorrect choice by the network. In this case, the enhanced activity spreads over the wrong curve and reward prediction error is negative because of the wrong choice (red cloud). Hence, the weights between units that represent the distractor curve are decreased (red connections).
Fig 5
Fig 5. Propagation of enhanced activity across the representation of the target curve during curve-tracing.
A. Upper, example stimulus presented to one of the networks. The target curve starts with a red pixel. Lower, activity of recurrent units in the input layer across time. The orange color denotes an increase in activity. Note the spread of enhanced activity over the representation of the target curve, starting at the red pixel. B. Testing accuracy for curves of length up to N+4 pixels where N is the maximum length used during training. At the beginning of training, the model does not generalize to longer curves. At the end of training, a model trained with curves up to 9 pixels long generalized to curves with up to 13 pixels (p<10−6, Wilcoxon signed-rank test). C. Activity of an example unit in the recurrent group elicited by the target (orange) or distractor curve (blue), and activity of the corresponding unit in the feedforward group (brown). The activity elicited by the target curve is enhanced compared to that elicited by the distractor curve. D. Average activity of neurons in area V1 of the visual cortex of monkeys during a curve tracing task, when their RF fell on the target curve (orange) or on the distractor curve (blue). Adapted from [26] E. Distribution of the modulation index across recurrent units of the neural networks. A positive value indicates an enhanced response to the target curve. F. Distribution of modulation index in area V1 of the visual cortex of monkeys (from [17]) G. Distribution of the modulation latency across units of the network. The onset of modulation is delayed for units representing pixels that are farther (7 pixels away), compared to pixels that are closer (2 pixels away) to the beginning of the curve (p<10−15, Mann-Whitney U test). H. The minimum number of timesteps needed to reach 85% accuracy increased for longer curves, indicating the need for recurrent processing. Error bars, 95%-confidence intervals. I. Distribution of the modulation latency across recording sites in monkeys performing the curve-tracing task, adapted from [18]. Dark green represents RF that were close to the fixation point, and light green represents RF that were farther from the fixation point.
Fig 6
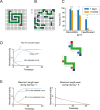
Fig 6. RELEARNN mechanisms.
A,B. More challenging curve tracing stimuli with long spirals (A) or with many distractors (B). C. Accuracy of networks trained on the curve-tracing task with one distractor, when tested on the curve-tracing task with 10 distractors. The networks trained with RELEARNN could solve the task as well, irrespective of the number of distractors (p = 0.17, Mann-Whitney test). Networks trained with BPTT did not generalize as well (p<10−5, Mann-Whitney test) and feedforward networks could not be trained on the curve-tracing task, i.e. they were at chance level. D. Activity of units in the accessory network whose RFs fall on the selected curve (blue traces) or the non-selected one (orange traces), at different distances from the blue pixel that is the target of the eye movement (continuous and dotted traces show the activity of accessory units representing pixels nearer to and farther from the saccade target, respectively). Hence, the credit assignment signal propagates in the opposite direction than to the enhanced activity, starting from the selected eye-movement target. This credit assignment signal is absent from the representation of the distractor curve. E. Activity of units at the beginning of the selected and non-selected curves in the accessory network, for curves that were one (left panel) or five pixels longer (right) than the curves used during training. If the length of the curve was similar to that in the curriculum, the credit assignment signal propagated to the beginning of the selected curve (red fixation point on correct trials) and training is effective. However, if the curves are much longer, the credit assignment signal does not spread to all other pixels of the selected curve and training fails.
Fig 7
Fig 7. Search-then-trace task.
A. Example stimulus shown to one of the networks. Upper panel, visual stimulus. Lower panel, orange shading shows the propagation of enhanced activity among recurrent units of the input layer, starting at the representation of the red marker, which is highlighted as the result of the search operation. From here, the enhanced activity spread along the curve (trace operation). B. We tested how well the models generalized to curves that were longer than those presented during training. Generalization was better for networks that had been trained on longer curves (x-axis). E.g. networks trained on curves up to a length of 9 pixels generalized to curves with 13 pixels (p<10−6, Wilcoxon signed-rank test). C. Normalized response enhancement for the target marker and target curve. Each curve is normalized by its maximum over time. First the activity of the unit with a RF at the location of the target marker was enhanced (search operation, red curve). Thereafter, enhanced activity propagated across the target curve connected to it (trace operation, green curves). D. In the visual cortex of monkeys, the representation of the target marker is enhanced (red) before the enhanced activity spreads over the V1 representation of the target curve (green; adapted from [25]). E. Distribution of the latency of the response enhancement across 260,000 stimuli and 19 networks. The latency of the modulation related to the search operation was shorter than that related to curve-tracing (p<10−15, Mann-Whitney U test). F. Distribution of the latency of response enhancements across V1 neurons in monkeys solving the search-then-trace task (adapted from [25]).
Fig 8
Fig 8. Model performance in the trace-then-search task.
A. Example stimulus shown to one of the networks. Upper, an example stimulus. Lower, the spread of enhanced activity is shown in orange. It first spreads over the curve starting at the blue cue and reaches the target marker at the other end, cuing the color that needed to be selected during the search operation. B. Testing accuracy for curves of length up to N+4 pixels where N is the maximum length in the curriculum. The generalization performance improved when the network learned to trace longer curves (p = 1.5·10−4 for curves of 13 pixels, Wilcoxon signed-rank test). C. Normalized response enhancement for target pixels, averaged across units. Each curve is normalized by its maximum over time. First the curve connected to the fixation point is labeled with enhanced activity (trace operation, green curves) and then the units that represent the correct eye movement target, i.e. with the same color as the target marker, enhanced their activity (search operation, red trace). D. In the visual cortex of monkeys, the response enhancement also first labels the segments of the target curve (green trace), before it labels the position of the eye movement target (red trace; adapted from [25]). E. Distribution of the modulation latency across model units (230,000 stimuli and 16 networks). The response modulation of trace operation precedes that of the search operation (p = 1.5·10−5, Mann-Whitney U test). F. Distribution of the modulation latency across recording sites in monkeys solving the search-then-trace task (adapted from [25]).

Similar articles

Cited by

References

    1. Ullman S. Visual routines. Cognition. 1984;18: 97–159. doi: 10.1016/0010-0277(84)90023-4 - DOI - PubMed
    1. Roelfsema PR, Lamme VAF, Spekreijse H. The implementation of visual routines. Vision Research. Pergamon; 2000. pp. 1385–1411. doi: 10.1016/s0042-6989(00)00004-3 - DOI - PubMed
    1. Roelfsema PR. Elemental operations in vision. Trends Cogn Sci. 2005;9: 226–233. doi: 10.1016/j.tics.2005.03.012 - DOI - PubMed
    1. Zylberberg A, Dehaene S, Roelfsema PR, Sigman M. The human Turing machine: A neural framework for mental programs. Trends in Cognitive Sciences. 2011. pp. 293–300. doi: 10.1016/j.tics.2011.05.007 - DOI - PubMed
    1. Horswill I. Visual routines and visual search: a real-time implementation and an automata-theoretic analysis.

Publication types