. 2024 Apr 29;20(4):e1012191.
doi: 10.1371/journal.ppat.1012191. eCollection 2024 Apr.

CD39 expression by regulatory T cells participates in CD8+ T cell suppression during experimental Trypanosoma cruzi infection

Affiliations

CD39 expression by regulatory T cells participates in CD8+ T cell suppression during experimental Trypanosoma cruzi infection

Cintia L Araujo Furlan et al. PLoS Pathog. .

Abstract

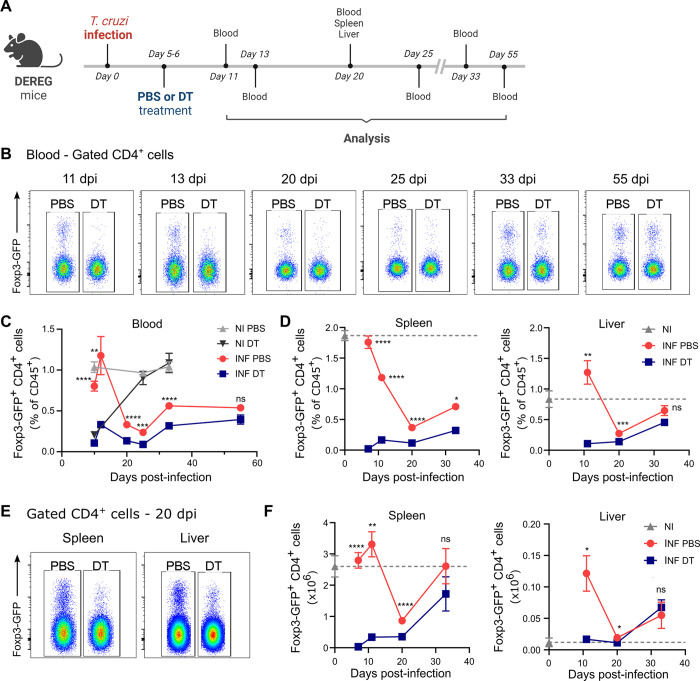
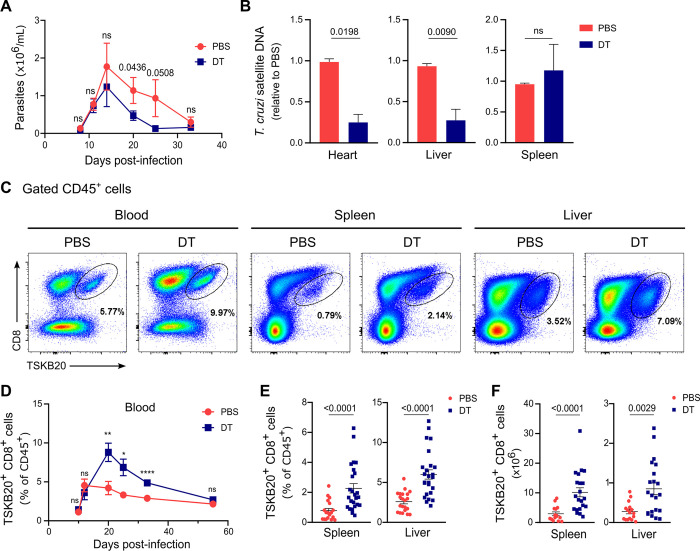
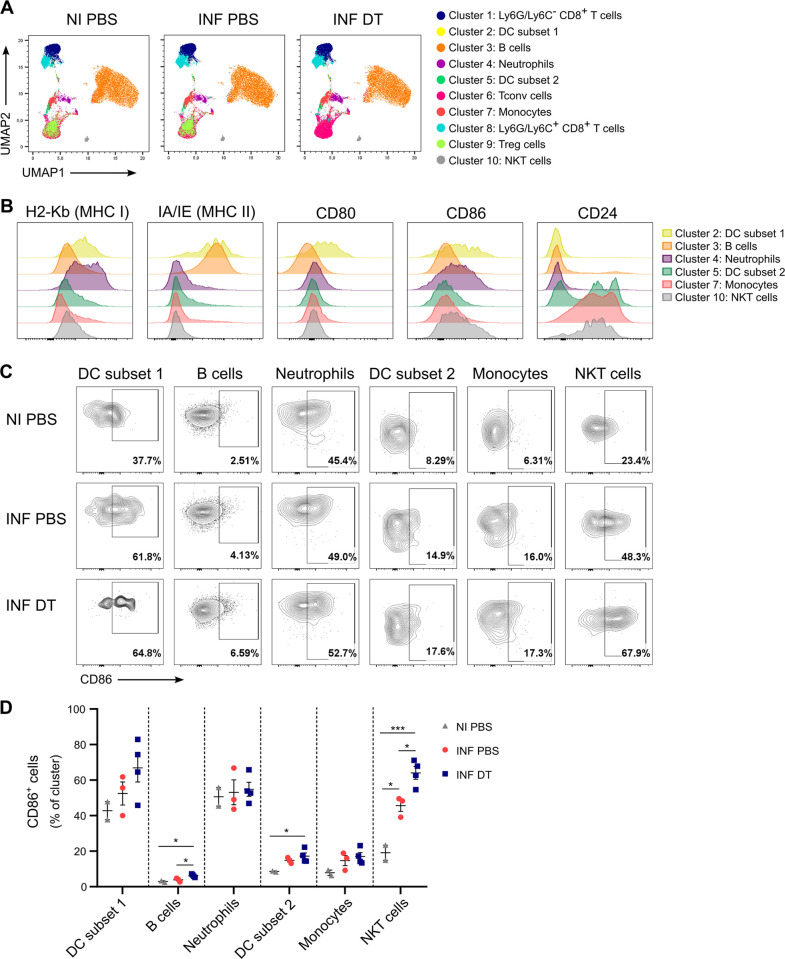
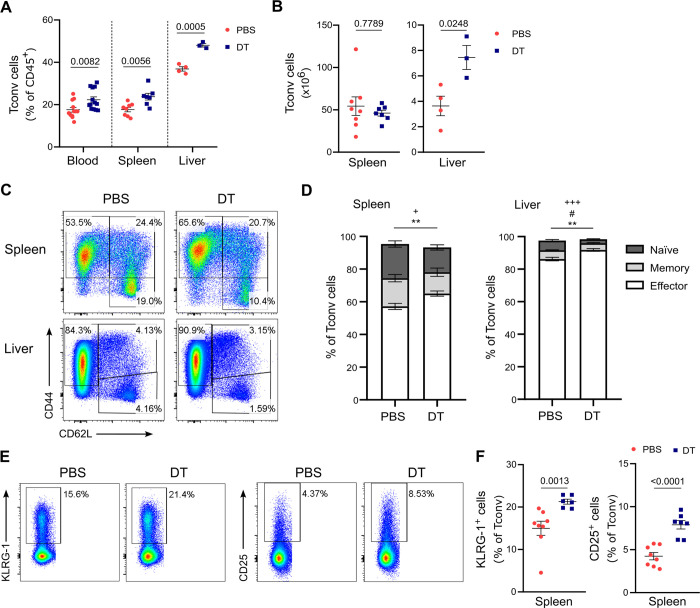
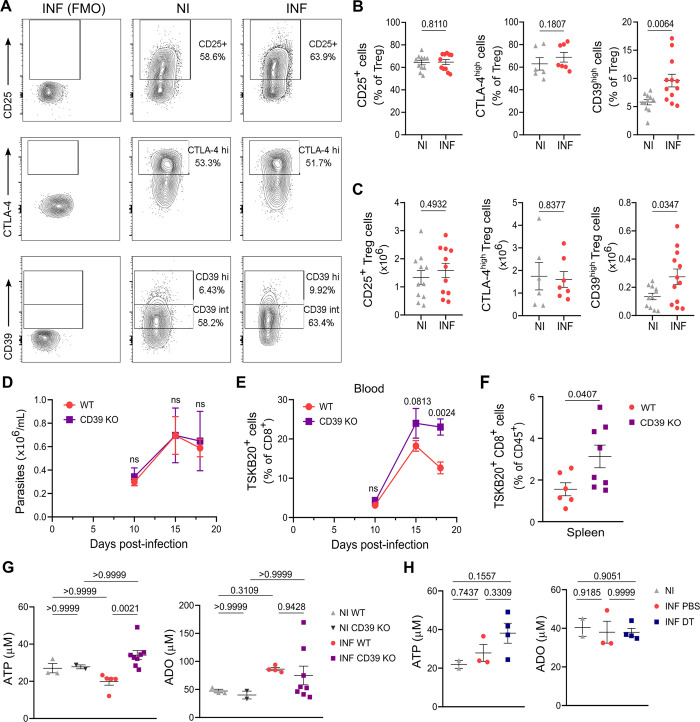
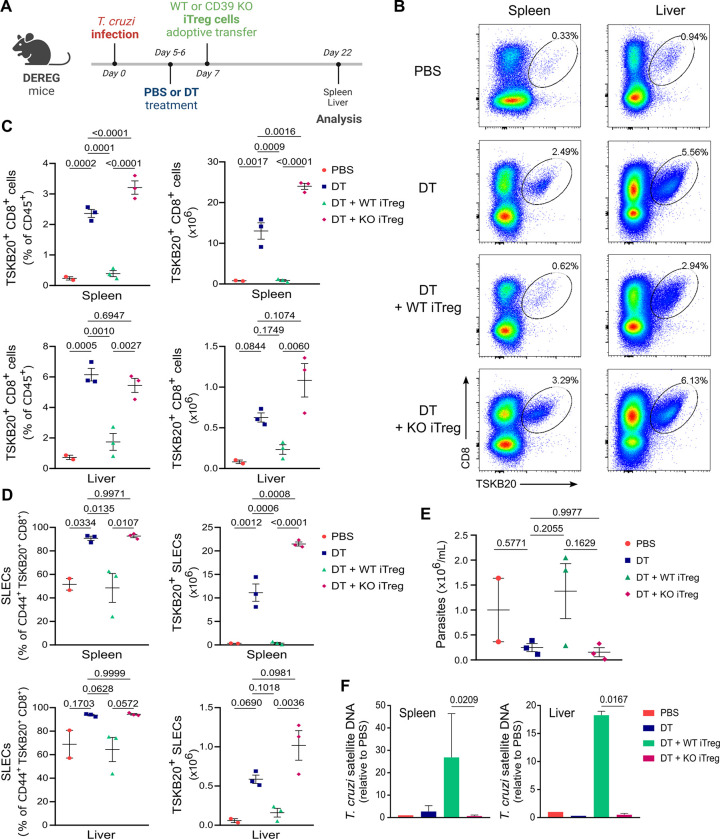
An imbalance between suppressor and effector immune responses may preclude cure in chronic parasitic diseases. In the case of Trypanosoma cruzi infection, specialized regulatory Foxp3+ T (Treg) cells suppress protective type-1 effector responses. Herein, we investigated the kinetics and underlying mechanisms behind the regulation of protective parasite-specific CD8+ T cell immunity during acute T. cruzi infection. Using the DEREG mouse model, we found that Treg cells play a role during the initial stages after T. cruzi infection, restraining the magnitude of CD8+ T cell responses and parasite control. Early Treg cell depletion increased the frequencies of polyfunctional short-lived, effector T cell subsets, without affecting memory precursor cell formation or the expression of activation, exhaustion and functional markers. In addition, Treg cell depletion during early infection minimally affected the antigen-presenting cell response but it boosted CD4+ T cell responses before the development of anti-parasite effector CD8+ T cell immunity. Crucially, the absence of CD39 expression on Treg cells significantly bolstered effector parasite-specific CD8+ T cell responses, preventing increased parasite replication in T. cruzi infected mice adoptively transferred with Treg cells. Our work underscores the crucial role of Treg cells in regulating protective anti-parasite immunity and provides evidence that CD39 expression by Treg cells represents a key immunomodulatory mechanism in this infection model.


Conflict of interest statement

The authors have declared that no competing interests exist.

Figures

Fig 1
Fig 1. DT injection efficiently depletes Treg cells in DEREG mice during acute T. cruzi infection.
A) Experimental scheme illustrating DT treatment (created with BioRender.com). B-C) Representative flow cytometry dot plots depicting Foxp3-GFP expression (B) and Treg cell frequencies (C) in the blood of PBS or DT-treated T. cruzi-infected (INF) DEREG mice at different days post-infection (dpi) and non-infected (NI) controls. D-F) Kinetics analysis of Treg cell frequencies (D), representative flow cytometry dot plots showing Foxp3-GFP expression (E), and kinetics analysis of Treg cell absolute numbers (F) in spleen and liver of PBS or DT-treated T. cruzi-infected DEREG mice and non-infected controls. All data are presented as mean ± SEM. Data were collected from 1–3 independent experiments. A total of 2–18 mice per group were included. In (C) n = 2–3 for NI groups, n = 12–13 at 10 dpi, n = 7 at 12 dpi, n = 16–18 at 20 dpi, n = 6 at 25 dpi, n = 12 at 33 dpi, n = 5–7 at 55 dpi. In (D) and (F) n = 2–7 for NI, n = 10–12 at 7 dpi, n = 3–4 at 11 dpi, n = 8–14 at 20 dpi, n = 4–5 at 33 dpi. Statistical significance was determined by Unpaired t test or Mann Whitney test, according to data distribution. Statistical analysis represents pairwise comparisons between INF PBS and INF DT groups. * P ≤ 0.05, ** P ≤ 0.01, *** P ≤ 0.001, **** P ≤ 0.0001 and ns = not significant.
Fig 2
Fig 2. Treg cell depletion increases T. cruzi-specific CD8+ T cell expansion and improves parasite control during acute infection.
A) Kinetics of blood parasite counts in PBS or DT-treated DEREG mice. B) Parasite load in heart, liver, and spleen of PBS or DT-treated DEREG mice at day 20 pi. Values were calculated using the ΔΔCT algorithm, with GAPDH utilized as a housekeeping control for normalization, and the sample of PBS-treated mice serving as a reference. C-E) Representative flow cytometry dot plots showing TSKB20-specific CD8+ T cell detection at day 20 pi (C), their frequency quantification in blood at different dpi (D), and in spleen and liver at day 20 pi (E) of PBS or DT-treated DEREG mice. F) Absolute numbers of TSKB20-specific CD8+ T cells in spleen and liver according to (E). All data are presented as mean ± SEM. In (A), (D), (E) and (F) data were collected from 1–3 independent experiments at most dpi, and 5–8 independent experiments at day 20 pi according to the analyzed tissue. In (B) data were pooled from 2–4 independent experiments. In (E-F) each symbol represents one individual mouse. A total of 4–42 mice per group were included. In (A) n = 11–12 at 8 dpi, n = 12 at 11 dpi, n = 11 at 14 dpi, n = 35–42 at 20 dpi, n = 7–9 at 25 dpi, n = 4–5 at 33 dpi. In (D) n = 12–13 at 10 dpi, n = 7 at 12 dpi, n = 16–18 at 20 dpi, n = 6 at 25 dpi, n = 12 at 33 dpi, n = 5–7 at 55 dpi. Statistical significance was determined by Unpaired t test or Mann Whitney test, according to data distribution. P values for pairwise comparisons are indicated in the graphs. * P ≤ 0.05, ** P ≤ 0.01, *** P ≤ 0.001, **** P ≤ 0.0001 and ns = not significant.
Fig 3
Fig 3. Early Treg cell depletion promotes parasite-specific CD8+ T cell differentiation into SLEC during T. cruzi infection.
A) Representative flow cytometry plots showing KLRG-1+ CD127- (SLEC) and KLRG-1- CD127+ (MPEC) subsets within CD44+ gated TSKB20-specific CD8+ T cells in the indicated organs obtained from PBS or DT-treated DEREG mice at day 20 pi. B-C) Frequencies (left) and absolute numbers (right) of SLEC (B) and MPEC (C) subsets within CD44+ gated TSKB20-specific CD8+ T cells of mice in (A). Data were collected from 2 independent experiments. D) Percentages of CD8+ T cells that produce IFN-γ and exhibit CD107a mobilization together (left) or not (right) with TNF production in the spleen of PBS or DT-treated DEREG mice at day 21 pi. Medium condition was used as a negative control, while PMA/Ionomycin (PMA/Iono) was used as a positive control for polyclonal CD8+ T cell stimulation. Similar results were obtained in 2 independent experiments. All data are presented as mean ± SEM. In (B), (C) and (D) each symbol represents one individual mouse. Statistical significance was determined by Unpaired t test or Mann Whitney test, according to data distribution. P values for pairwise comparisons are indicated in the graphs.
Fig 4
Fig 4. Treg cell depletion induces modest effects on APC populations and innate cells.
A) UMAP visualization of flow cytometry data from the spleen of PBS or DT-treated DEREG mice at day 7 pi and PBS-treated non-infected controls. B) Histograms showing the expression of different APC and innate cell activation markers in selected cell clusters. Samples from the three experimental groups (NI PBS, INF PBS and INF DT) were pooled together. C) Representative flow cytometry plots showing CD86+ cells in the indicated cell clusters as defined in (A). D) Frequency of CD86+ cells in the indicated cell clusters as defined in (A). Data are presented as mean ± SEM. Each symbol represents one individual mouse. Statistical significance was determined by one-way ANOVA followed by Tukey’s multiple comparison test. Similar results were obtained in 3 independent experiments. * P ≤ 0.05, *** P ≤ 0.001.
Fig 5
Fig 5. Treg cell depletion promotes the expansion and activation of Tconv cells in T. cruzi target organs.
A-B) Frequencies (A) and absolute numbers (B) of Tconv cells in blood, spleen, and liver from PBS or DT-treated DEREG mice at day 11 pi. C-D) Representative flow cytometry plots (C) and frequency (D) of CD44- CD62L+ (naïve), CD44+ CD62L+ (memory) and CD44+ CD62L- (effector) Tconv cell subsets in the spleen and liver from mice in (A). E-F) Representative flow cytometry plots (E) and frequency (F) of KLRG-1+ and CD25+ Tconv cells in the spleen from mice in (A). All data are presented as mean ± SEM. Each symbol represents one individual mouse. Data in (A), (B), (D) and (F) were pooled from 1–2 independent experiments. Statistical significance was determined by Unpaired t test or Mann Whitney test, according to data distribution. P values for pairwise comparisons are indicated in the graphs. In (D), P values PBS vs DT: + P≤ 0.05 and +++ P ≤ 0.001, naïve Tconv cells; # P<0.05, memory Tconv cells; ** P ≤ 0.01, effector T conv cells.
Fig 6
Fig 6. CD39 is early upregulated during T. cruzi infection and regulates TSKB20-specific CD8+ T cell responses.
A-C) Representative flow cytometry plots (A), frequency (B) and absolute numbers (C) of Treg cells expressing CD25, CTLA-4 and CD39 in the spleen of DEREG mice at day 7 pi (INF) and non-infected controls (NI). Data were collected from 2–3 independent experiments. D-F) Parasite blood counts (D), and frequency of TSKB20+ CD8+ T cells in the blood (E) and spleen (F) of WT and CD39 KO INF mice at different dpi (D, E) and at day 18 pi (F). G-H) Concentration of ATP and Adenosine (ADO) quantified in the plasma of WT and CD39 KO, NI and INF (18 dpi) mice (G), or in the plasma of NI, PBS or DT-treated INF (20 dpi) mice (H). Data in (D-H) were collected from 1 experiment. All data are presented as mean ± SEM. In (B-C), and (F-H) each symbol represents one individual mouse. Statistical significance was determined by Unpaired t test or Mann Whitney test in (B-F), by Kruskal-Wallis test followed by Dunn’s multiple comparisons test in (G) and by one-way ANOVA followed by Tukey’s multiple comparisons test in (H). Values for pairwise comparisons are indicated in the graphs. ns = not significant.
Fig 7
Fig 7. CD39 expression on Treg cells mediates TSKB20-specific CD8+ T cell suppression and parasite outgrowth.
A) Overview of iTreg cell adoptive transfer experimental design (created with BioRender.com). B-C) Representative flow cytometry plots (B) and frequency and absolute numbers (C) of TSKB20+ CD8+ T cells in the spleen and liver of mice treated and analyzed as indicated in (A). D) Frequencies and absolute numbers of the SLEC subset within CD44+ gated TSKB20-specific CD8+ T cells from mice treated as indicated in (A). E-F) Parasite counts in blood (E) and parasite load in the spleen and liver (F) from mice treated as indicated in (A). Results similar to (C-F) were obtained in 2 independent experiments. All data are presented as mean ± SEM. In (C-E) each symbol represents one individual mouse. Statistical significance was determined by one-way ANOVA followed by Tukey’s multiple comparisons test in (C-E), and by paired t test in (F). Values for pairwise comparisons are indicated in the graphs.

Update of

Similar articles

Cited by

References

    1. Pérez-Molina JA, Molina I. Chagas disease. The Lancet. 2018;391: 82–94. doi: 10.1016/S0140-6736(17)31612-4 - DOI - PubMed
    1. Acevedo GR, Girard MC, Gómez KA. The Unsolved Jigsaw Puzzle of the Immune Response in Chagas Disease. Frontiers in Immunology. 2018;9: 1929. doi: 10.3389/fimmu.2018.01929 - DOI - PMC - PubMed
    1. Rosenberg CS, Martin DL, Tarleton RL. CD8+ T Cells Specific for Immunodominant Trans-Sialidase Epitopes Contribute to Control of Trypanosoma cruzi Infection but Are Not Required for Resistance. The Journal of Immunology. 2010;185: 560–568. doi: 10.4049/jimmunol.1000432 - DOI - PMC - PubMed
    1. Rosenberg CS, Zhang W, Bustamante JM, Tarleton RL. Long-Term Immunity to Trypanosoma cruzi in the Absence of Immunodominant trans-Sialidase-Specific CD8+ T Cells. Infection and Immunity. 2016;84: 2627–2638. doi: 10.1128/IAI.00241-16 - DOI - PMC - PubMed
    1. Padilla A, Xu D, Martin D, Tarleton R. Limited Role for CD4+ T-Cell Help in the Initial Priming of Trypanosoma cruzi-Specific CD8+ T Cells. Infection and Immunity. 2007;75: 231–235. doi: 10.1128/IAI.01245-06 - DOI - PMC - PubMed

Publication types