

Deep mutational scanning of Pneumocystis jirovecii dihydrofolate reductase reveals allosteric mechanism of resistance to an antifolate
- PMID: 38683847
- PMCID: PMC11125491
- DOI: 10.1371/journal.pgen.1011252
Deep mutational scanning of Pneumocystis jirovecii dihydrofolate reductase reveals allosteric mechanism of resistance to an antifolate
Abstract
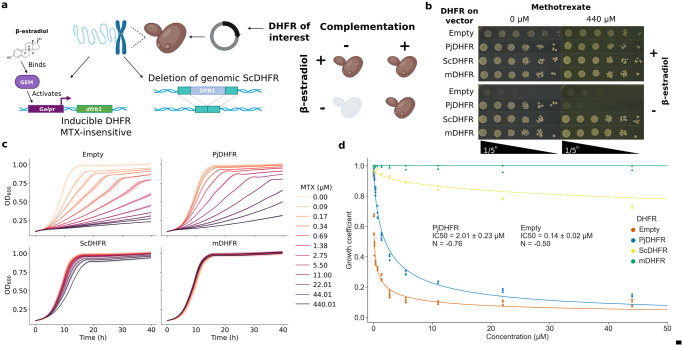
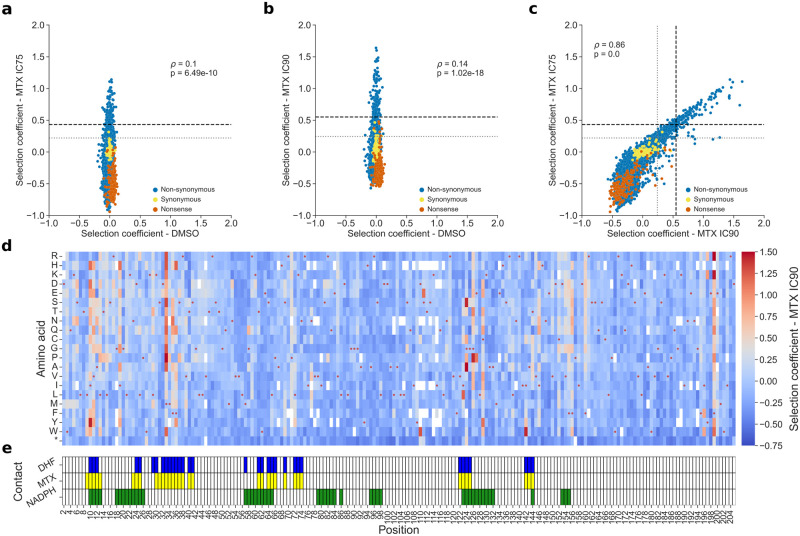
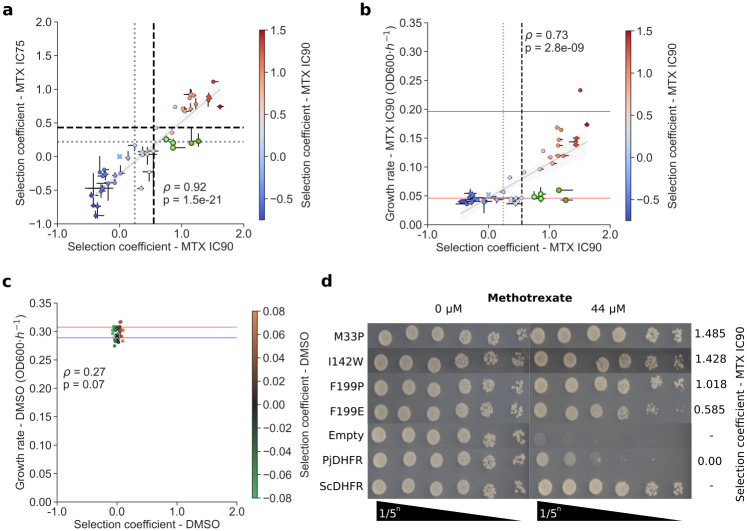
Pneumocystis jirovecii is a fungal pathogen that causes pneumocystis pneumonia, a disease that mainly affects immunocompromised individuals. This fungus has historically been hard to study because of our inability to grow it in vitro. One of the main drug targets in P. jirovecii is its dihydrofolate reductase (PjDHFR). Here, by using functional complementation of the baker's yeast ortholog, we show that PjDHFR can be inhibited by the antifolate methotrexate in a dose-dependent manner. Using deep mutational scanning of PjDHFR, we identify mutations conferring resistance to methotrexate. Thirty-one sites spanning the protein have at least one mutation that leads to resistance, for a total of 355 high-confidence resistance mutations. Most resistance-inducing mutations are found inside the active site, and many are structurally equivalent to mutations known to lead to resistance to different antifolates in other organisms. Some sites show specific resistance mutations, where only a single substitution confers resistance, whereas others are more permissive, as several substitutions at these sites confer resistance. Surprisingly, one of the permissive sites (F199) is without direct contact to either ligand or cofactor, suggesting that it acts through an allosteric mechanism. Modeling changes in binding energy between F199 mutants and drug shows that most mutations destabilize interactions between the protein and the drug. This evidence points towards a more important role of this position in resistance than previously estimated and highlights potential unknown allosteric mechanisms of resistance to antifolate in DHFRs. Our results offer unprecedented resources for the interpretation of mutation effects in the main drug target of an uncultivable fungal pathogen.
Copyright: © 2024 Rouleau et al. This is an open access article distributed under the terms of the Creative Commons Attribution License, which permits unrestricted use, distribution, and reproduction in any medium, provided the original author and source are credited.
Conflict of interest statement
The authors have declared that no competing interests exist.
Figures

Similar articles
-
Kinetic and structural analysis for potent antifolate inhibition of Pneumocystis jirovecii, Pneumocystis carinii, and human dihydrofolate reductases and their active-site variants.Antimicrob Agents Chemother. 2013 Jun;57(6):2669-77. doi: 10.1128/AAC.00172-13. Epub 2013 Apr 1. Antimicrob Agents Chemother. 2013. PMID: 23545530 Free PMC article.
-
Correlations of inhibitor kinetics for Pneumocystis jirovecii and human dihydrofolate reductase with structural data for human active site mutant enzyme complexes.Biochemistry. 2009 Mar 3;48(8):1702-11. doi: 10.1021/bi801960h. Biochemistry. 2009. PMID: 19196009 Free PMC article.
-
Structure-activity correlations for three pyrido[2,3-d]pyrimidine antifolates binding to human and Pneumocystis carinii dihydrofolate reductase.Acta Crystallogr F Struct Biol Commun. 2015 Jun;71(Pt 6):799-803. doi: 10.1107/S2053230X15008468. Epub 2015 May 27. Acta Crystallogr F Struct Biol Commun. 2015. PMID: 26057816 Free PMC article.
-
Mutational 'hot-spots' in mammalian, bacterial and protozoal dihydrofolate reductases associated with antifolate resistance: sequence and structural comparison.Drug Resist Updat. 2009 Feb-Apr;12(1-2):28-41. doi: 10.1016/j.drup.2009.02.001. Epub 2009 Mar 9. Drug Resist Updat. 2009. PMID: 19272832 Review.
-
Towards species-specific antifolates.Curr Med Chem. 2006;13(4):377-98. doi: 10.2174/092986706775527938. Curr Med Chem. 2006. PMID: 16475929 Review.
Cited by
-
Unlocking the potential of experimental evolution to study drug resistance in pathogenic fungi.NPJ Antimicrob Resist. 2024 Dec 12;2(1):48. doi: 10.1038/s44259-024-00064-1. NPJ Antimicrob Resist. 2024. PMID: 39843963 Free PMC article. Review.
-
New approaches to tackle a rising problem: Large-scale methods to study antifungal resistance.PLoS Pathog. 2024 Sep 5;20(9):e1012478. doi: 10.1371/journal.ppat.1012478. eCollection 2024 Sep. PLoS Pathog. 2024. PMID: 39236046 Free PMC article. Review. No abstract available.
-
Strategies and efforts in circumventing the emergence of antiviral resistance against conventional antivirals.NPJ Antimicrob Resist. 2025 Jun 9;3(1):54. doi: 10.1038/s44259-025-00125-z. NPJ Antimicrob Resist. 2025. PMID: 40490516 Free PMC article. Review.
-
Most azole resistance mutations in the Candida albicans drug target confer cross-resistance without intrinsic fitness cost.Nat Microbiol. 2024 Nov;9(11):3025-3040. doi: 10.1038/s41564-024-01819-2. Epub 2024 Oct 8. Nat Microbiol. 2024. PMID: 39379635
References
-
- Futterman S. Enzymatic reduction of folic acid and dihydrofolic acid to tetrahydrofolic acid. J Biol Chem. 1957;228: 1031–1038. - PubMed
MeSH terms
Substances
LinkOut - more resources
Full Text Sources
