. 2024 Apr 29;22(4):e3002586.
doi: 10.1371/journal.pbio.3002586. eCollection 2024 Apr.

Developmental fine-tuning of medial superior olive neurons mitigates their predisposition to contralateral sound sources

Affiliations

Developmental fine-tuning of medial superior olive neurons mitigates their predisposition to contralateral sound sources

Martijn C Sierksma et al. PLoS Biol. .

Abstract

Having two ears enables us to localize sound sources by exploiting interaural time differences (ITDs) in sound arrival. Principal neurons of the medial superior olive (MSO) are sensitive to ITD, and each MSO neuron responds optimally to a best ITD (bITD). In many cells, especially those tuned to low sound frequencies, these bITDs correspond to ITDs for which the contralateral ear leads, and are often larger than the ecologically relevant range, defined by the ratio of the interaural distance and the speed of sound. Using in vivo recordings in gerbils, we found that shortly after hearing onset the bITDs were even more contralaterally leading than found in adult gerbils, and travel latencies for contralateral sound-evoked activity clearly exceeded those for ipsilateral sounds. During the following weeks, both these latencies and their interaural difference decreased. A computational model indicated that spike timing-dependent plasticity can underlie this fine-tuning. Our results suggest that MSO neurons start out with a strong predisposition toward contralateral sounds due to their longer neural travel latencies, but that, especially in high-frequency neurons, this predisposition is subsequently mitigated by differential developmental fine-tuning of the travel latencies.


Conflict of interest statement

The authors have declared that no competing interests exist.

Figures

Fig 1
Fig 1. In vivo recordings from juvenile MSO neurons.
(A) Schematic drawing of the auditory brainstem. The MSO is located in the ventral brainstem close to the midline. MSO neurons receive excitatory input from the spherical bushy cells located in the AVCN from both sides, as well as inhibitory input from the ipsilateral medial and lateral nucleus of the trapezoid body (MNTB and LNTB, resp.). The recording pipette approached the MSO from the ventrolateral side and moves mediodorsally with depth (green arrow). (B) Avg. field potentials evoked by clicks at either ear at different penetration depths. Onset of the contralateral and ipsilateral click is indicated by the orange and blue line, respectively. Notice how the ipsilateral field potential reverses from negative to positive more superficially than the depth at which the contralateral field potential reverses from positive to negative [10]. At the place where both field potentials are positive-going, spiking neurons are typically encountered. Scale bars: 1 mV, 10 ms. (C) Biocytin labeling (white) of a principal neuron in the somatic layer of the MSO. Excitatory synapses are labeled by VGluT1 (magenta) and inhibitory synapses by GlyT2 (green). The labeling confirms that the reversal of the field potentials occurred at the somatic layer of the MSO in juvenile gerbils. (D) Clicks were presented at both ears at different ITDs. Single-trial responses of a P15 MSO neuron are shown for ITDs from −2 (bottom) to +2 ms (top). (E) Spike-raster plot of the same neuron as in D for multiple presentations where time is indicated relative to the onset of the contralateral click. Median latency to monaural clicks is shown as a solid line (blue: ipsilateral, orange: contralateral). (F) Facilitated spiking probability for juvenile MSO neurons during binaural stimulation. Cumulative distribution of spike probabilities to ipsilateral (“ipsi”), contralateral (“contra”), and binaural (“bin”) click stimuli. Predicted binaural spike probability (“pred-bin”) was calculated as 1−(1−Pipsi)(1−Pcontra) for each cell. (G) Cumulative distribution of time shift of binaural response compared to monaural responses, showing decreased latencies for the first spike response during binaural stimulation for juvenile MSO neurons. The data underlying this figure is available at https://doi.org/10.5281/zenodo.10729468. AVCN, anteroventral cochlear nucleus; ITD, interaural time difference; LNTB, lateral nucleus of the trapezoid body; MNTB, medial nucleus of the trapezoid body; MSO, medial superior olive.
Fig 2
Fig 2. Best ITDs of MSO neurons shift to the ecological ITD range during development.
(A) Examples of MSO responses at ITD = +0.1 ms at 4 different postnatal ages. APs are colored blue. Example APs are shown at the right of each trace. Gray bar on top indicates period of sound presentation. (B) Average spike rates (open circles) versus ITD for the examples shown in (A). Spike rates were fitted (solid line). Yellow box indicates the ecological ITD range. (C) Developmental changes in the bITD. Age groups are indicated as postnatal days or as adult. Yellow box depicts putative ecological range. Small circles denote individual neurons. Large circles indicate averages with SD. (D) Fraction of bITDs inside the ecological range against age. ***F6,136 = 10.02, p = 4 10−9, P18-19, Bonferroni-corrected p = 1.7 10−6, P20-21, Bonferroni-corrected p = 3.1 10−8. The data underlying this figure is available at https://doi.org/10.5281/zenodo.10729468. bITD, best interaural time difference; ITD, interaural time difference; MSO, medial superior olive.
Fig 3
Fig 3. Monaural travel latencies predict bITDs of juvenile MSO neurons.
(A) FSL to ipsi- and contralateral clicks. Dashed line indicates identity line. (B) Relation between FSL and gerbil age (in postnatal days or adult). Contralateral and ipsilateral FSLs are colored orange and blue, respectively, and latencies from the same cell are connected by a line. (C) Developmental changes in the difference in first spike latency (ΔFSL = contralateral FSL–ipsilateral FSL). Age groups are indicated in postnatal days or as adult. Yellow box depicts ecological range for ITDs. Smaller circles correspond to individual neurons. Averages and SD are shown. F6,72 = 8.5, p = 5.9 10−7, * P15-17, p = 0.0036, *** P18-19, p = 1.5 10−6, * P20-21, p = 0.0012. (D) Relation between difference in FSL and bITD. Value pairs come from the same MSO cell. Dashed line indicates identity line. Pearson’s r = 0.7. (E) From left to right, a P16, P19, P25, an adult example and the overlay of the extracellular potential preceding the eAP aligned on the eAP peak. Individual traces are shown in gray. The trace with the median eEPSP-AP is overlaid in color. Scale bars: 0.5 mV, 0.5 ms. The median eEPSP-AP were normalized to AP peak-to-peak amplitude for comparison and are shown with a vertical offset for visual clarity. The eEPSP-AP latency is indicated by a horizontal line below the examples. Scale bar (above the examples): 0.5 ms. (F) eEPSP-AP latency against age groups (left) and monaural eEPSP-AP latency against age groups (right). Value pairs from the same cell are connected by a line. ***Welch’s t24 = 5.5, p = 1.1 10−5. (G) Best ITD (bITD) against the difference in eEPSP-AP latencies evoked by contra- and ipsilateral stimulation (r = 0.7). MSO neurons from juvenile and adult animals are shown as open and closed circles, respectively. Dashed line indicates identity line. The data underlying this figure is available at https://doi.org/10.5281/zenodo.10729468. bITD, best interaural time difference; FSL, first-spike latency; ITD, interaural time difference; MSO, medial superior olive.
Fig 4
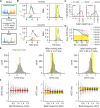
Fig 4. Spike timing-dependent plasticity can gradually and partially compensate for a latency bias.
(A) The model neuron receives 2 populations of inputs with different latencies. The input latency is determined by a frequency-dependent latency and a side-specific latency. Each input starts with the same synaptic weight. The synaptic weights are adjusted based on synaptic activation relative to postsynaptic firing. The activation pattern depends on ITDs. After a number of training rounds, synaptic weights are different from the starting values, leading to a change in the ITD tuning response of the model neuron. (B) Development of bITDs of model neurons with a best frequency of 1.8 or 0.6 kHz. For each best frequency, the left panel shows the simulated membrane potential (normalized scaling) at ITD = 0 ms (green-to-black traces) and the input latencies (bottom, raster, orange = contralateral, blue = ipsilateral). During the training process, the synaptic weights are adjusted, and therefore the membrane potential changes (green: start, black: learning outcome). The right panel shows the ITD-rate curve during the learning process (from green to black: after 1, 200, 400, 600, 800, and 1,000 updates). Best ITDs are indicated by a plus. On the top of the graph, the initial (green) versus outcome bITDs (black) are indicated. Each example was trained with ITDs of 0 ± 0.13 ms, indicated by the yellow area. (C) Weights of ipsilateral (left) and contralateral (right) inputs after the learning process for model neurons with a best frequency of 1.6, 1.0 or 0.4 kHz, and 500 neurons per best frequency were trained for 1,000 updates. Vertical dotted line indicates the weight at the start, which was equal for all inputs. Zero weights (or eliminated inputs) are shown separately as a bar. (D) Average bITD against the number of updates for different best frequencies. Neurons with lower best frequencies need more updates to adjust their bITDs to the training ITDs (0 ± 0.13 ms, yellow area). We simulated 500 neurons for each frequency group. We used 1,000 updates (indicated by dashed line) for the other simulations. (E) Histogram of bITDs before (left) and after training with ITDs in the range of 0 ± 0.13 ms (middle; yellow area), similar to the ecological range of adult gerbils, and after training with ITDs in the range of 0.6 ± 0.13 ms (right). With ITDs of 0.6 ± 0.13 ms contralateral instead of ipsilateral inputs are leading by 0.3 ms. Total number of neurons is 2,400 neurons per graph. (F) Best ITD against best frequency before (left) and after training with ITDs in the range of 0 ± 0.13 ms (middle) or ITDs in the range of 0.6 ± 0.13 ms (right). The mean bITD is indicated by the red, solid lines. The training ITDs are indicated by the yellow area. The initial difference in latencies is indicated by the red, dashed line. The code to generate this figure is available at https://doi.org/10.5281/zenodo.10729468. bITD, best interaural time difference; ITD, interaural time difference.

Similar articles

References

    1. Maki K, Furukawa S. Acoustical cues for sound localization by the Mongolian gerbil, Meriones unguiculatus. J Acoust Soc Am. 2005;118(2):872–86. Epub 2005/09/15. doi: 10.1121/1.1944647 . - DOI - PubMed
    1. Maier JK, Klump GM. Resolution in azimuth sound localization in the Mongolian gerbil (Meriones unguiculatus). J Acoust Soc Am. 2006;119(2):1029–36. Epub 2006/03/09. doi: 10.1121/1.2159429 . - DOI - PubMed
    1. Tolnai S, Beutelmann R, Klump GM. Exploring binaural hearing in gerbils (Meriones unguiculatus) using virtual headphones. PLoS ONE. 2017;12(4):e0175142. Epub 2017/04/11. doi: 10.1371/journal.pone.0175142 ; PubMed Central PMCID: PMC5386270. - DOI - PMC - PubMed
    1. Tolnai S, Beutelmann R, Klump GM. Interaction of interaural cues and their contribution to the lateralisation of Mongolian gerbils (Meriones unguiculatus). J Comp Physiol A. 2018;204(5):435–448. doi: 10.1007/s00359-018-1253-5 - DOI - PubMed
    1. Rautenberg PL, Grothe B, Felmy F. Quantification of the three-dimensional morphology of coincidence detector neurons in the medial superior olive of gerbils during late postnatal development. J Comp Neurol. 2009;517(3):385–396. doi: 10.1002/cne.22166 . - DOI - PubMed

Publication types