

Bayesian workflow for time-varying transmission in stratified compartmental infectious disease transmission models
- PMID: 38683878
- PMCID: PMC11081492
- DOI: 10.1371/journal.pcbi.1011575
Bayesian workflow for time-varying transmission in stratified compartmental infectious disease transmission models
Abstract
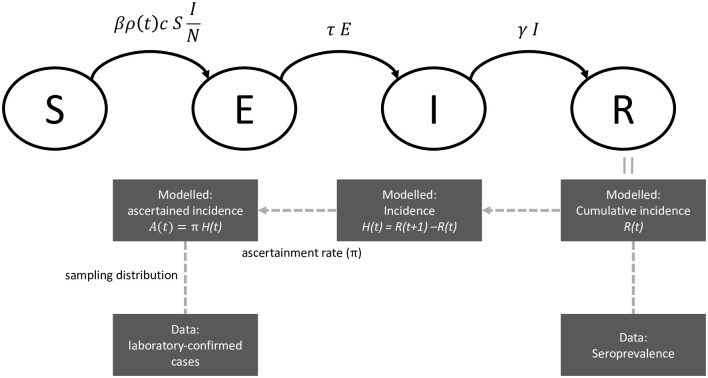
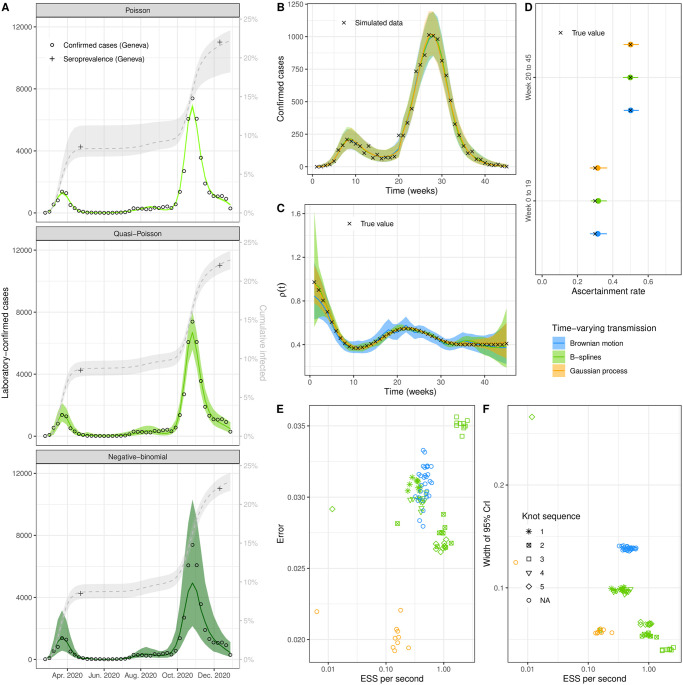
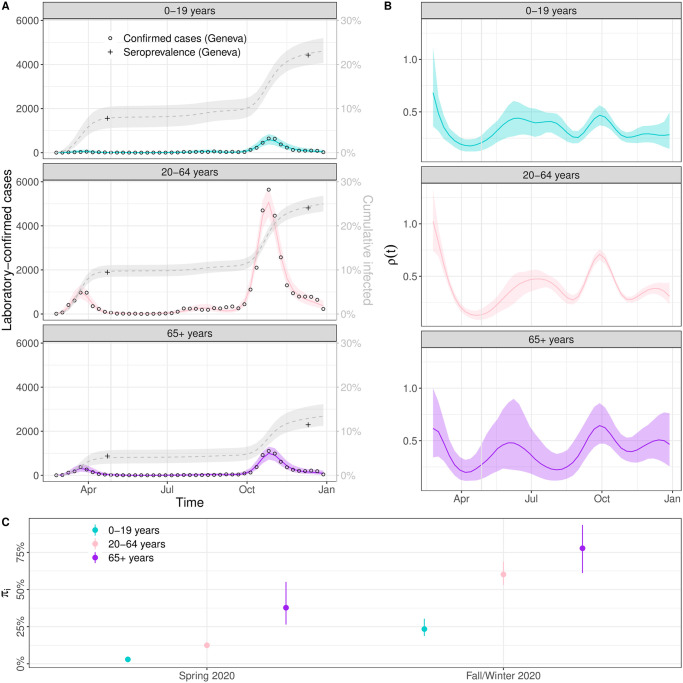
Compartmental models that describe infectious disease transmission across subpopulations are central for assessing the impact of non-pharmaceutical interventions, behavioral changes and seasonal effects on the spread of respiratory infections. We present a Bayesian workflow for such models, including four features: (1) an adjustment for incomplete case ascertainment, (2) an adequate sampling distribution of laboratory-confirmed cases, (3) a flexible, time-varying transmission rate, and (4) a stratification by age group. Within the workflow, we benchmarked the performance of various implementations of two of these features (2 and 3). For the second feature, we used SARS-CoV-2 data from the canton of Geneva (Switzerland) and found that a quasi-Poisson distribution is the most suitable sampling distribution for describing the overdispersion in the observed laboratory-confirmed cases. For the third feature, we implemented three methods: Brownian motion, B-splines, and approximate Gaussian processes (aGP). We compared their performance in terms of the number of effective samples per second, and the error and sharpness in estimating the time-varying transmission rate over a selection of ordinary differential equation solvers and tuning parameters, using simulated seroprevalence and laboratory-confirmed case data. Even though all methods could recover the time-varying dynamics in the transmission rate accurately, we found that B-splines perform up to four and ten times faster than Brownian motion and aGPs, respectively. We validated the B-spline model with simulated age-stratified data. We applied this model to 2020 laboratory-confirmed SARS-CoV-2 cases and two seroprevalence studies from the canton of Geneva. This resulted in detailed estimates of the transmission rate over time and the case ascertainment. Our results illustrate the potential of the presented workflow including stratified transmission to estimate age-specific epidemiological parameters. The workflow is freely available in the R package HETTMO, and can be easily adapted and applied to other infectious diseases.
Copyright: © 2024 Bouman et al. This is an open access article distributed under the terms of the Creative Commons Attribution License, which permits unrestricted use, distribution, and reproduction in any medium, provided the original author and source are credited.
Conflict of interest statement
The authors have declared that no competing interests exist.
Figures
Similar articles
-
Estimating Re and overdispersion in secondary cases from the size of identical sequence clusters of SARS-CoV-2.PLoS Comput Biol. 2025 Apr 15;21(4):e1012960. doi: 10.1371/journal.pcbi.1012960. eCollection 2025 Apr. PLoS Comput Biol. 2025. PMID: 40233303 Free PMC article.
-
Bayesian workflow for disease transmission modeling in Stan.Stat Med. 2021 Nov 30;40(27):6209-6234. doi: 10.1002/sim.9164. Epub 2021 Sep 8. Stat Med. 2021. PMID: 34494686 Free PMC article.
-
A modeling framework for the analysis of the SARS-CoV2 transmission dynamics.Stat Med. 2024 Oct 15;43(23):4542-4558. doi: 10.1002/sim.10195. Epub 2024 Aug 9. Stat Med. 2024. PMID: 39119805
-
Universal screening for SARS-CoV-2 infection: a rapid review.Cochrane Database Syst Rev. 2020 Sep 15;9(9):CD013718. doi: 10.1002/14651858.CD013718. Cochrane Database Syst Rev. 2020. PMID: 33502003 Free PMC article.
-
Usage of Compartmental Models in Predicting COVID-19 Outbreaks.AAPS J. 2022 Sep 2;24(5):98. doi: 10.1208/s12248-022-00743-9. AAPS J. 2022. PMID: 36056223 Free PMC article. Review.
Cited by
-
Synthetic method of analogues for emerging infectious disease forecasting.PLoS Comput Biol. 2025 Jun 23;21(6):e1013203. doi: 10.1371/journal.pcbi.1013203. eCollection 2025 Jun. PLoS Comput Biol. 2025. PMID: 40549797 Free PMC article.
-
Artificial intelligence for modelling infectious disease epidemics.Nature. 2025 Feb;638(8051):623-635. doi: 10.1038/s41586-024-08564-w. Epub 2025 Feb 19. Nature. 2025. PMID: 39972226 Review.
References
-
- Kermack WO, McKendrick AG. A contribution to the mathematical theory of epidemics. Proceedings of the royal society of london Series A, Containing papers of a mathematical and physical character. 1927;115(772):700–721.
Publication types
MeSH terms
LinkOut - more resources
Full Text Sources
Medical
Miscellaneous
