Clinical Trial
. 2024 Sep 5;144(10):1069-1082.
doi: 10.1182/blood.2024024105.

HA-1-targeted T-cell receptor T-cell therapy for recurrent leukemia after hematopoietic stem cell transplantation

Affiliations
Clinical Trial

HA-1-targeted T-cell receptor T-cell therapy for recurrent leukemia after hematopoietic stem cell transplantation

Elizabeth F Krakow et al. Blood. .

Abstract

Relapse is the leading cause of death after allogeneic hematopoietic stem cell transplantation (HCT) for leukemia. T cells engineered by gene transfer to express T cell receptors (TCR; TCR-T) specific for hematopoietic-restricted minor histocompatibility (H) antigens may provide a potent selective antileukemic effect post-HCT. We conducted a phase 1 clinical trial using a novel TCR-T product targeting the minor H antigen, HA-1, to treat or consolidate treatment of persistent or recurrent leukemia and myeloid neoplasms. The primary objective was to evaluate the feasibility and safety of administration of HA-1 TCR-T after HCT. CD8+ and CD4+ T cells expressing the HA-1 TCR and a CD8 coreceptor were successfully manufactured from HA-1-disparate HCT donors. One or more infusions of HA-1 TCR-T following lymphodepleting chemotherapy were administered to 9 HCT recipients who had developed disease recurrence after HCT. TCR-T cells expanded and persisted in vivo after adoptive transfer. No dose-limiting toxicities occurred. Although the study was not designed to assess efficacy, 4 patients achieved or maintained complete remissions following lymphodepletion and HA-1 TCR-T, with 1 patient still in remission at >2 years. Single-cell RNA sequencing of relapsing/progressive leukemia after TCR-T therapy identified upregulated molecules associated with T-cell dysfunction or cancer cell survival. HA-1 TCR-T therapy appears feasible and safe and shows preliminary signals of efficacy. This clinical trial was registered at ClinicalTrials.gov as #NCT03326921.


Conflict of interest statement

Conflict-of-interest disclosure: M. Bleakley and R.G.D. are coinventors on a patent describing HA-1 T-cell receptor therapy that was previously licensed to ElevateBio and has recently been licensed to PromiCell Therapeutics (TCRS SPECIFIC FOR MINOR H ANTIGEN HA-1 AND USES THEREOF; US 10,538,577 B2 Jan 21 2020; Inventors M. Bleakley, Robson Dossa, Daniel Sommermeyer). M. Bleakley received funding from HighPassBio, an ElevateBio portfolio company, and was a scientific advisory board member and had equity in HighPassBio. HighPassBio provided funding for the clinical trial on which E.F.K. was the principal investigator. At the time of the research, A.E.D. was an employee of ElevateBio Technologies and is currently an owner of stock in ElevateBio LLC. E.F.K. served on an advisory board for TScan Therapeutics. R.D.C. has received research funding from Amgen, Kite/Gilead, Incyte, Merck, Pfizer, Servier, and Vanda Pharmaceuticals; consultancy/honoraria from Amgen, Jazz, Kite/Gilead, and Pfizer; and membership on a board or advisory committee for Autolus and PeproMene Bio. The remaining authors declare no competing financial interests.

The current affiliation of R.G.D. is Arovella Therapeutics, Melbourne, VIC, Australia.

The current affiliation of M. Bar is Bristol-Myers Squibb, Summit, NJ.

Figures

None
Graphical abstract
Figure 1.
Figure 1.
Clinical trial and manufacturing outline. (A) Schematic of clinical trial donor collection, GMP manufacturing, and infusion process. The process entailed the following: (1) collecting HCT-donor peripheral blood mononuclear cells (PBMC) by apheresis; (2) removing CD45RA+ cells from PBMC to reduce the risk of GVHD associated with donor naïve T cells and to skew the product toward a central memory T-cell (TCM) phenotype to enhance in vivo persistence; (3) separating the T cells into predominantly CD4+ and CD8+ fractions to control the CD4:CD8 ratio in the cell product; (4) stimulating and transducing CD4+ and CD8+ T cells in parallel cultures; (5) sorting for T cells expressing the TCR and CD34 tag on a fluorescence-activated cell sorter; (6) expanding; (7) enriching transduced cells using CD34+ antibody–conjugated immunomagnetic beads and a magnetic column; and (8) evaluating the final product. Refer to supplemental Method online for additional details. (B) CONSORT diagram depicting patient enrollment and treatment. The reasons for not treating patients included the following: 2 patients declined treatment within a phase 1 trial, 1 patient’s unrelated donor was not available, 1 patient had graft rejection before relapse, and 1 patient was not treated because of administrative reasons.
Figure 2.
Figure 2.
Functional and phenotypic characterization of HA-1 TCR-infusion products. (A) Percentage of cells expressing the CD34 tag within the CD4 (light blue bars) and CD8 (dark blue bars) infusion products. Cell products 1.1, 1.2, and 1.3 are 3 separate products made for patient 1. (B) Degranulation of CD4 (light blue bars) and CD8 (dark blue bars) infusion products when cocultured with primary HA-1+ AML (effector:stimulator = 1:1) measured by CD107a flow cytometric assay. Absence of bars indicates that data were not available (eg, product 3, 3.3, 5 CD4). (C-D) Lysis of HA-1 peptide–pulsed (1nM) T2 cells (C) or primary HA-1+ AML (D) in 4-hour chromium release assay by CD4 (light blue bars) and CD8 (dark blue bars) cell infusion products (effector:target = 20:1). (E-F) Expression of T-cell differentiation markers (left), activation markers (middle), and activation/inhibition markers (right) in CD4 (n = 11) (E) and CD8 (n = 12) (F) infusion products. Horizontal line represents the median. Each color represents an individual patient. (G) Percentage of CD4 HA-1 TCR-T (in CD4 infusion products, n = 8) or CD8 TCR-T (in CD8 [n = 12] or CD4 infusion products [n = 8]) secreting interferon (IFN)γ (red), IL-2 (blue), tumor necrosis factor (TNF)α (green), individually (unfilled bars) or combinations of cytokines (filled bars) in response to HA-1 peptide–pulsed (1nM) T2 cells by intracellular cytokine staining. Error bars indicate standard error of the mean. Statistics determined by an unpaired t test (2-sided P value: ∗P <. 05, ∗∗P < .01; ∗∗∗P < .001).
Figure 3.
Figure 3.
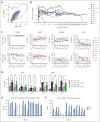
Persistence, phenotype, and function of TCR-T after infusion. (A) HA-1 TCR-T by MFC in a representative patient 18 days after infusion indicating CD34 tag and HA-1 TCR dextramer staining. (B) Peripheral blood CD3+CD34+ HA-1 TCR-T (cells per μL) over time across all patients (n = 9) at dose level (DL) 1 (purple), DL2 (blue), and DL3 (green). Note: Infusion 3.3 was delivered at the time of ∼80% BM blasts, and the massive and rapidly increasing tumor burden likely induced T-cell death. (C) TCR-T phenotype by MFC on gated CD34+ cells for CD4 and CD8 infusion products and recipient blood. (D) Activation/inhibition markers on gated CD34+ cells and bulk CD4+ and CD8+ T cells on days 11 (purple) and 18 (green) after infusion. Error bars show mean and standard deviation. Statistics determined by paired t test (2-sided P value ∗P < .05, ∗∗P < .01; ∗∗∗∗P < .0001). (E-F) Lysis in a chromium release assay of HA-1 peptide–pulsed (1nM) T2 cells (E) or HA-1+ primary AML (F) at an effector:target ratio of 20:1 by HA-1 TCR-T recovered from recipient blood after infusion. CD4 (light blue bars) and CD8 (dark blue bars) TCR-T were sorted from patient blood at approximately day 32 after infusion and expanded with anti-CD3 monoclonal antibody and IL-2 and sorted by MFC before the functional assay. The patient and infusion numbers are indicated by 1.1, 1.2, etc. Absence of a bar indicates that data were not available (eg, no CD8+ HA-1 TCR-T were successfully isolated and expanded from patient 3).
Figure 4.
Figure 4.
Patient clinical course. (A-D) Marrow blasts as percentage of white blood cells (WBC) (red lines, left y-axis) and absolute count of HA-1 TCR-T (blue lines, right y-axis) are shown for the 4 participants with treatment response. Vertical dashed lines denote HCT or infusion time points. The horizontal dashed line indicates limit of detection for HA-1 TCR-T (0.02 cells per μl). (A) Patient 3 received 2 escalating dose infusions (DL1, DL2), the first at the time of rapidly proliferating T-ALL, resulting in a 6-month remission. Concurrent with falling blood concentrations of TCR-T, he experienced relapse. A third DL infusion given in the context of overwhelming, chemorefractory marrow and extramedullary T-ALL had no effect. (B) Patient 9 had 38% AML in the marrow before receiving a single DL3 infusion, resulting in a complete remission of up to 12 weeks (CRi documented at 3 and 5 weeks, relapse at 12 weeks). (C) Patient 1 entered the trial in an MRD-negative state after serial salvage therapies. He received 1 TCR-T infusion (DL1, CD8 only) with no subsequent pharmacologic maintenance, sustained MRD-negative status through 3 months after infusion, with eventual MRD detection at month 6. He received a second (DL1) and third (DL2, not shown) infusion in the context of MRD, but did not regain MRD-negative CR. (D) Patient 8 had high-risk, TP53+ MDS. She received 1 infusion (DL3) after salvage with hypomethylating therapy and venetoclax and sustained MRD-negative remission following HA-1 TCR-T.
Figure 5.
Figure 5.
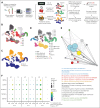
Single-cell RNA sequencing analysis of patient leukemia. (A) Schematic of single-cell RNA-sequencing experimental design and data processing pipeline. (B) Uniform manifold approximation and projection (UMAP) of combined patient data annotated by patient. (C) UMAP of combined patient data annotated by genotype, determined by the souporcell algorithm. (D) UMAP of combined patient data annotated by patient malignant cells and cell type, determined by (B-C) and viewmastR algorithm, respectively. (E) Network map of significantly enriched Gene Ontology (GO) Biological Processes 2021 pathways (P < .05) in genes upregulated (log2FC ≥ 0.25) in blasts after HA-1 TCR-T compared with before the treatment in all 3 patients with preinfusion and postinfusion samples. Bubble size corresponds to larger –log (average adjusted P value) for each pathway. Blue, neutrophil-related pathways; red, cell death/survival; yellow, cytokine signaling; green, metabolism; gray, other processes. (F) Bubble plots illustrate the expression patterns of 5 genes. These genes were identified from the significantly enriched pathways and had a greater log2 fold-change after the infusion in malignant cells compared with the change in nonmalignant cells (log2FC malignant ≥1.5× log2FC normal) in all 3 patients with pre- and post-HA-1 TCR-T samples. (E-F) Postinfusion sample time points: patient 4, day 29; patient 6, day 18; patient 9, day 90. viewmastR images in panel A are from https://github.com/furlan-lab/viewmastR/blob/main/man/figures/viewmaster.png.

Comment in

References

    1. Horowitz M, Schreiber H, Elder A, et al. Epidemiology and biology of relapse after stem cell transplantation. Bone Marrow Transplant. 2018;53(11):1379–1389. - PMC - PubMed
    1. Bejanyan N, Weisdorf DJ, Logan BR, et al. Survival of patients with acute myeloid leukemia relapsing after allogeneic hematopoietic cell transplantation: a center for international blood and marrow transplant research study. Biol Blood Marrow Transplant. 2015;21(3):454–459. - PMC - PubMed
    1. Chapuis AG, Egan DN, Bar M, et al. T cell receptor gene therapy targeting WT1 prevents acute myeloid leukemia relapse post-transplant. Nat Med. 2019;25(7):1064–1072. - PMC - PubMed
    1. Fiorenza S, Turtle CJ. CAR-T cell therapy for acute myeloid leukemia: preclinical rationale, current clinical progress, and barriers to success. BioDrugs. 2021;35(3):281–302. - PubMed
    1. Bleakley M, Riddell SR. Molecules and mechanisms of the graft-versus-leukaemia effect. Nat Rev Cancer. 2004;4(5):371–380. - PubMed

Publication types

Associated data

LinkOut - more resources