. 2024 May 7;121(19):e2318413121.
doi: 10.1073/pnas.2318413121. Epub 2024 Apr 29.

Incomplete-penetrant hypertrophic cardiomyopathy MYH7 G256E mutation causes hypercontractility and elevated mitochondrial respiration

Affiliations

Incomplete-penetrant hypertrophic cardiomyopathy MYH7 G256E mutation causes hypercontractility and elevated mitochondrial respiration

Soah Lee et al. Proc Natl Acad Sci U S A. .

Erratum in

Abstract

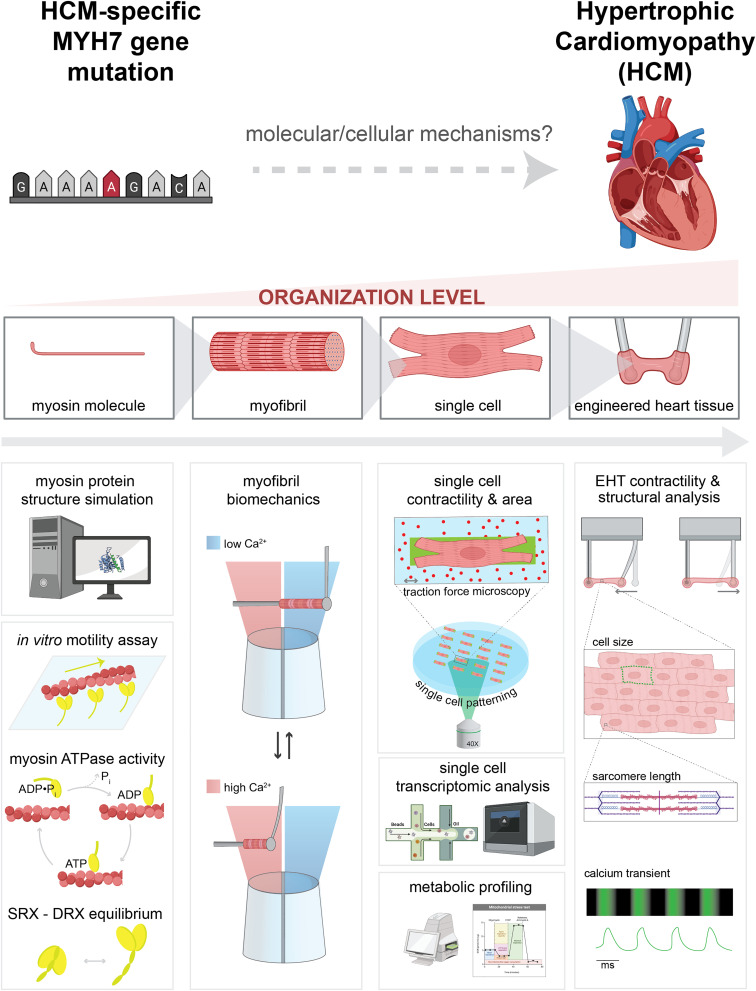
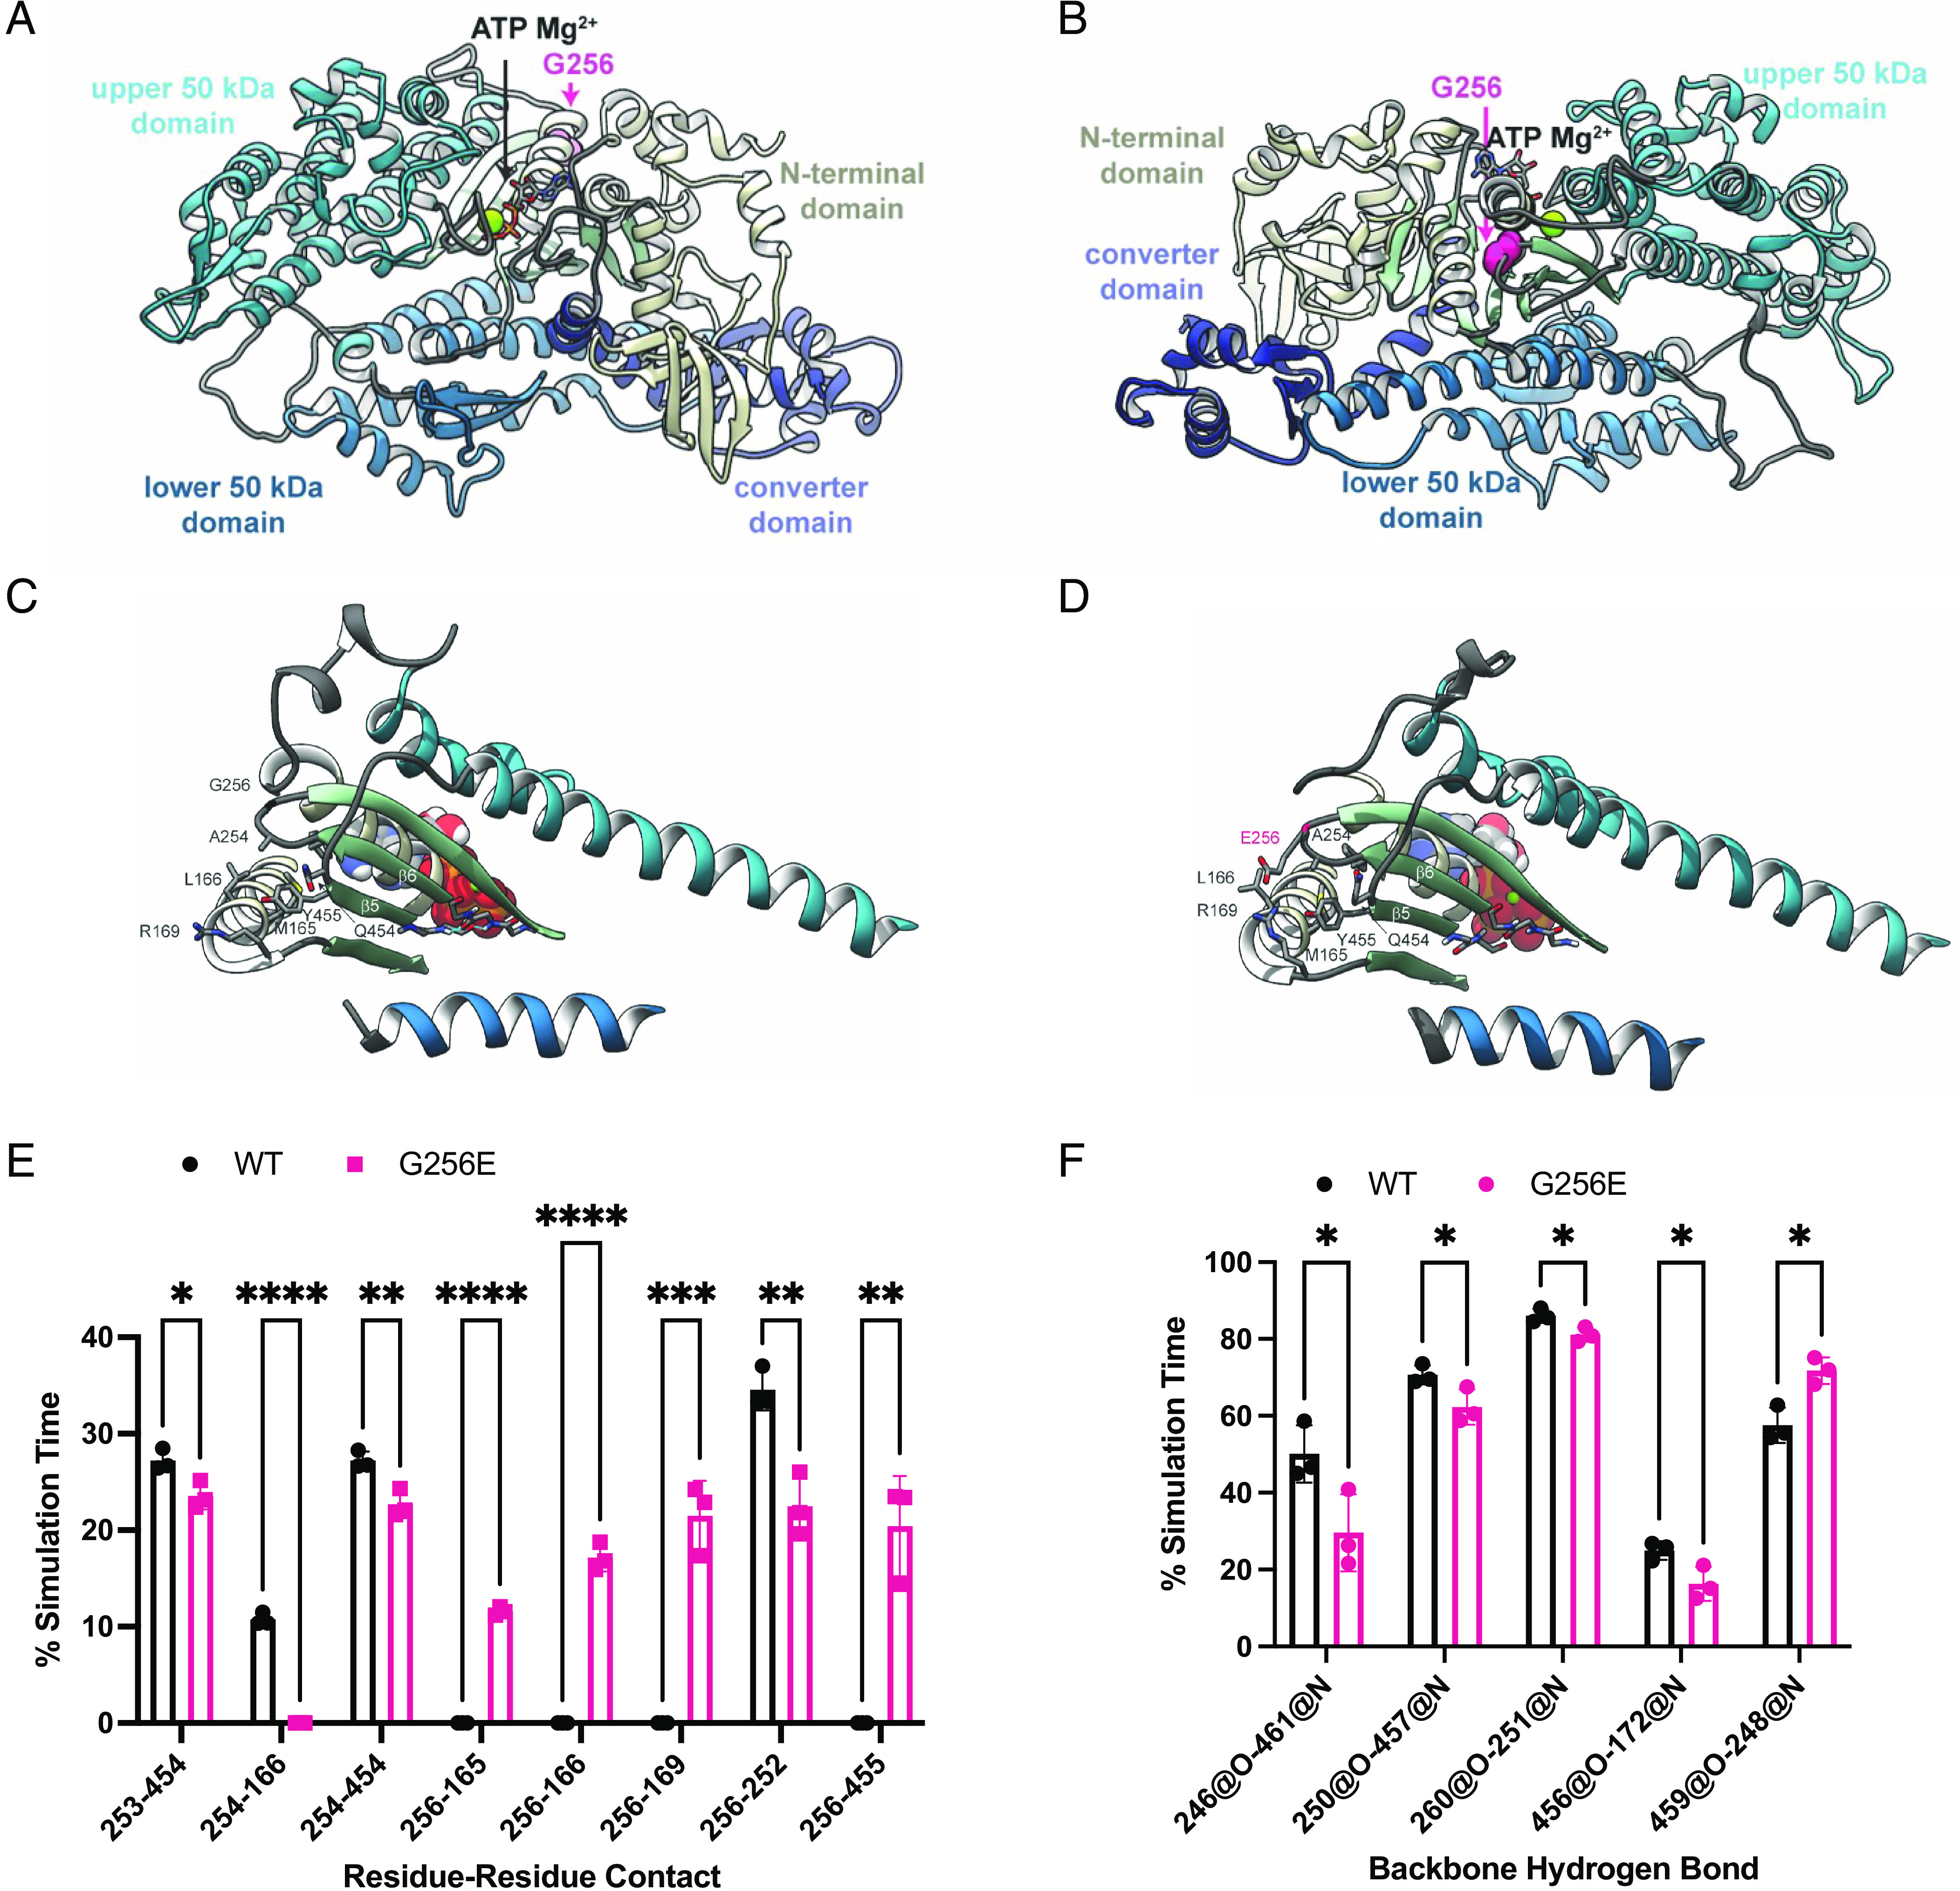
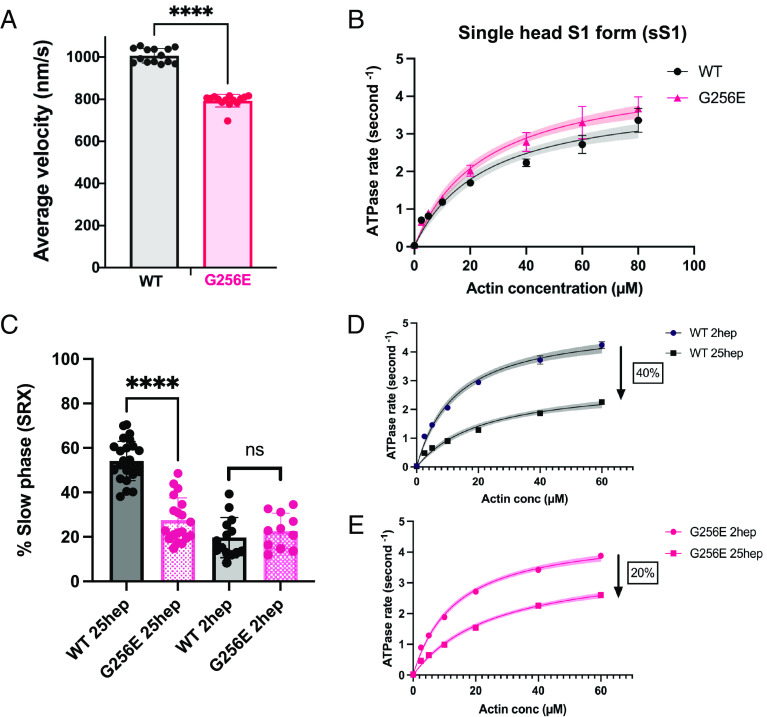
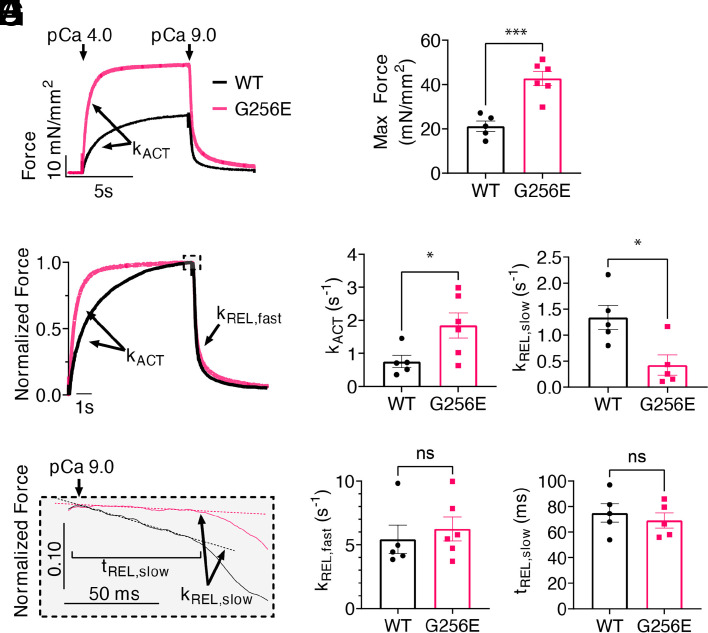
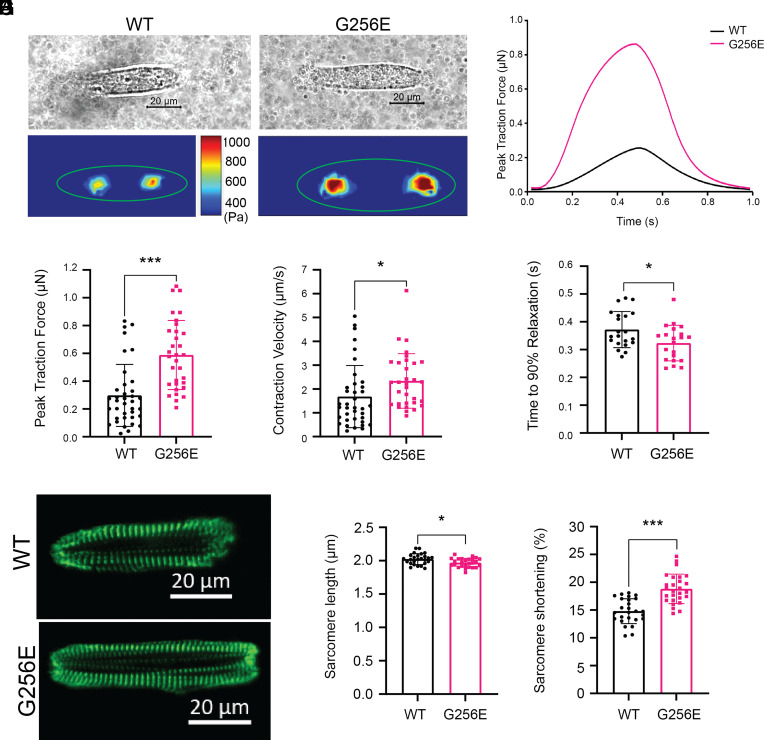
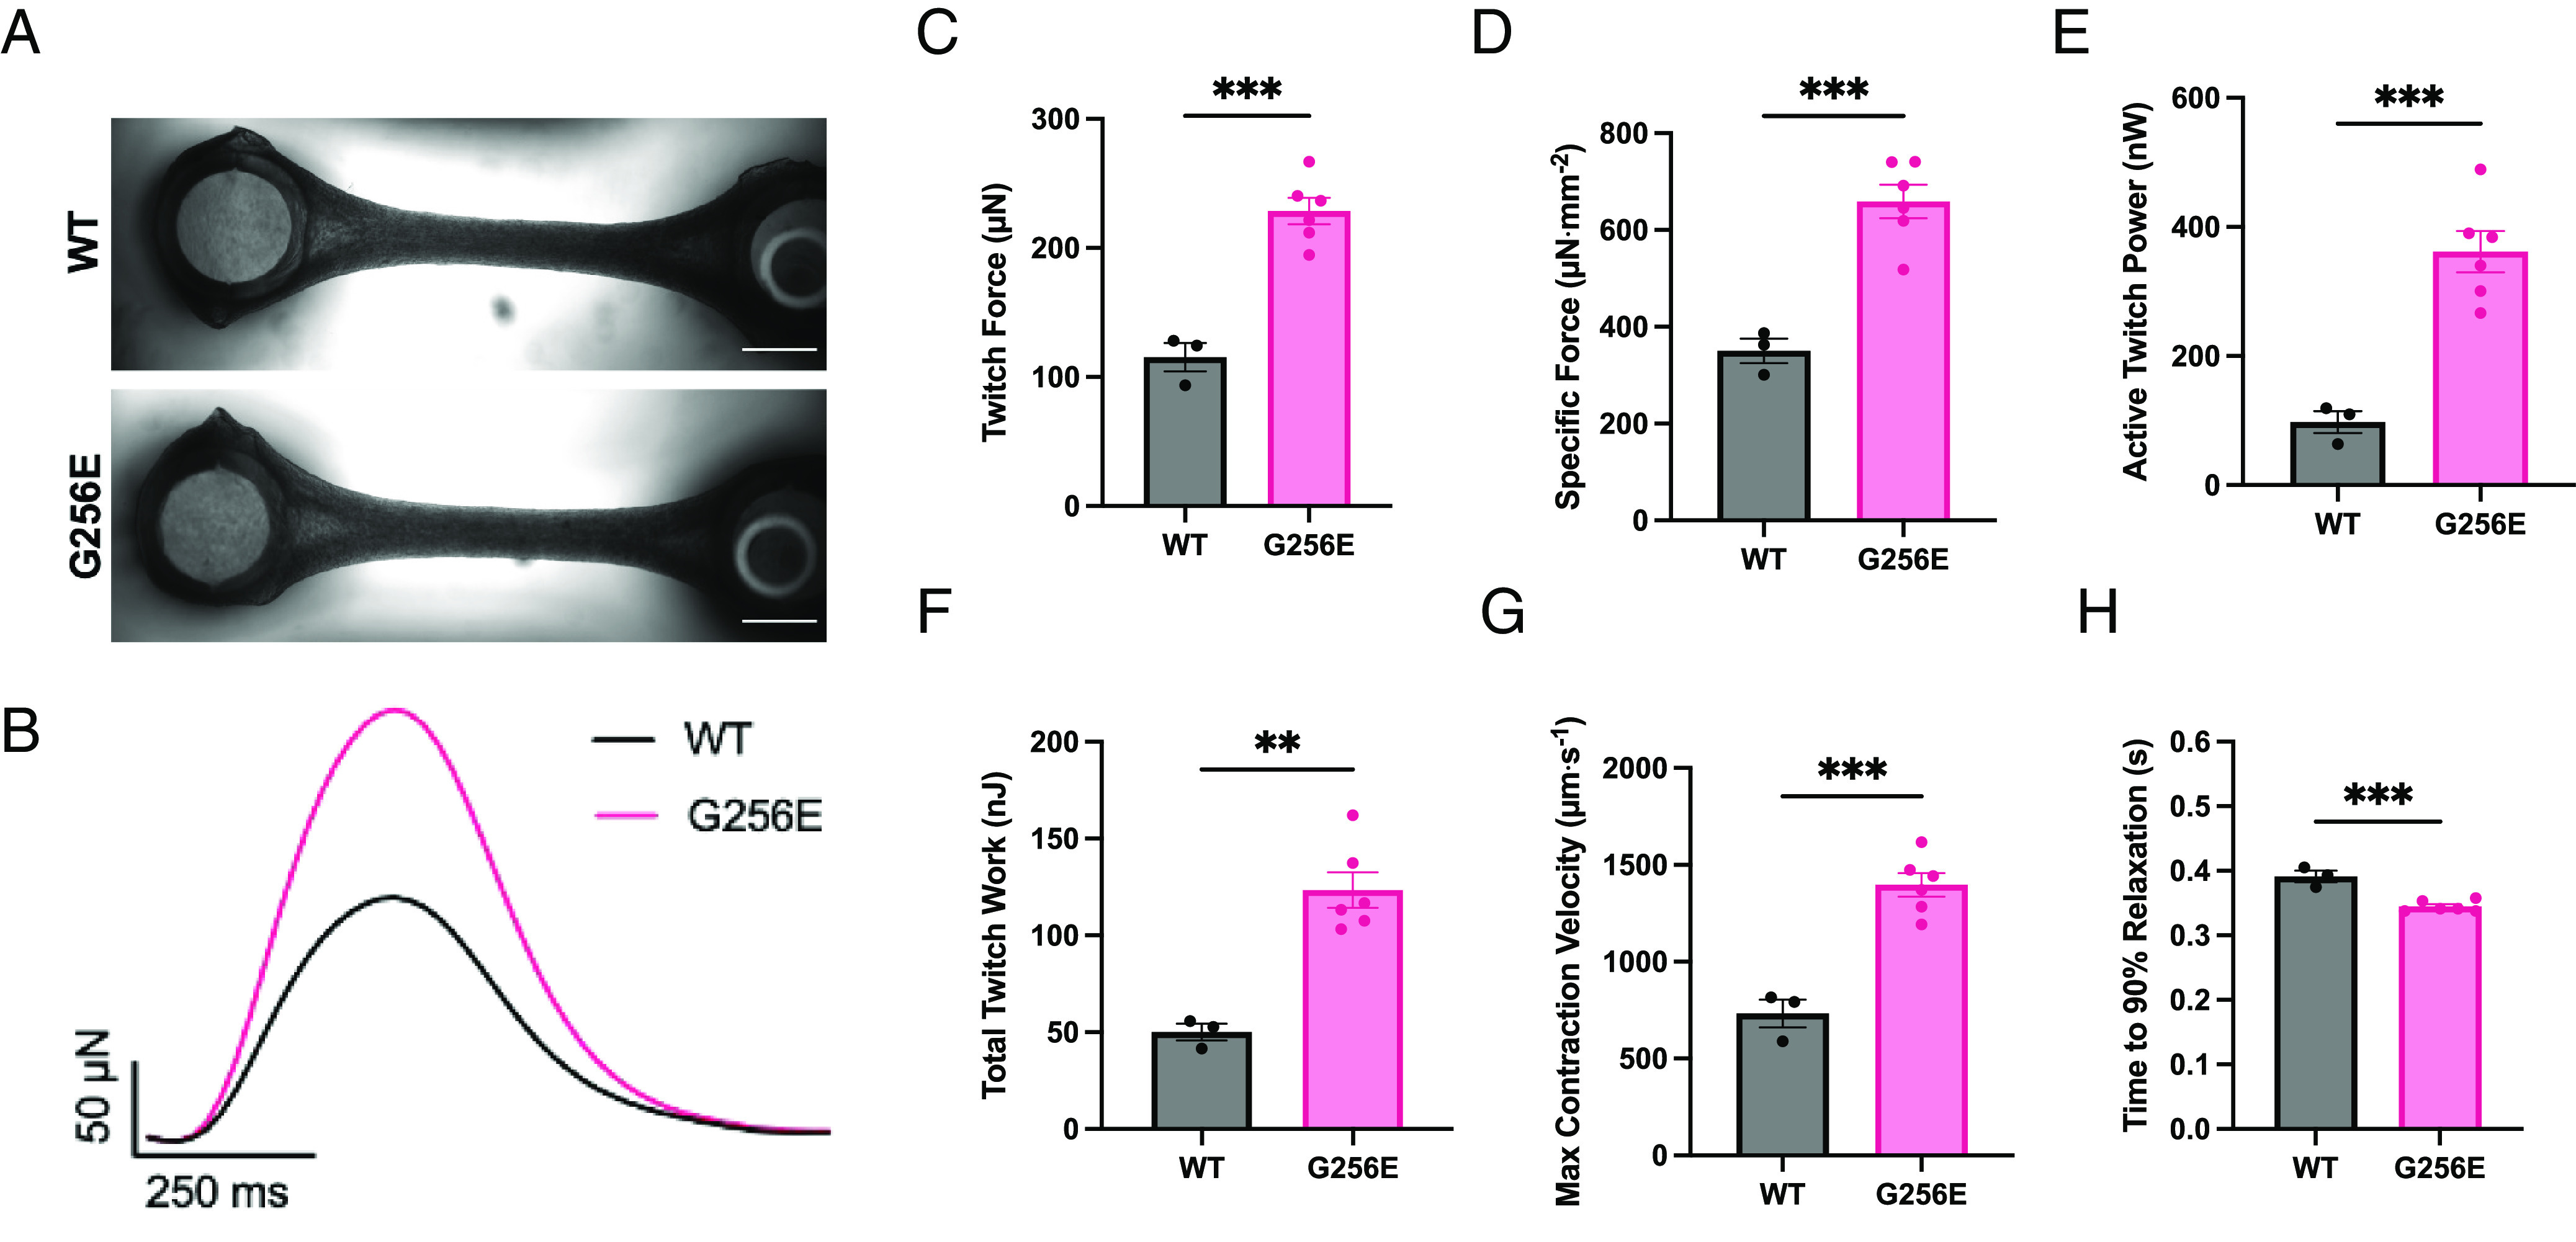
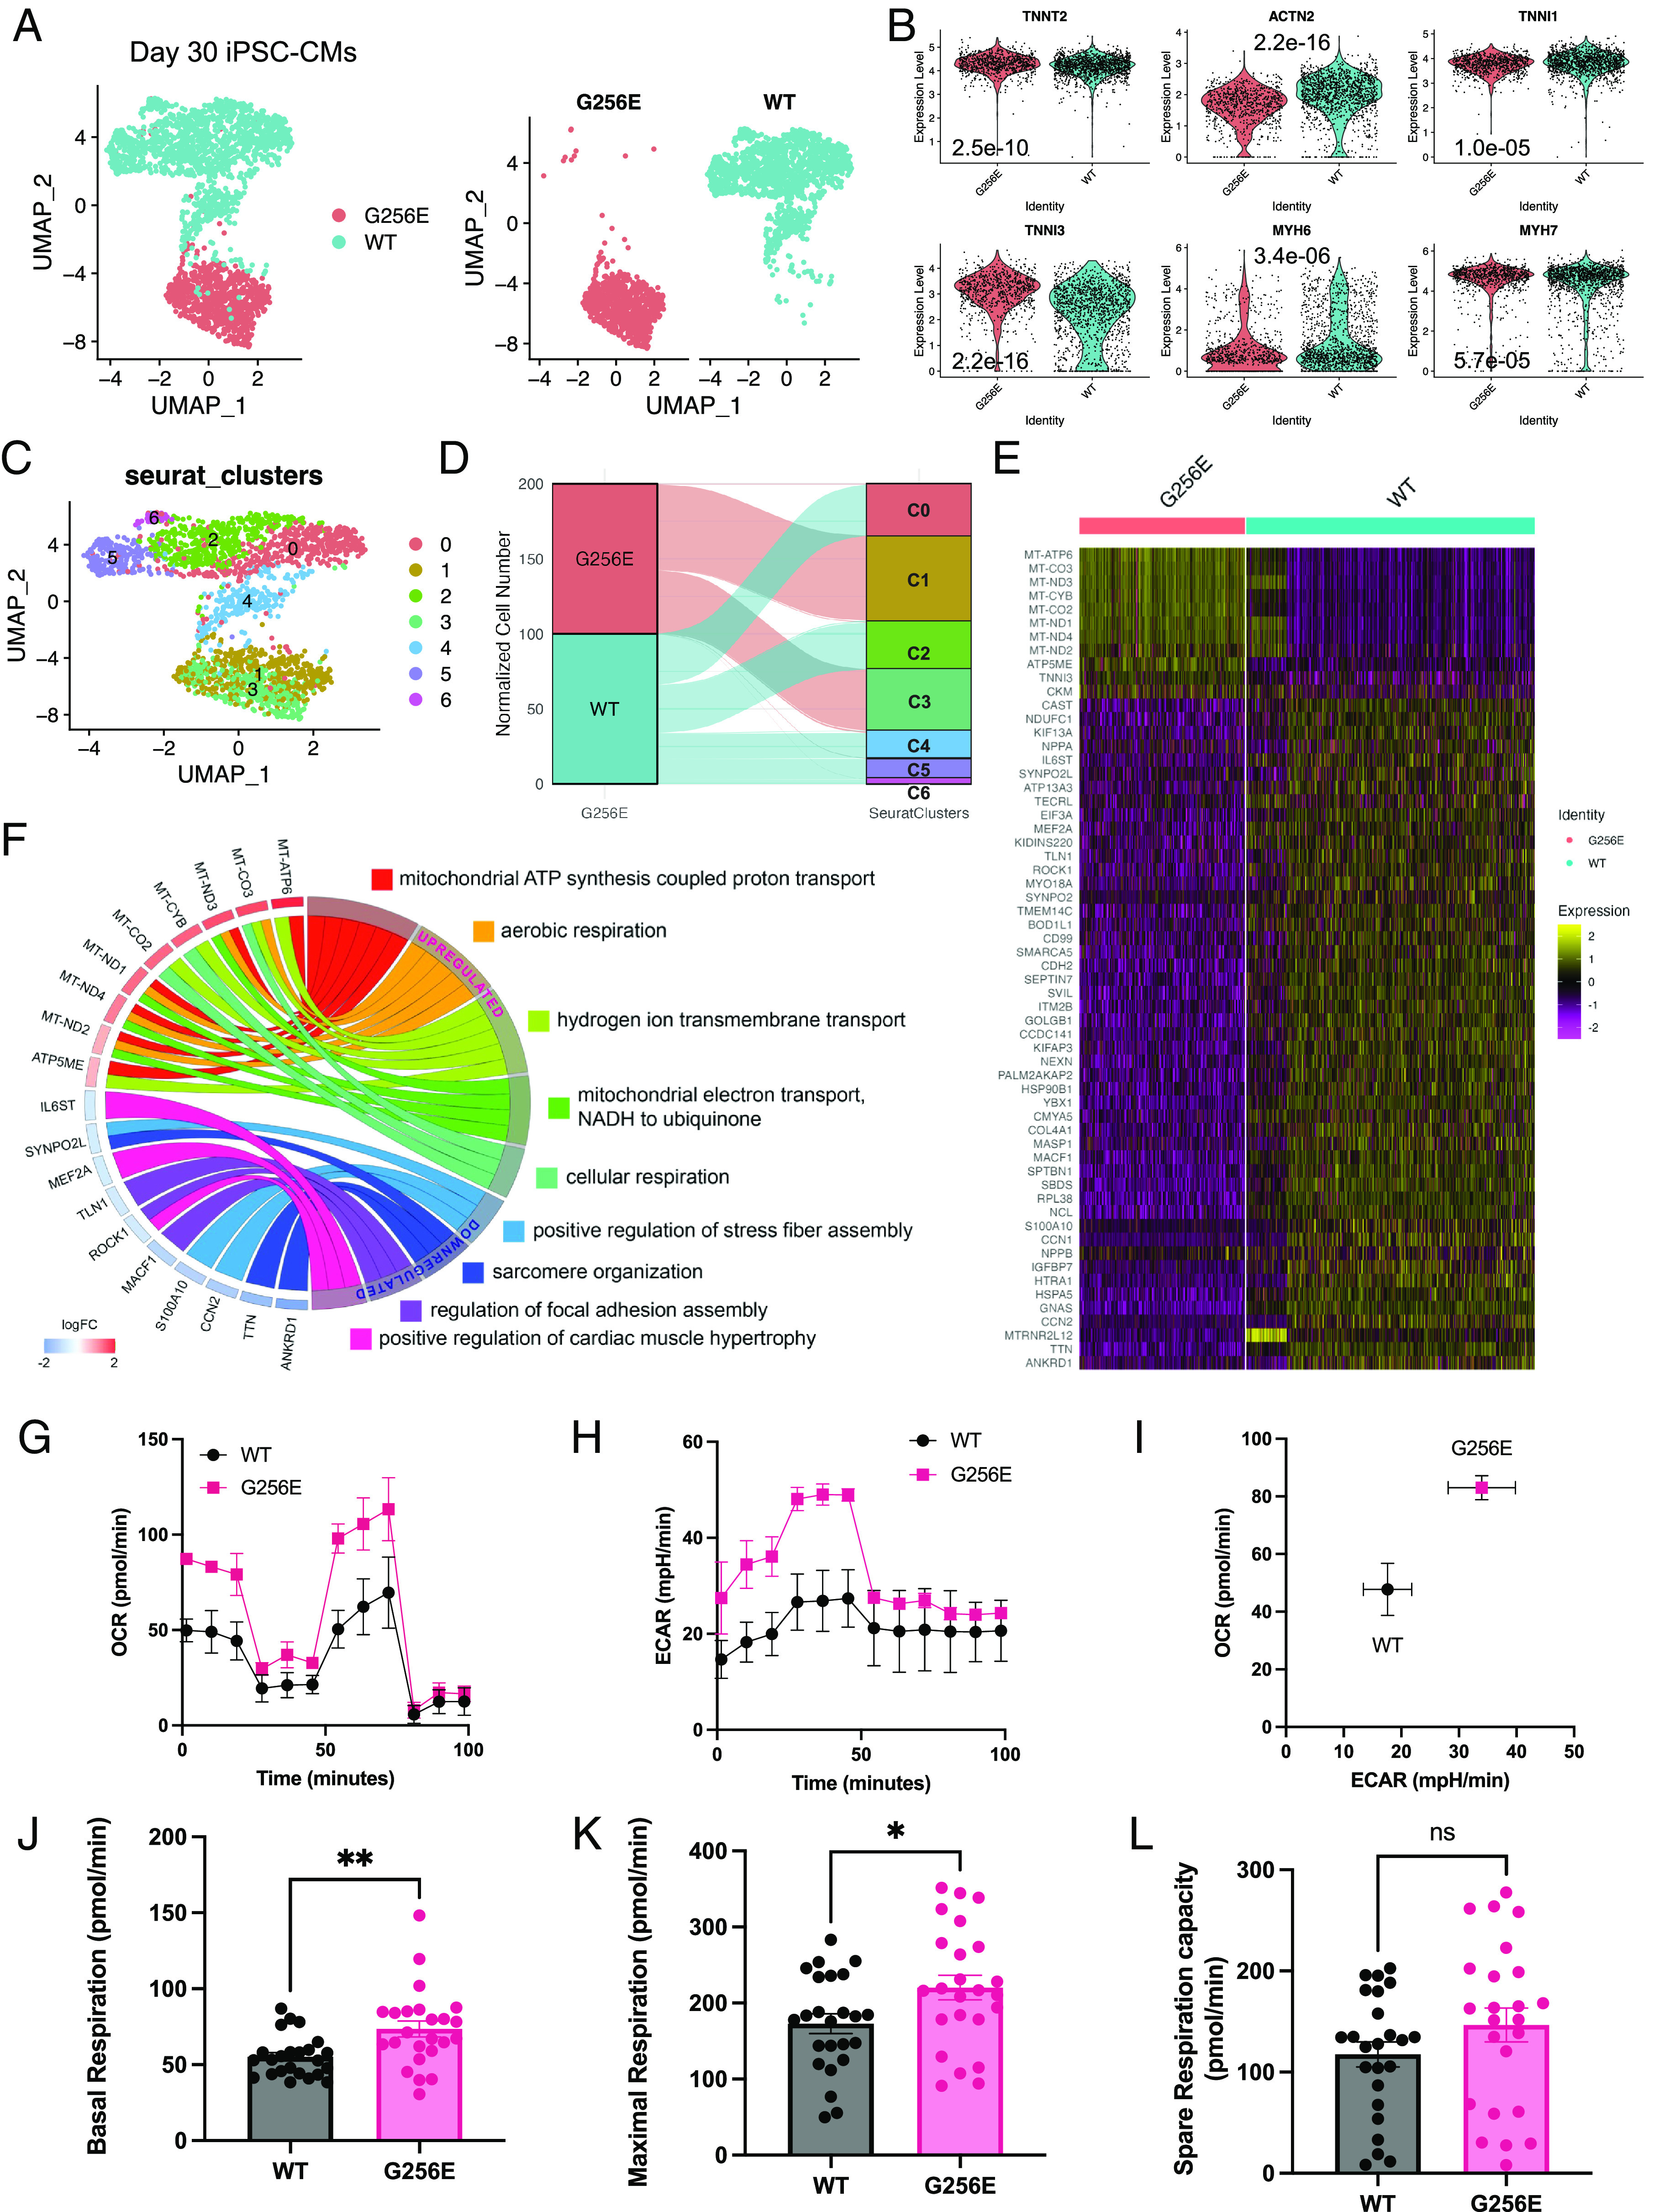
Determining the pathogenicity of hypertrophic cardiomyopathy-associated mutations in the β-myosin heavy chain (MYH7) can be challenging due to its variable penetrance and clinical severity. This study investigates the early pathogenic effects of the incomplete-penetrant MYH7 G256E mutation on myosin function that may trigger pathogenic adaptations and hypertrophy. We hypothesized that the G256E mutation would alter myosin biomechanical function, leading to changes in cellular functions. We developed a collaborative pipeline to characterize myosin function across protein, myofibril, cell, and tissue levels to determine the multiscale effects on structure-function of the contractile apparatus and its implications for gene regulation and metabolic state. The G256E mutation disrupts the transducer region of the S1 head and reduces the fraction of myosin in the folded-back state by 33%, resulting in more myosin heads available for contraction. Myofibrils from gene-edited MYH7WT/G256E human induced pluripotent stem cell-derived cardiomyocytes (hiPSC-CMs) exhibited greater and faster tension development. This hypercontractile phenotype persisted in single-cell hiPSC-CMs and engineered heart tissues. We demonstrated consistent hypercontractile myosin function as a primary consequence of the MYH7 G256E mutation across scales, highlighting the pathogenicity of this gene variant. Single-cell transcriptomic and metabolic profiling demonstrated upregulated mitochondrial genes and increased mitochondrial respiration, indicating early bioenergetic alterations. This work highlights the benefit of our multiscale platform to systematically evaluate the pathogenicity of gene variants at the protein and contractile organelle level and their early consequences on cellular and tissue function. We believe this platform can help elucidate the genotype-phenotype relationships underlying other genetic cardiovascular diseases.

Keywords: MYH7; biomechanics; hypertrophic cardiomyopathy; induced pluripotent stem cells.


Conflict of interest statement

Competing interests statement:J.A.S. is a co-founder and consultant for Cytokinetics Inc. and owns stock in the company, which has a focus on therapeutic treatments for cardiomyopathies and other muscle diseases. D.B. is a consultant for Cytokinetics Inc.

Figures

Fig. 1.
Fig. 1.
Schematic of multilength scale examination of MYH7 mutation–driven HCM pathogenesis.
Fig. 2.
Fig. 2.
MYH7 G256E mutation disrupts the transducer region of myosin. (A and B) The starting structure used for the WT myosin+ATP.Mg2+ simulations is shown and the four major structural domains of the protein have unique colors. The ATP molecule is shown in stick representation, the Mg2+. is shown in a green space-filling representation, and the atoms for G256 are shown in a pink space-filling representation. (C and D) The G256E mutation resulted in structural rearrangement of the transducer region of myosin, depicted in structural snapshots taken from the WT (C) and G256E (D) MD simulations of M.ATP state myosin. Residues in the transducer region are represented as ribbons, ATP Mg is represented as spheres. The sidechain and backbone atoms of residues with distinct atomic interactions are shown. (E) G256E resulted in a shift in residue–residue side chain contacts within the vicinity of the mutation site. Error bars are SD. (F) G256E also resulted in a shift in backbone-backbone hydrogen bonding patterns among residues in the central β-sheet. Hydrogen bonds between strands β5 and β6 near the ATP pocket were formed less frequently in the G256E simulations. Data are presented as mean ± SD. Statistical significance was determined by a student’s t test. *P < 0.05, **P < 0.01, ****P < 0.0001.
Fig. 3.
Fig. 3.
Measurements of myosin molecular activity revealed that G256E myosin exhibits a significant reduction in actin gliding velocity and super relaxed state (SRX) fraction. (A) Mean actin gliding velocities for WT and G256E sS1 construct of β-MHC. Mean actin gliding velocity shown (MVEL20) is the mean velocity of all moving actin filaments after removing all filaments whose deviation in velocity is 20% or more than its mean velocity. [Biological replicates (N) = 4, technical replicate (n) = 14]. (B) Representative actin-activated ATPase curves for G256E and WT in single-headed sS1 construct showing similar ATPase rates. (N = 2, n = 6). (C and D) Representative actin-activated ATPase curves for WT and G256E two-headed myosin constructs. The rates presented are calculated per myosin head by normalizing to the myosin concentration used in the assay. Each data point represents the average of three technical replicates of one biological replicate (n = 3). Actin-activated curves are fitted to Michaelis–Menten kinetics, Error bars represent SD and shaded areas depict the 95% CI of the fits. The two other biological replicates can be found in SI Appendix, Fig S1. (C) Long (25 hep) tailed WT myosin has a ~40% reduction in ATPase rate whereas the long-tailed G256E myosin has a ~20% reduction in ATPase rate as compared to the corresponding short (2 hep) tailed myosin. (E) Single turnover assay depicted as percentage of myosin in SRX state. G256E significantly reduces the fraction of myosin in the SRX state, resulting in a 26.5 ± 2.82% (mean ± SEM) decrease in SRX (N = 4, n = 11 to 26). Each data point represents a single experiment, and individual fluorescence decay curves can be found in SI Appendix, Fig S2. ∗∗∗∗P < 0.0001.
Fig. 4.
Fig. 4.
Isolated hiPSC-CM-derived myofibril with G256E mutation demonstrates increased tension generation at a faster rate and delayed slow phase relaxation. (A and B) Increased tension can be seen in the activation trace of MYH7 G256E mutant myofibrils (MYH7WT/G256E, red) compared to WT isogenic controls (MYH7WT/WT, black). (C and D) Normalized force trace shows increased rate of activation (kACT) of mutant myofibrils compared to isogenic controls. (E) Fast phase of relaxation is unaffected. (FH) Close-up of slow phase relaxation showing slower early phase relaxation (kREL, slow) of G256E mutants. Statistical significance was determined by Welch’s unpaired two-tailed t test. ns P > 0.05, *P < 0.05, ***P < 0.001. (WT N = 5, G256E N = 6).
Fig. 5.
Fig. 5.
Single-cell contractility analysis revealed hiPSC-CMs bearing MYH7 G256E mutation show hypercontractility. (A and B) Representative images of patterned single WT isogenic control (MYH7WT/WT, WT) and MYH7 G256E mutant hiPSC-CMs (MYH7WT/G256E, G256E) and their traction force traces. (CE) MYH7 G256E mutant (red) depicts increased (C) total peak force, (D) contraction velocity, and (E) decreased relaxation velocity compared to WT isogenic control. (F) Representative images of sarcomeric organization in single WT isogenic control and G256E mutant hiPSC-CMs. (G and H) The G256E mutant shows statistically reduced sarcomere length and increased sarcomere shortening compared to the WT isogenic control. Data are presented as mean ± SD. Statistical significance was determined by an unpaired t test. P < 0.05 is designated with *P < 0.005 is designated with **P < 0.0005 or smaller is designated with ***. (N = 30+ cells).
Fig. 6.
Fig. 6.
EHT model revealed hypercontractility in G256E EHTs. (A) Images of representative EHTs, shown with flexible post at the Left and rigid post at the Right (scale bar, 1 mm.) (B) Representative traces of EHT twitch force. (CH) Measured metrics of WT and G256E EHT contractility derived from videos of EHT contraction. Each data point represents an individual EHT. ∗∗P ≤ 0.01, ∗∗∗P ≤ 0.001. (WT N = 3, G256E N = 6).
Fig. 7.
Fig. 7.
Single-cell transcriptomic profiling and Mito Stress test reveal elevated mitochondrial respiration in MYH7-G256E mutant hiPSC-CMs. (A) UMAP representation of MYH7 G256E mutant cells (MYH7WT/G256E, G256E) and the isogenic counterpart (MYH7WT/WT, WT) clustered by the presence of G256E mutation. (B) Violin plots of cardiomyocyte marker genes. P values are calculated using the Wilcoxon rank sum test. (C) Unbiased clustering of G256E and WT hiPSC-CMs. (D) Alluvial plot demonstrating the composition of Seurat clusters. (E) Heatmap of top differentially expressed genes between G256E mutant and isogenic control. (logFC > log1.8). (F) Chord plot of gene ontology biological process terms associated with top differentially expressed genes. (GL) Results of mitochondrial respiration profiling. Representative graphs of (G) oxygen consumption rate (OCR), (H) extracellular acidification rate (ECAR), and (I) OCR-ECAR plot demonstrating metabolic shift. Bar graphs of (J) baseline, (K) maximum, and (L) spare respiration capacity. (JL) Data are presented as mean ± SEM. Each datapoint represents a sample (N = 4, n = 24). Statistical significance was determined by an unpaired t test. *P < 0.05, **P < 0.01 ns = not significant. (AF. N = 3; GL. N = 4, n = 24).

Update of

References

    1. Maron B. J., Maron M. S., Hypertrophic cardiomyopathy. Lancet 381, 242–255 (2013). - PubMed
    1. Semsarian C., Ingles J., Maron M. S., Maron B. J., New perspectives on the prevalence of hypertrophic cardiomyopathy. J. Am. Coll. Cardiol. 65, 1249–1254 (2015). - PubMed
    1. Marian A. J., Braunwald E., Hypertrophic cardiomyopathy. Circ. Res. 121, 749–770 (2017). - PMC - PubMed
    1. Ranjbarvaziri S., et al. , Altered cardiac energetics and mitochondrial dysfunction in hypertrophic cardiomyopathy. Circulation 144, 1714–1731 (2021). - PMC - PubMed
    1. Alfares A. A., et al. , Results of clinical genetic testing of 2,912 probands with hypertrophic cardiomyopathy: Expanded panels offer limited additional sensitivity. Genet. Med. 17, 880–888 (2015). - PubMed

Publication types

MeSH terms