. 2024 May 7;121(19):e2307156121.
doi: 10.1073/pnas.2307156121. Epub 2024 Apr 29.

Human mutations in high-confidence Tourette disorder genes affect sensorimotor behavior, reward learning, and striatal dopamine in mice

Affiliations

Human mutations in high-confidence Tourette disorder genes affect sensorimotor behavior, reward learning, and striatal dopamine in mice

Cara Nasello et al. Proc Natl Acad Sci U S A. .

Abstract

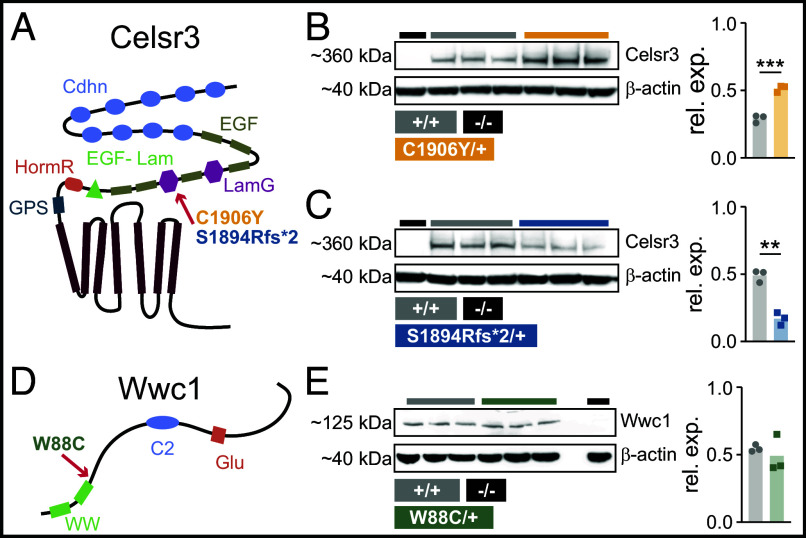
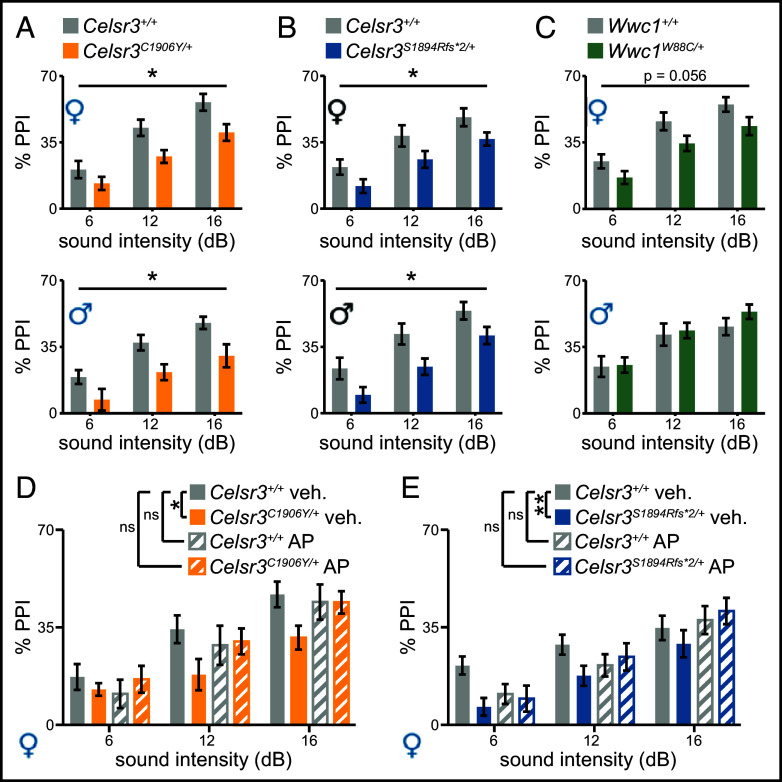
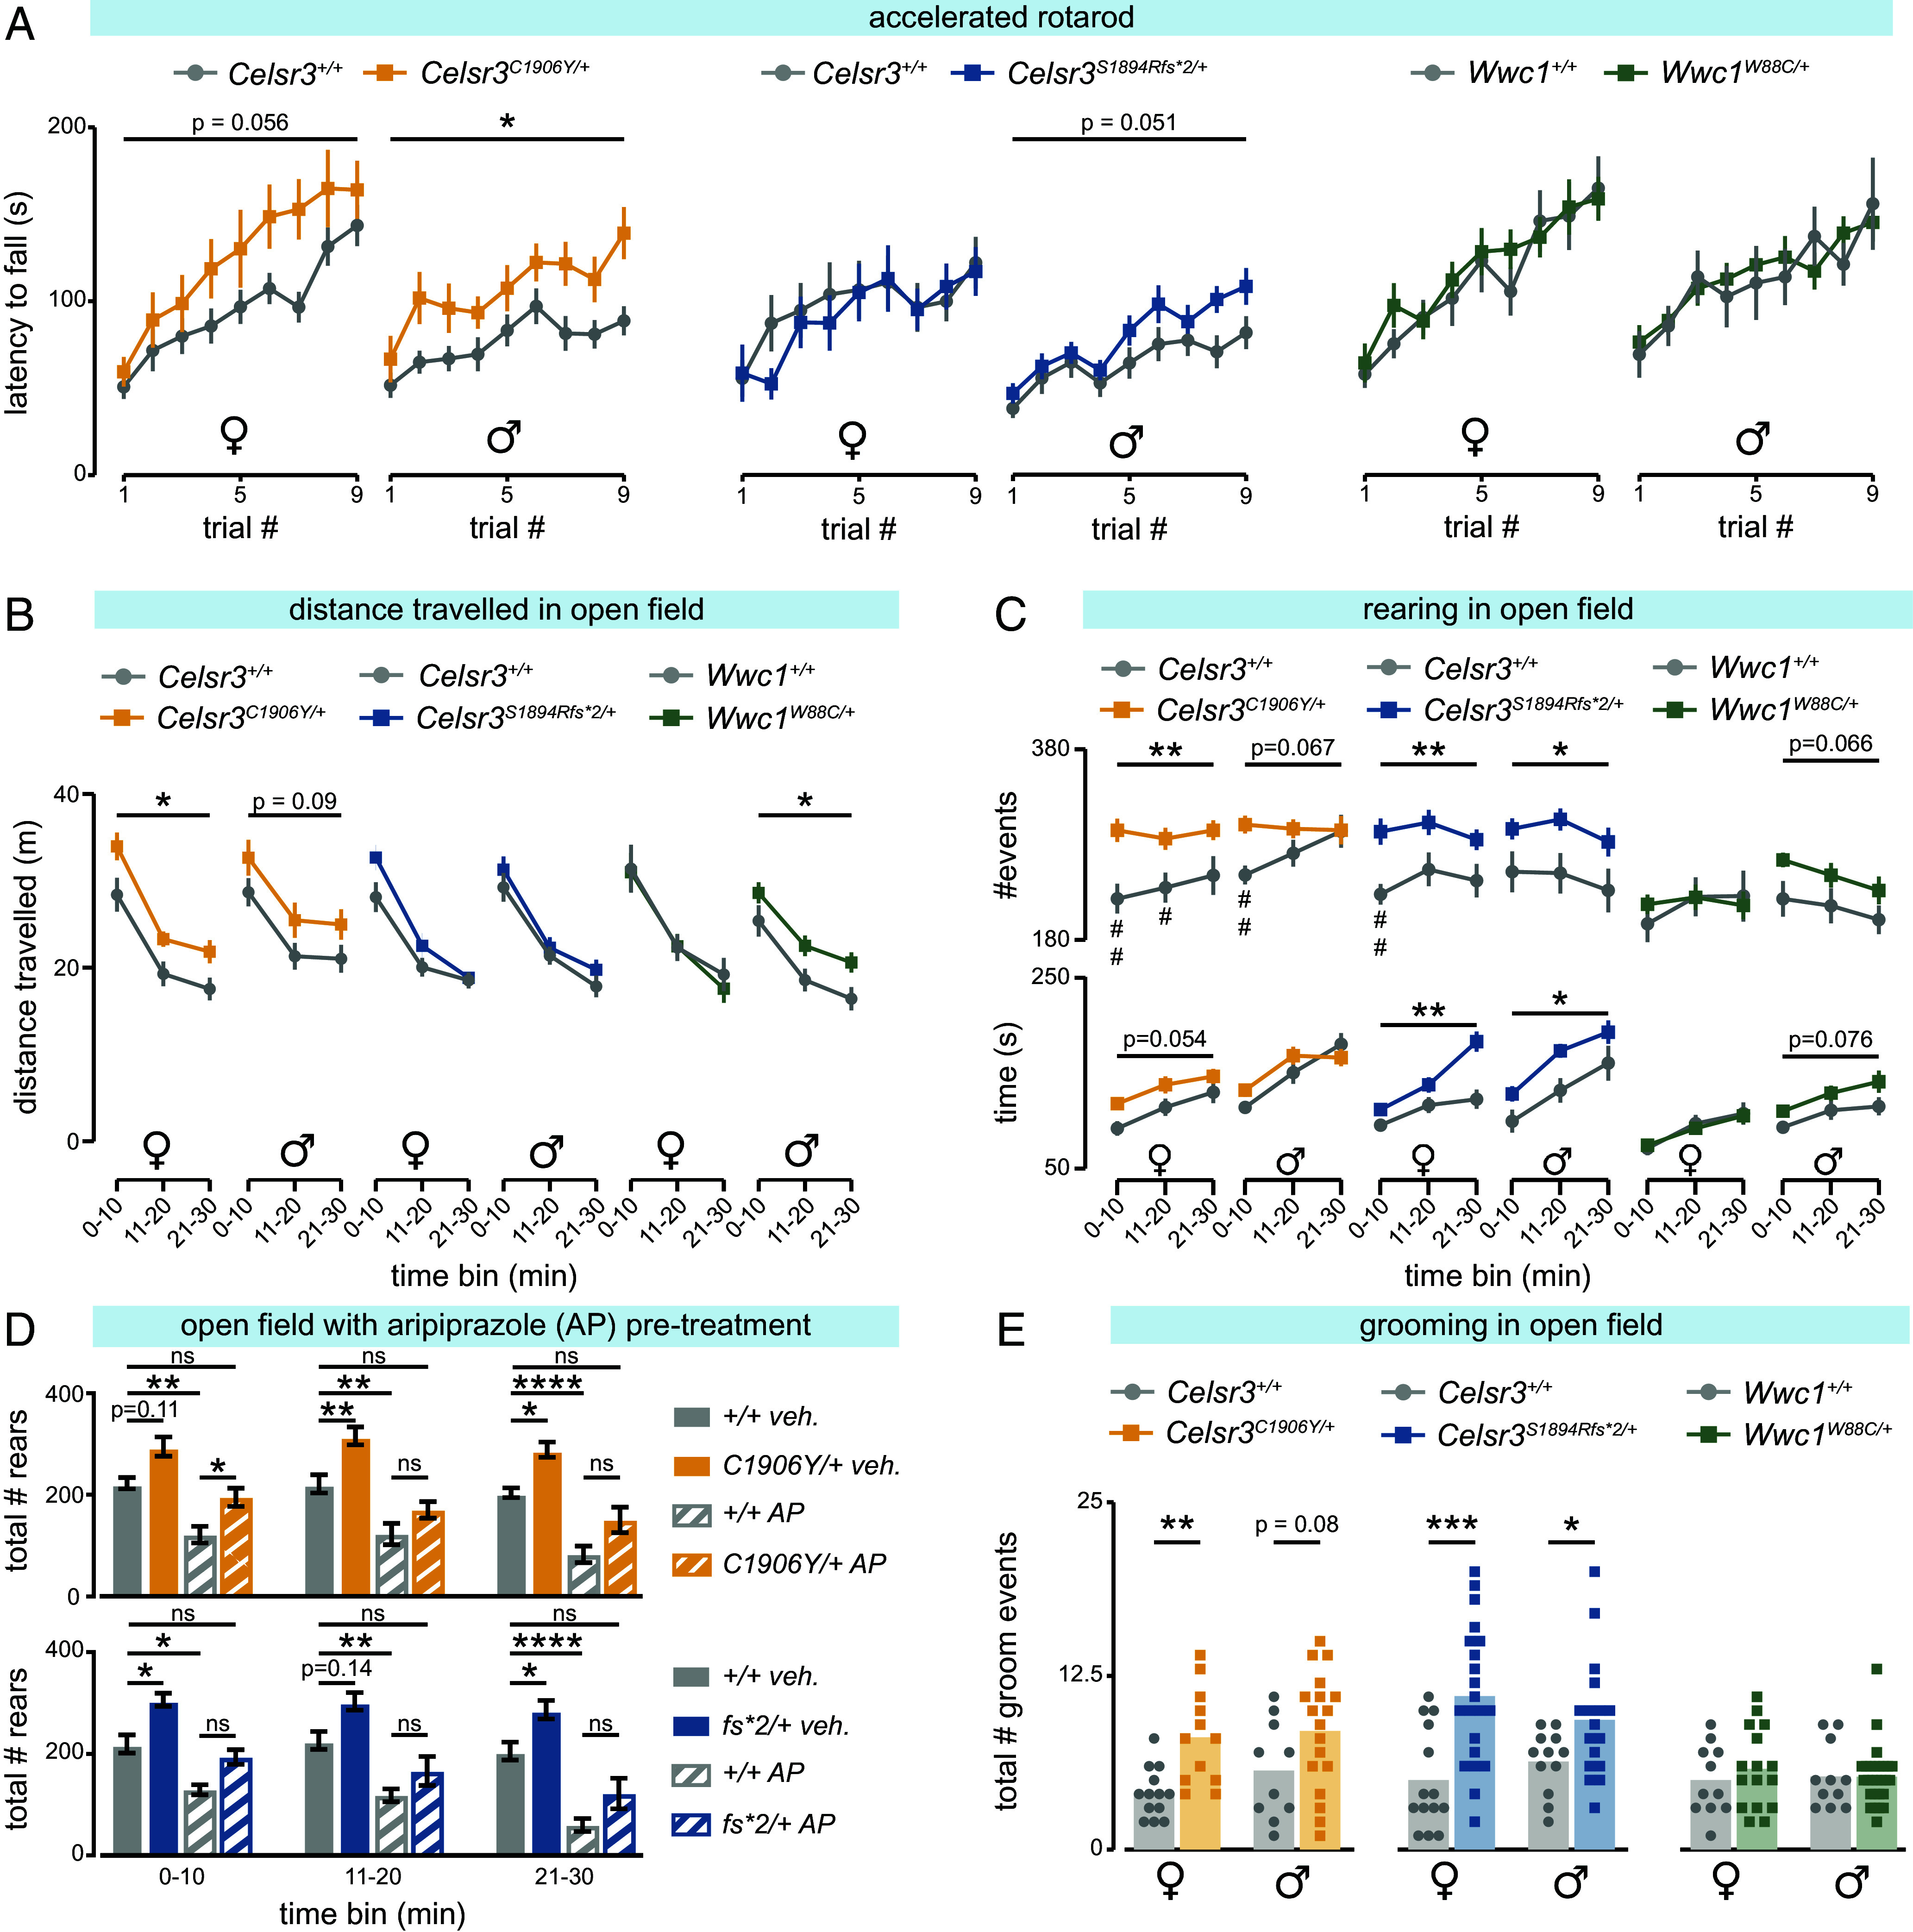
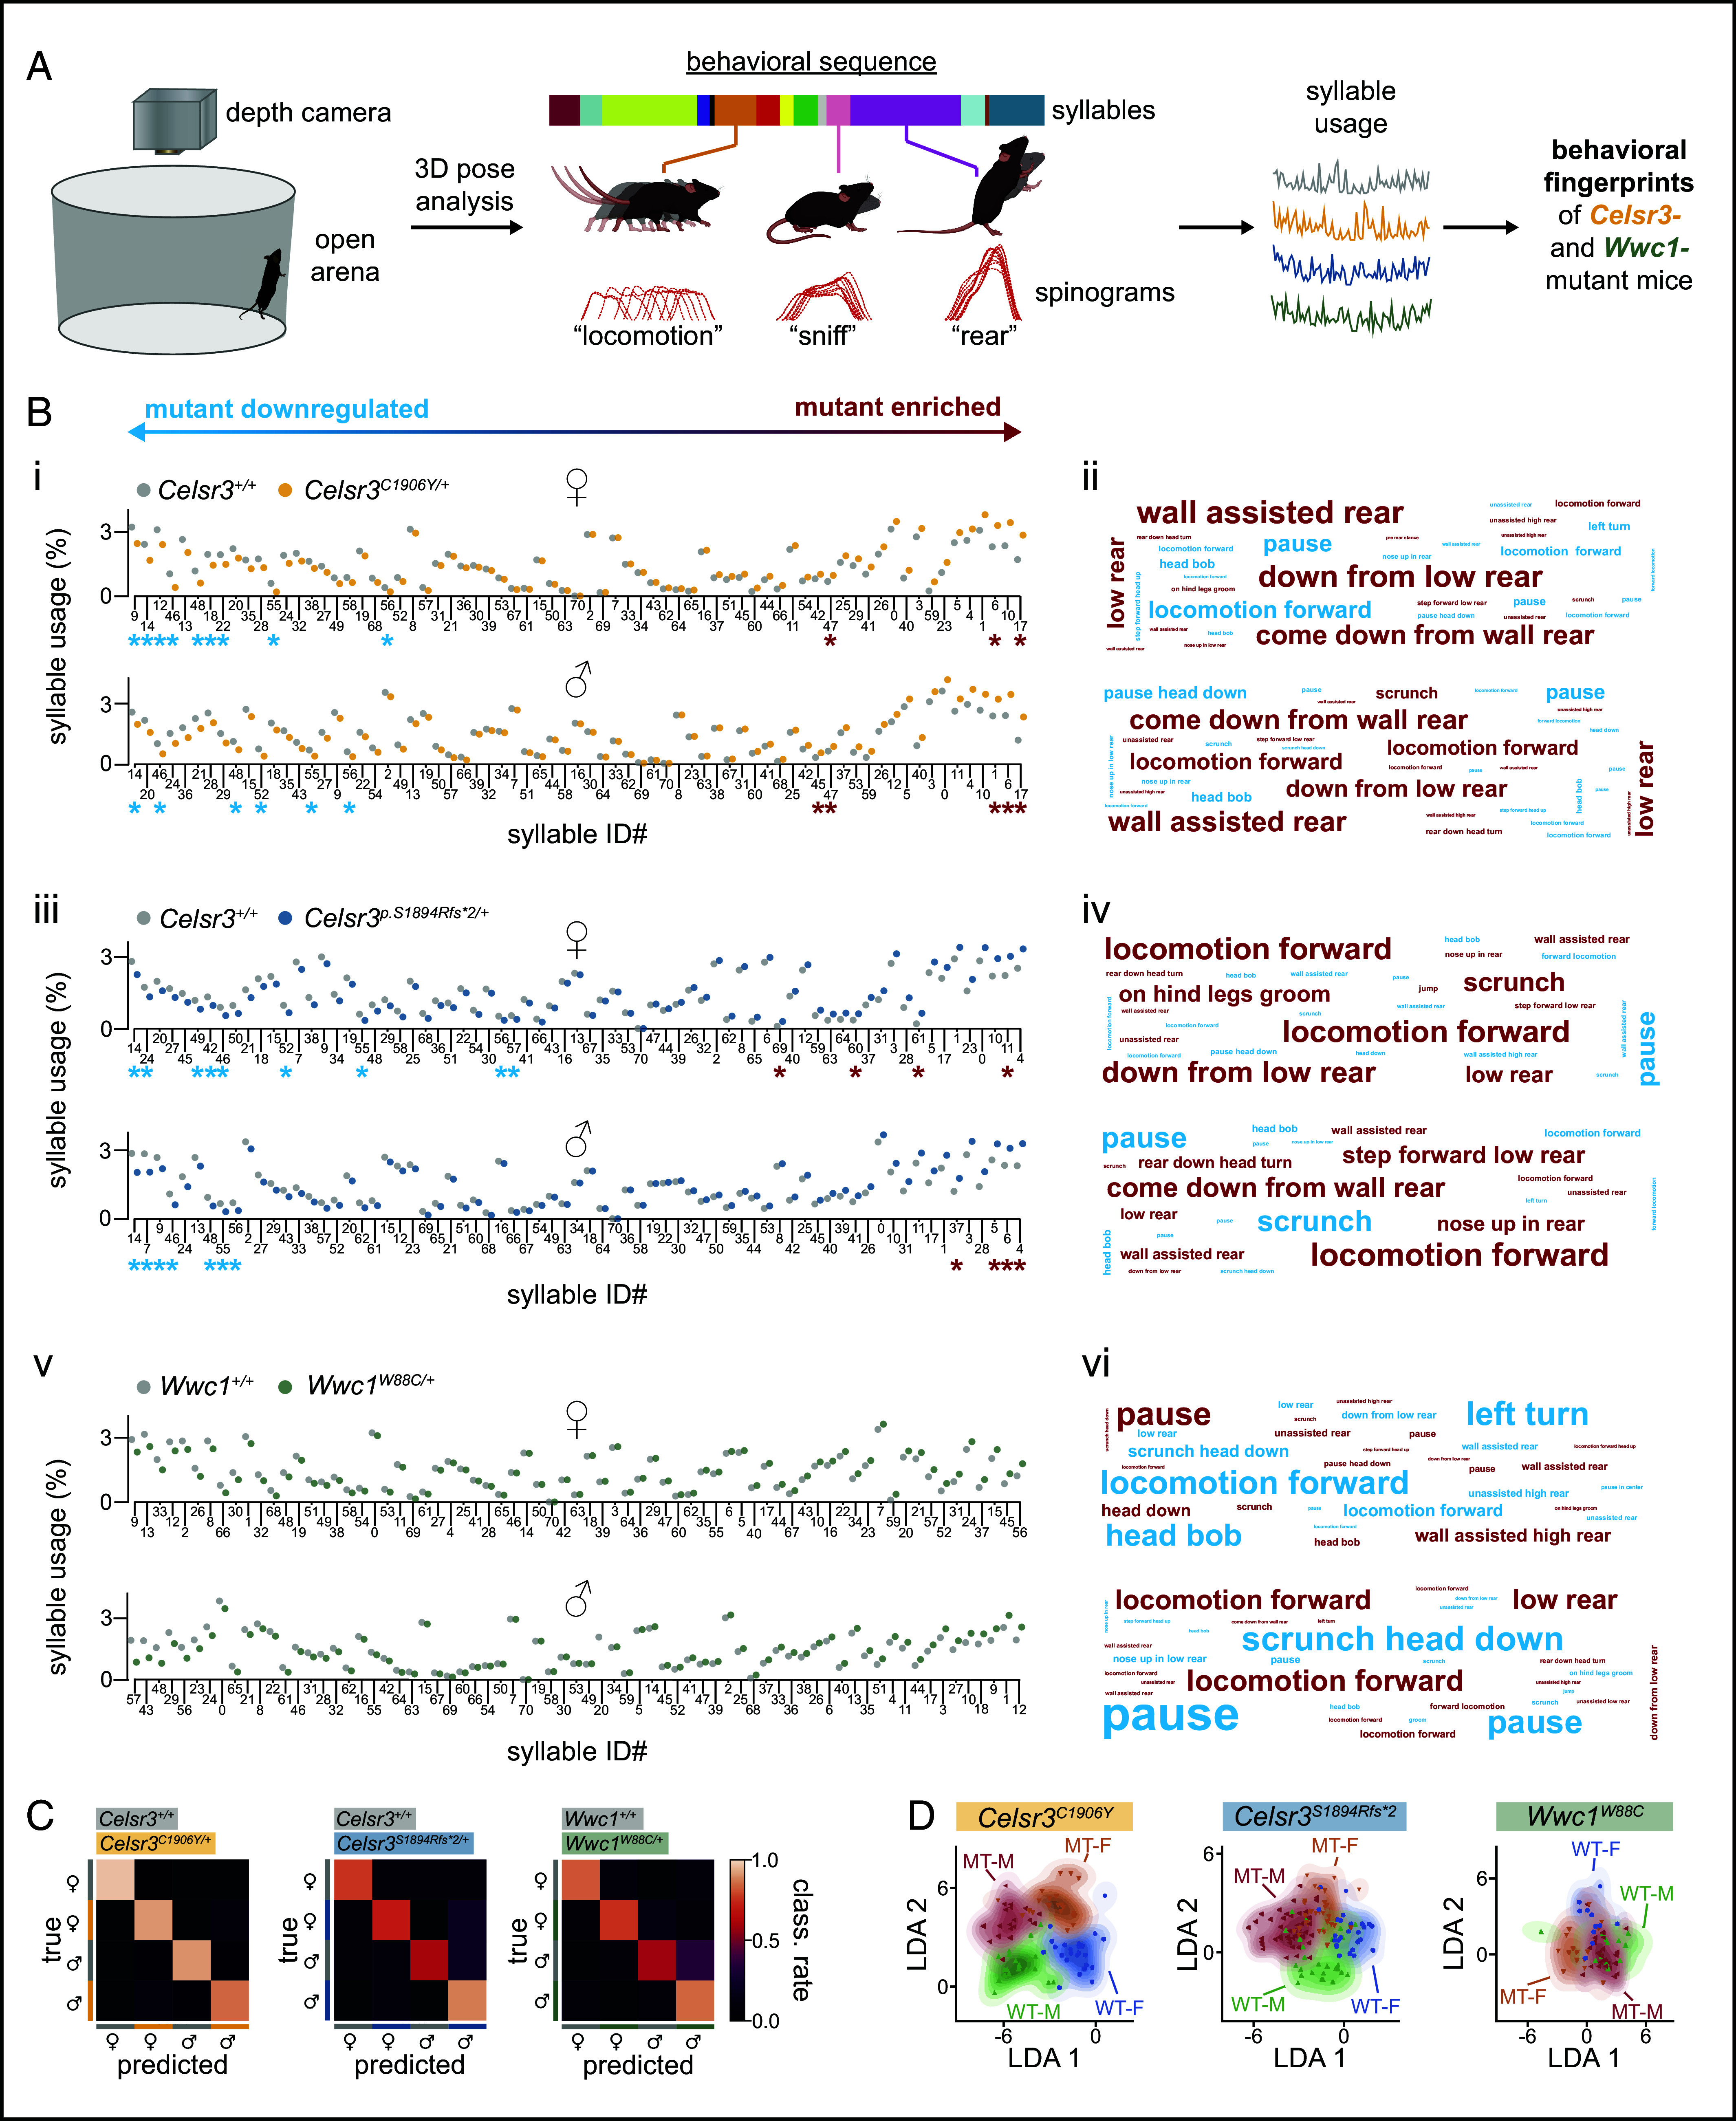
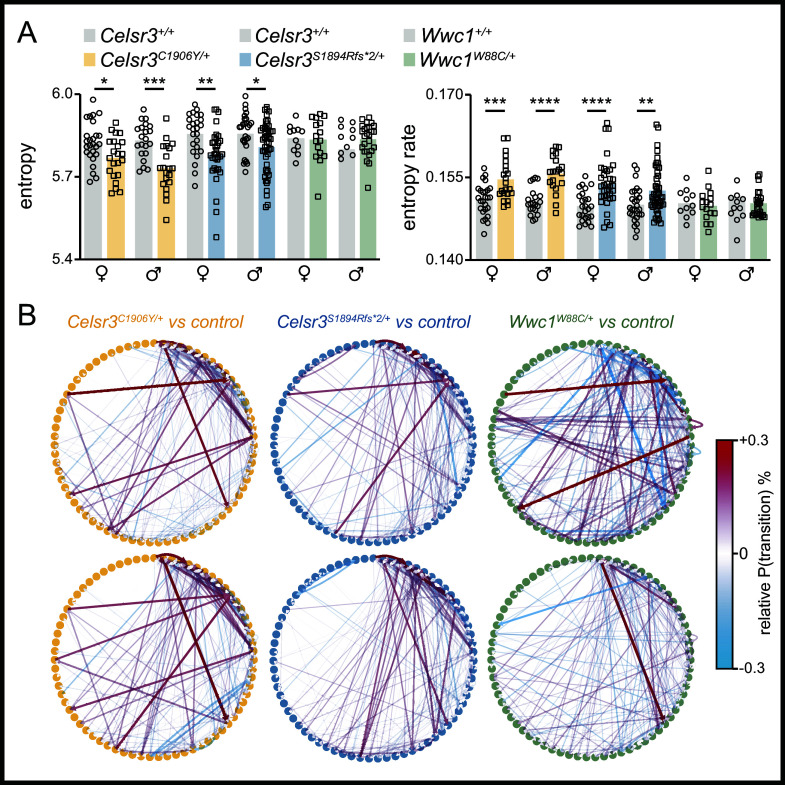
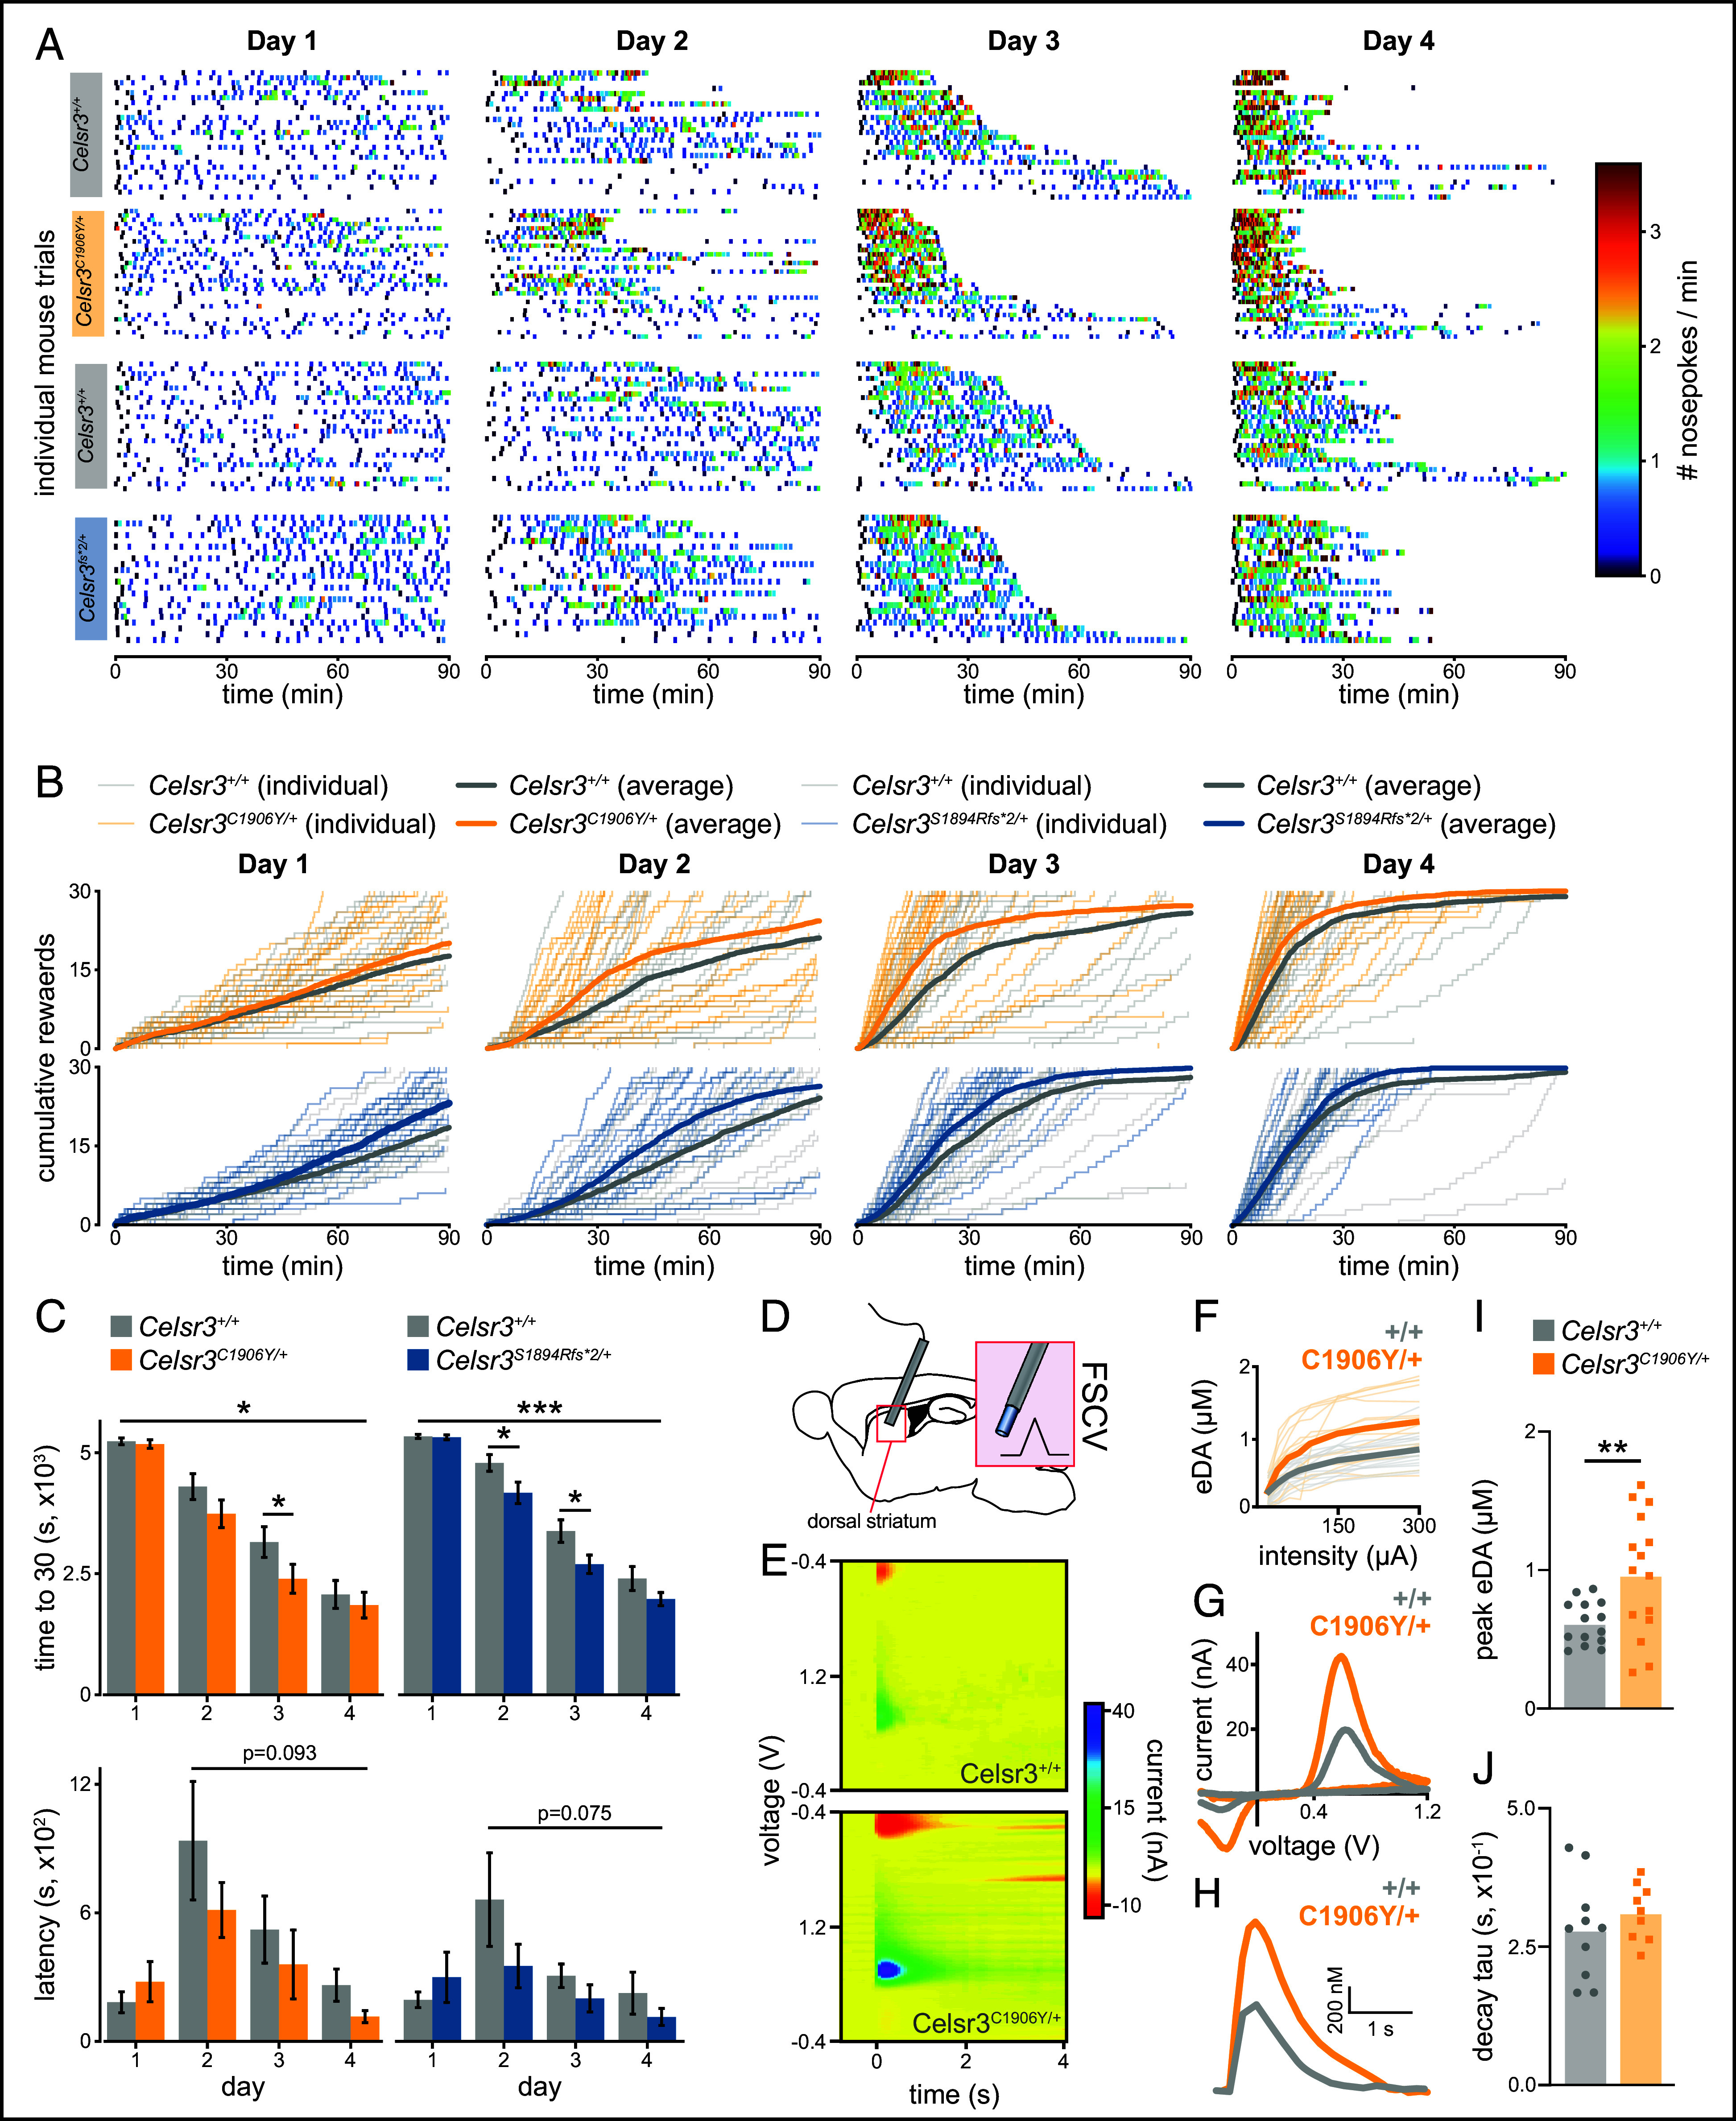
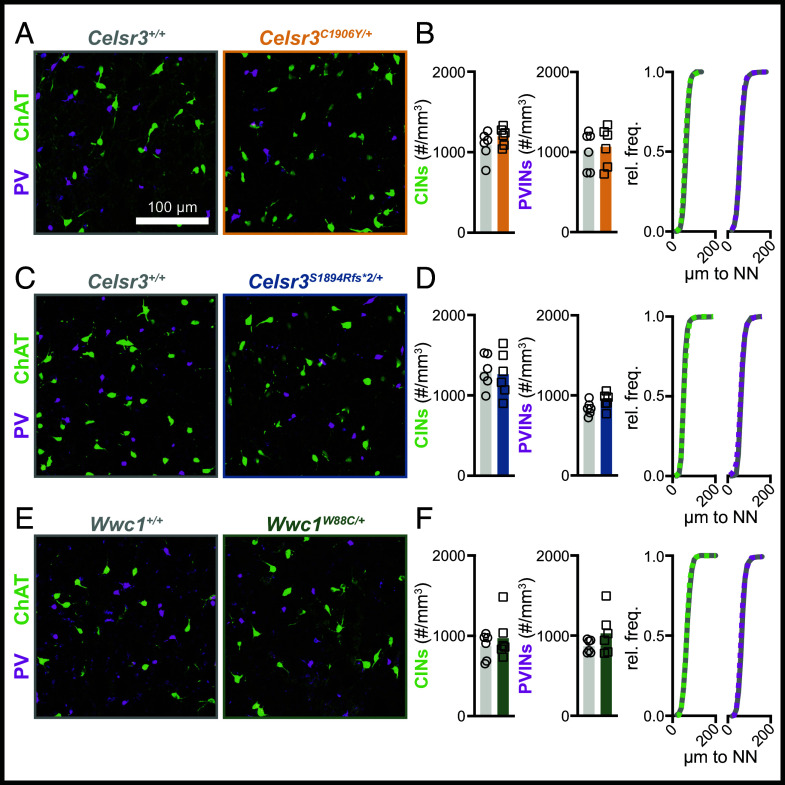
Tourette disorder (TD) is poorly understood, despite affecting 1/160 children. A lack of animal models possessing construct, face, and predictive validity hinders progress in the field. We used CRISPR/Cas9 genome editing to generate mice with mutations orthologous to human de novo variants in two high-confidence Tourette genes, CELSR3 and WWC1. Mice with human mutations in Celsr3 and Wwc1 exhibit cognitive and/or sensorimotor behavioral phenotypes consistent with TD. Sensorimotor gating deficits, as measured by acoustic prepulse inhibition, occur in both male and female Celsr3 TD models. Wwc1 mice show reduced prepulse inhibition only in females. Repetitive motor behaviors, common to Celsr3 mice and more pronounced in females, include vertical rearing and grooming. Sensorimotor gating deficits and rearing are attenuated by aripiprazole, a partial agonist at dopamine type II receptors. Unsupervised machine learning reveals numerous changes to spontaneous motor behavior and less predictable patterns of movement. Continuous fixed-ratio reinforcement shows that Celsr3 TD mice have enhanced motor responding and reward learning. Electrically evoked striatal dopamine release, tested in one model, is greater. Brain development is otherwise grossly normal without signs of striatal interneuron loss. Altogether, mice expressing human mutations in high-confidence TD genes exhibit face and predictive validity. Reduced prepulse inhibition and repetitive motor behaviors are core behavioral phenotypes and are responsive to aripiprazole. Enhanced reward learning and motor responding occur alongside greater evoked dopamine release. Phenotypes can also vary by sex and show stronger affection in females, an unexpected finding considering males are more frequently affected in TD.

Keywords: Tourette disorder; behavior; mouse models; neuroanatomical findings.


Conflict of interest statement

Competing interests statement:The authors declare no competing interest.

Figures

Fig. 1.
Fig. 1.
Celsr3 and Wwc1 protein domains, mutation sites, and relative levels. (A) Celsr3 protein schematic with domains and mutations denoted. Transmembrane (TM), G-protein signaling (GPS), hormone receptor (HormR), epidermal growth factor-like laminin (EGF-Lam), laminin G (LamG), epidermal growth factor (EGF), and cadherin (Cadhn) domains. (B) Celsr3 KO (Celsr3−/−, lane 1), wild-types (Celsr3+/+, lanes 2 to 4), and mutants (Celsr3C1906Y/+, lanes 5 to 7). Celsr3 protein levels, relative to β-actin, are shown in bar plot (P = 0.0006). (C) Celsr3−/− (lane 1), Celsr3+/+ (lanes 2 to 4), Celsr3p.S1894Rfs*2/+ (lanes 5 to 7). Celsr3 protein levels, relative to β-actin, are shown in bar plot (P = 0.001). (D) Wwc1 protein schematic with WW and C2 domains and a glutamic (Glu)-rich sequence. W88C substitution (green) is located after the second WW domain. (E) Wild-type (Wwc1+/+, lanes 1 to 3), mutant (Wwc1W88C/+, lanes 4 to 6), blank lane (X, lane 7), and homozygous null (Wwc1−/−, lane 8). Protein levels, relative to β-actin, are shown in bar plot (P = 0.534). Unpaired t test (B, C, and E). **P < 0.01, ***P < 0.001.
Fig. 2.
Fig. 2.
Celsr3 and Wwc1 mutant mice have reduced PPI. (A) Female Celsr3+/+/Celsr3C1906Y/+ (n = 14/11), P = 0.0281; Male Celsr3+/+/Celsr3C1906Y/+ (n = 16/11), P = 0.011. (B) Female Celsr3+/+/Celsr3S1894Rfs*2/+ (n = 15/26), P = 0.046; Male Celsr3+/+/Celsr3S1894Rfs*2/+ (n = 17/20), P = 0.022. (C) Female Wwc1+/+/Wwc1W88C/+ (n = 17/20), P = 0.056 Male Wwc1+/+/Wwc1W88C/+ (n = 13/29) P = 0.533. (D and E) Aripiprazole attenuates PPI deficits in Celsr3C1906Y/+ and Celsr3S1894Rfs*2/+ females. (D) [F(11, 147) = 6.491, P < 0.00001, R2 = 0.28], genotype (t = −1.69, P = 0.093), treatment (t = 0.776, P = 0.44), genotype (x) treatment (t = 2.419, P = 0.017). Vehicle-treated Celsr3+/+/Celsr3C1906Y/+ (n = 16/11); drug-treated Celsr3+/+/Celsr3C1906Y/+ (n = 13/13). (E) [F(11, 168) = 6.987, P < 0.00001, R2 = 0.27], genotype (t = −1.868, P = 0.064), treatment (t = 0.463, P = 0.64), genotype (x) treatment (t = 2.507, P = 0.013). Vehicle-treated Celsr3+/+/Celsr3S1894Rfs*2/+ (n = 18/16); drug-treated Celsr3+/+/Celsr3S1894Rfs*2/+ (n = 13/13). (AC) Two-way ANOVA repeated measures, main effect genotype. (D and E) Multiple linear regression (factor III). *P < 0.05, **P < 0.01. Full description of statistics in SI Appendix, Table S1.
Fig. 3.
Fig. 3.
Mutant mice display improved rotarod performance with enhanced rearing and grooming in the open field. (A) Celsr3C1906Y/+ males/females and Celsr3S1894Rfs*2/+ males perform better on an accelerating rotarod. Wwc1W88C/+ mice show normal latency to fall. (B) Celsr3C1906Y/+ females travel more distance in the open field. Celsr3C1906Y/+ males show a trend-level effect (P = 0.09). Celsr3S1894Rfs*2/+ male and female mice travel similar distances in the open field compared to wild-type littermates. Wwc1W88C/+ males travel more distance in the open field but females travel similar distance. (C, Top Panel) Celsr3 males and females rear more in the open field. Rearing events trended up for Wwc1W88C/+ males (P = 0.066) but not females. (Bottom Panel) Time spent rearing within separate binned 10-min intervals. (D) Aripiprazole pretreatment attenuates rearing behavior. Wild-type/Celsr3C1906Y/+: [F(11, 114) = 17.99, P < 0.00001, R2 = 0.59], genotype (P < 0.0001), treatment (P < 0.0001), genotype (x) treatment interaction (P = 0.291); wild-type/Celsr3S1894Rfs*2/+: [F(11, 117) = 18.13, P < 0.00001, R2 = 0.59], genotype (P < 0.0001), treatment (P < 0.0001), genotype (x) treatment interaction (P = 0.269). (E) Celsr3C1906Y/+ females groom more in the open field and males show a trend. Celsr3S1894Rfs*2/+ females and males also groom more. Wwc1W88C/+ mice show no differences. (AC) RM Two-way RM ANOVA, main effect genotype with Bonferonni’s Multiple Comparisons Test. (A) Celsr3+/+/Celsr3C1906Y/+ female (n = 20/14), male n = 17/15; Celsr3+/+/Celsr3S1894Rfs*2/+ female (n = 20/18), male (n = 17/29); Wwc1+/+/Wwc1W88C/+ female (n = 16/31), male (n = 19/40). (B and C) Celsr3+/+/Celsr3C1906Y/+ female (n = 16/16), male n = 15/17; Celsr3+/+/Celsr3S1894Rfs*2/+ female (n = 18/25), male (n = 12/29); Wwc1+/+/Wwc1W88C/+ female (n = 12/21), male (n = 13/18). (D) Multiple linear regression (factor III) with Tukey’s post hoc test. Vehicle-WT/Celsr3C1906Y/+ (n = 12/10), Drug-WT/Celsr3C1906Y/+ (n = 10/10); Vehicle-WT/Celsr3S1894Rfs*2/+ (n = 12/11), Drug-WT/Celsr3S1894Rfs*2/+ (n = 10/10). (E) Mann–Whitney U test. Celsr3+/+/Celsr3C1906Y/+ female (n = 13/12), male (n = 10/18); Celsr3+/+/Celsr3S1894Rfs*2/+ female (n = 14/21), male (n = 12/17); Wwc1+/+/Wwc1W88C/+ female (n = 11/16), male (n = 11/29) *P < 0.05, **P < 0.01, ***P < 0.001, ****P < 0.0001; #P < 0.05, ##P < 0.01. Full description of statistics in SI Appendix, Table S1.
Fig. 4.
Fig. 4.
Unsupervised machine learning reveals changes to spontaneous motor behavior. (A) Schematic of motion sequencing approach. (B) Left, mutation plots summarizing mean usage of each syllable in wild type and mutant mice. Syllables are ordered by the relative difference between mutants and wild-type (Left: mutant down-regulated; Right: mutant enriched). Syllables with significant changes in usage, identified by Mann–Whitney U test and post hoc Benjamini–Hochberg correction, are indicated by asterisks (P < 0.05). Right, word clouds representing relative syllable changes in mutants compared to controls. Word color indicates direction of change (red: mutant upregulated; blue: mutant downregulated). Word size is proportional to the difference in usage between mutants and controls. Words are ethological descriptors assigned by reviewers. (C) Normalized classification matrices showing the performance of a classifier trained on syllable usage for mice grouped by line, sex, and genotype. An ideal classification is a value close to 1, shown in white. (D) Linear discriminant analysis plots showing similarity of mutant and wild type groups based on syllable usage signatures. Full description of statistics in SI Appendix, Table S2.
Fig. 5.
Fig. 5.
Motion sequencing shows common changes to behavioral structures in mutant mice. (A) Left, entropy graph. Right, entropy rate graph. (B) State maps showing transition probability changes in mutants relative to wild-type mice. Circles represent syllables, lines represent transitions with red lines showing a higher relative transition probability and blue lines showing a lower relative transition probability. Celsr3C1906Y/+ females (Top Left, Celsr3+/+ n = 26, Celsr3C1906Y/+ n = 22) and males (Bottom Left, Celsr3+/+ n = 21, Celsr3C1906Y/+ n = 20). Celsr3S1894Rfs*2/+, females (Top Middle, Celsr3+/+ n = 25, Celsr3S1894Rfs*2/+ n = 33) and males (Bottom Middle, Celsr3+/+ n = 28, Celsr3S1894Rfs*2/+ n = 48). Wwc1W88C/+ females (Top Right, Wwc1+/+ n = 11, Wwc1W88C/+ n = 16), and males (Bottom Right, Wwc1+/+ n = 12, Wwc1W88C/+ n = 26).
Fig. 6.
Fig. 6.
Celsr3C1906Y/+ and Celsr3S1894Rfs*2/+ mice show enhanced motor responding and reward learning. Male Celsr3+/+ (n = 26), Celsr3C1906Y/+ (n = 30), and female Celsr3+/+ (n = 27), Celsr3S1894Rfs*2/+ (n = 22) mice were trained in a fixed ratio-1 (FR1) paradigm (one nose poke=one pellet). (A) Individual trials with nose poking events color-coded to indicate instantaneous rate. (B) Cumulative number of rewards earned during 90-min sessions across training days. Thin transparent lines represent individual mouse performances. Bold lines show mean cumulative rewards across 1-s bins for mutants (orange = Celsr3C1906Y/+, blue = Celsr3S1894Rfs*2/+) or controls (gray = Celsr3+/+). The rate of cumulative rewards earned is significantly different on all days in mutants vs. wildtypes [P < 0.05, linear regression (day 1), nonlinear regression (days 2 to 4)]. (C) Time required to reach 30 rewards (defaulting to 90 min if failed) graphed over 4 d. Celsr3C1906Y/+ mice have a faster completion time on day 3 (P = 0.027), and Celsr3S1894Rfs/+ mice have a faster completion time on days 2 (P = 0.041) and 3 (P = 0.029, Mann–Whitney U tests). Across all four days, time is significantly shorter for mutant mice (Celsr3C1906Y/+, P = 0.026; Celsr3S1894Rfs*2/+, P = 0.0009). A trend-level effect for reduced latency to retrieve the first reward is observed across days 2 to 4 (Celsr3C1906Y/+, P = 0.093; Celsr3S1894Rfs*2/+, P = 0.075). (D) Fast-scan cyclic voltammetry was performed to measure dopamine release in the dorsal striatum. (E) Representative 3D voltammograms showing background-subtracted current (false color scale) as a function of time (x) and voltage applied (y). (F) Evoked DA (eDA) relative to stimulation intensity, individual trials shown as fine lines and group averages shown as bold lines [genotype × stimulation intensity F(7, 182) = 4.489, P = 0.0001, main effect genotype F(1, 26) = 7.393, P = 0.01]. (G) Characteristic current peaks at 0.6 V and −0.2 V match the oxidation and reduction potentials for DA. (H) Representative eDA waveforms of Celsr3+/+ (n = 3) and Celsr3C1906Y/+ (n = 4) mice. (I) Celsr3C1906Y mice have higher peak eDA in the striatum (unpaired t test, P = 0.002). (J) No differences were seen in the eDA decay time constants (tau). *P < 0.05, **P < 0.01, ***P < 0.001.
Fig. 7.
Fig. 7.
Striatal cholinergic and parvalbumin-expressing interneuron density is normal in Celsr3 and Wwc1 mutant mice. (A) Representative images showing striatal CINs (ChAT+, green) and PVINs (PV+, magenta) in Celsr3C1906Y/+ mice and littermate controls. (B) Quantification of CIN (Left, P = 0.2220) and PVIN density (Middle, P = 0.7735) in Celsr3+/+ (n = 6) and Celsr3C1906Y/+ (n = 6) mice, and cumulative frequency distribution of nearest neighbor (NN) distance of CINs and PVINs (right, Celsr3+/+: solid curve, Celsr3C1906Y/+: dashed curve). (C) Representative images showing striatal CINs (ChAT+, green) and PVINs (PV+, magenta) in Celsr3S1894Rfs*2/+ mice and littermate controls. (D) Quantification of CIN (left, P = 0.8090) and PVIN (Middle, P = 0.1000) density in Celsr3+/+ (n = 6) and Celsr3S1894Rfs*2/+ (n = 6) mice, and cumulative frequency distribution of NN distance of CINs and PVINs (Right, Celsr3+/+: solid curve, Celsr3S1894Rfs*2/+: dashed curve). (E) Representative images showing striatal CINs (ChAT+, green) and PVINs (PV+, magenta) in Wwc1W88C/+ mice and littermate controls. (F) Quantification of CIN (Left, P = 0.4579) and PVIN (Middle, P = 0.2077) density in Wwc1+/+ (n = 6) and Wwc1W88C/+ (n = 6) mice, and cumulative frequency distribution of NN distance of CINs and PVINs (right, Wwc1+/+: solid curve, Wwc1W88C/+: dashed curve). All statistical comparisons were made using Welch’s t tests.

Update of

References

    1. Leckman J. F., King R. A., Bloch M. H., Clinical features of tourette syndrome and tic disorders. J. Obsessive Compuls. Relat. Disord. 3, 372–379 (2014). - PMC - PubMed
    1. Cavanna A. E., Black K. J., Hallett M., Voon V., Neurobiology of the premonitory urge in Tourette’s syndrome: Pathophysiology and treatment implications. J. Neuropsychiatry Clin. Neurosci. 29, 95–104 (2017). - PMC - PubMed
    1. Tinker S. C., Bitsko R. H., Danielson M. L., Newsome K., Kaminski J. W., Estimating the number of people with Tourette syndrome and persistent tic disorder in the United States. Psychiatry Res. 314, 114684 (2022). - PMC - PubMed
    1. Yan J., et al. , The prevalence and comorbidity of tic disorders and obsessive-compulsive disorder in Chinese school students aged 6–16: A National Survey. Brain Sci. 12, 650 (2022). - PMC - PubMed
    1. Heiman G. A., et al. , Empiric recurrence risk estimates for chronic tic disorders: Implications for genetic counseling. Front. Neurol. 11, 770 (2020). - PMC - PubMed

Publication types

LinkOut - more resources