

Evolution of Oxygen Vacancy Sites in Ceria-Based High-Entropy Oxides and Their Role in N2 Activation
- PMID: 38684003
- PMCID: PMC11082846
- DOI: 10.1021/acsami.3c16521
Evolution of Oxygen Vacancy Sites in Ceria-Based High-Entropy Oxides and Their Role in N2 Activation
Abstract
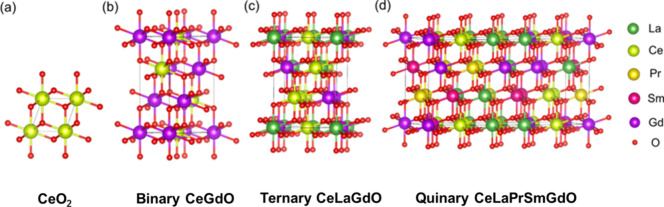
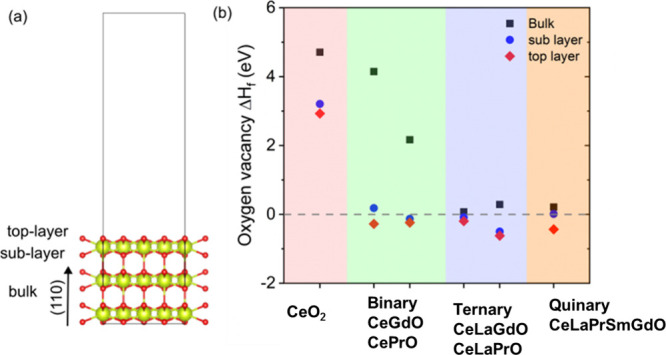
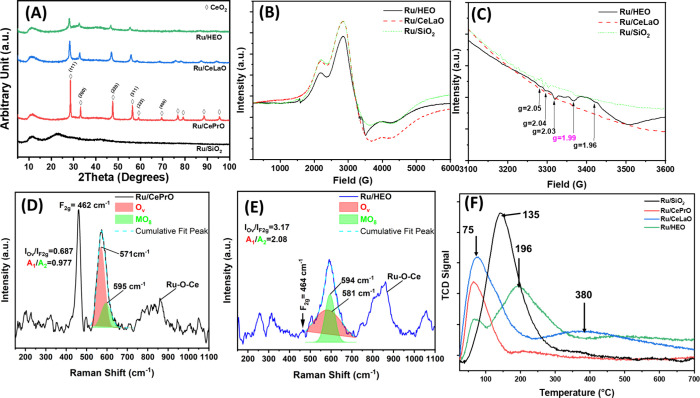
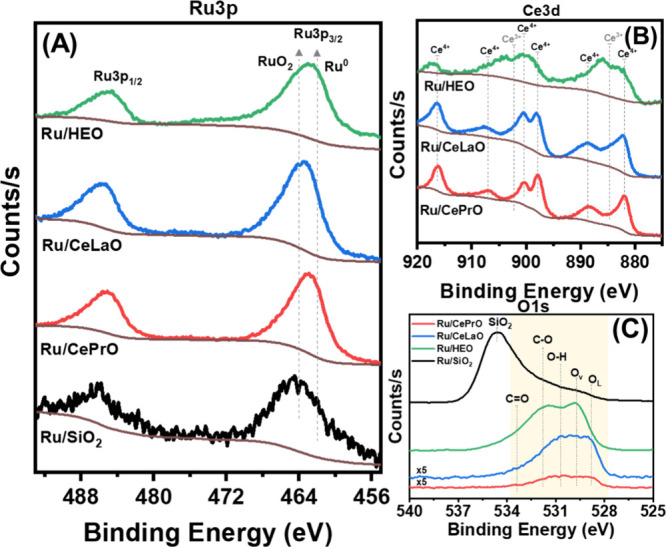
In this work, a relatively new class of materials, rare earth (RE) based high entropy oxides (HEO) are discussed in terms of the evolution of the oxygen vacant sites (Ov) content in their structure as the composition changes from binary to HEO using both experimental and computational tools; the composition of HEO under focus is the CeLaPrSmGdO due to the importance of ceria-related (fluorite) materials to catalysis. To unveil key features of quinary HEO structure, ceria-based binary CePrO and CeLaO compositions as well as SiO2, the latter as representative nonreducible oxide, were used and compared as supports for Ru (6 wt % loading). The role of the Ov in the HEO is highlighted for the ammonia production with particular emphasis on the N2 dissociation step (N2(ads) → Nads) over a HEO; the latter step is considered the rate controlling one in the ammonia production. Density functional theory (DFT) calculations and 18O2 transient isotopic experiments were used to probe the energy of formation, the population, and the easiness of formation for the Ov at 650 and 800 °C, whereas Synchrotron EXAFS, Raman, EPR, and XPS probed the Ce-O chemical environment at different length scales. In particular, it was found that the particular HEO composition eases the Ov formation in bulk, in medium (Raman), and in short (localized) order (EPR); more Ov population was found on the surface of the HEO compared to the binary reference oxide (CePrO). Additionally, HEO gives rise to smaller and less sharp faceted Ru particles, yet in stronger interaction with the HEO support and abundance of Ru-O-Ce entities (Raman and XPS). Ammonia production reaction at 400 °C and in the 10-50 bar range was performed over Ru/HEO, Ru/CePrO, Ru/CeLaO, and Ru/SiO2 catalysts; the Ru/HEO had superior performance at 10 bar compared to the rest of catalysts. The best performing Ru/HEO catalyst was activated under different temperatures (650 vs 800 °C) so to adjust the Ov population with the lower temperature maintaining better performance for the catalyst. DFT calculations showed that the HEO active site for N adsorption involves the Ov site adjacent to the adsorption event.
Keywords: DFT; EPR; Synchrotron EXAFS; ammonia; high entropy oxides; isotopic exchange; oxygen vacancies.
Conflict of interest statement
The authors declare no competing financial interest.
Figures
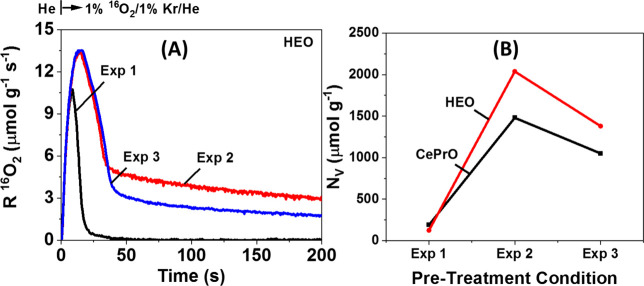
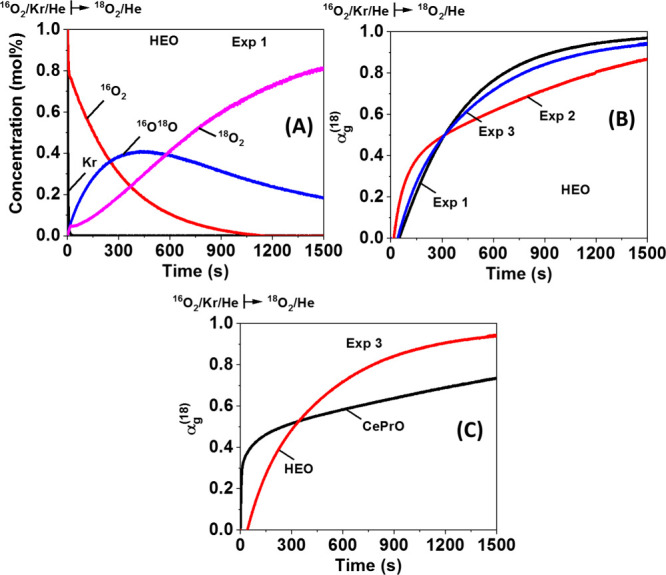
 descriptor as a function of time and pretreatment
procedure, estimated during 18O2-TIIE over HEO;
and (C)
descriptor as a function of time and pretreatment
procedure, estimated during 18O2-TIIE over HEO;
and (C)  descriptor obtained over the both reduced
at 650 °C solids.
descriptor obtained over the both reduced
at 650 °C solids.
References
-
- Mehta P.; Barboun P.; Herrera F. A.; Kim J.; Rumbach P.; Go D. B.; Hicks J. C.; Scheider W. F. Overcoming Ammonia Synthesis Scaling Relations with Plasma-enabled Catalysis. Nat. Catal. 2018, 1, 269–275. 10.1038/s41929-018-0045-1. - DOI
-
- Guo C.; Ran J.; Vasileff A.; Qiao S. Z. Rational Design of Electrocatalysts and Photo(electro)catalysts for Nitrogen Reduction to Ammonia (NH3) under Ambient Conditions. Energy Environ. Sci. 2018, 11, 45–56. 10.1039/C7EE02220D. - DOI
-
- Kordali V.; Kyriacou G.; Lambrou Ch. Electrochemical Synthesis of Ammonia at Atmospheric Pressure and Low Temperature in a Solid Polymer Electrolyte Cell. Chem. Commun. 2000, 1673–1674. 10.1039/b004885m. - DOI
-
- Tao H.; Choi C.; Ding L. X.; Jiang Z.; Han Z.; Jia M.; Fan Q.; Gao Y.; Wang H.; Robertson A. W.; Hong S.; Jung Y.; Liu S.; Sun Z. Nitrogen Fixation by Ru Single-Atom Electrocatalytic Reduction. Chem. 2019, 5, 204–214. 10.1016/j.chempr.2018.10.007. - DOI
-
- Yao H. C.; Yao Y. F. Ceria in Automotive Exhaust Catalysts: I. Oxygen Storage. J. Catal. 1984, 86, 254–265. 10.1016/0021-9517(84)90371-3. - DOI
LinkOut - more resources
Full Text Sources
