. 2024 Aug 1;144(5):510-524.
doi: 10.1182/blood.2023021990.

T-bet suppresses proliferation of malignant B cells in chronic lymphocytic leukemia

Affiliations

T-bet suppresses proliferation of malignant B cells in chronic lymphocytic leukemia

Philipp M Roessner et al. Blood. .

Abstract

The T-box transcription factor T-bet is known as a master regulator of the T-cell response but its role in malignant B cells has not been sufficiently explored. Here, we conducted single-cell resolved multi-omics analyses of malignant B cells from patients with chronic lymphocytic leukemia (CLL) and studied a CLL mouse model with a genetic knockout of Tbx21. We found that T-bet acts as a tumor suppressor in malignant B cells by decreasing their proliferation rate. NF-κB activity, induced by inflammatory signals provided by the microenvironment, triggered T-bet expression, which affected promoter-proximal and distal chromatin coaccessibility and controlled a specific gene signature by mainly suppressing transcription. Gene set enrichment analysis identified a positive regulation of interferon signaling and negative control of proliferation by T-bet. In line, we showed that T-bet represses cell cycling and is associated with longer overall survival of patients with CLL. Our study uncovered a novel tumor suppressive role of T-bet in malignant B cells via its regulation of inflammatory processes and cell cycling, which has implications for the stratification and therapy of patients with CLL. Linking T-bet activity to inflammation explains the good prognostic role of genetic alterations in the inflammatory signaling pathways in CLL.


Conflict of interest statement

Conflict-of-interest disclosure: C.S. received research funding from Genmab. A.V.D. received consulting fees from AbbVie, AstraZeneca, BeiGene, Bristol Meyers Squibb, Genentech, Genmab, Incyte, Janssen, Lilly Oncology, MEI Pharma, Nurix, Oncovalent, Pharmacyclics, and TG Therapeutics; and has ongoing research funding from AbbVie, AstraZeneca, Bayer Oncology, Bristol Meyers Squibb, Cyclacel, Lilly Oncology, MEI Pharma, Nurix, and Takeda Oncology. A.W. received research support from Pharmacyclics LLC, an AbbVie Company, Acerta Pharma, a member of the AstraZeneca group, Merck, Nurix, Verastem, and Genmab. J.A.B. received research funding from Pharmacyclics LLC and BeiGene; served on the advisory board for Janssen, Gilead, TG Therapeutics, Pharmacyclics LLC, BeiGene, and Novartis. The remaining authors declare no competing financial interests.

Figures

None
Graphical abstract
Figure 1.
Figure 1.
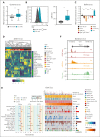
TBX21 expression is higher in CLL cells than in B cells of healthy donors. (A) Gene expression of TBX21 in CLL cells (n = 41) and B cells from age-matched healthy controls (HC B cells; n = 11). P values were obtained by the unpaired t test. (B) Flow cytometric analysis of T-bet levels in CLL cells (n = 20) and B cells from age-matched healthy controls (n = 5). P values were obtained by the unpaired t test. (C) Gene expression of TBX21 in untransformed B-cell subsets (n = 5-7) and CLL cells (n = 10). Bar limits indicate mean expression and error bars indicate standard error of the mean. P values were obtained by the 1-way analysis of variance (ANOVA), controlling the false discovery rate (FDR) using the Benjamini-Hochberg (BH) method. (D) Expression of ABC marker genes in CLL cells (n = 10) and untransformed B-cell subsets (n = 5-7). High (green) and low (blue) expressions in the ABCs are depicted on the right. (E) Analysis of the association between TBX21 gene expression and the presence of specific driver genetic alterations. Point estimates with 95% confidence intervals were calculated for the whole CLL cohort and IGHV subtypes using 2-sided t tests and controlling the FDR using the BH method. The point estimates represent the difference between the mean TBX21 expression in individuals with CLL with and without each corresponding alteration. The point estimates were color-coded based on FDR. The OncoPrint shows the association of genetic driver alterations with higher or lower expression of TBX21, along with additional clinical information such as IGHV status, time to first treatment, and patient status (treated/untreated). Samples are ordered from lower to higher TBX21 gene expression. Monoclonal B lymphocytosis cases are excluded from this analysis. Genetic driver alterations are depicted using distinct colors corresponding to the alteration type. The number of samples with mutations, as well as the percentage of mutated samples over the whole cohort, is shown on the right. The analyzed data set consisted of gene expression microarray data from 364 CLL samples. (F) Chromatin landscape of TBX21 showing the median ATAC-seq, H3K27ac chromatin immunoprecipitation sequencing and positive-strand RNA-seq levels from 7 patients with CLL and 15 samples from 4 different B-cell subpopulations of healthy controls (naïve, germinal center, memory B cells, and plasma cells). ∗P ≤ .05; ∗∗P < .01; ∗∗∗P < .001; ∗∗∗∗P < .0001.
Figure 2.
Figure 2.
Inflammatory signals from activated T cells drive TBX21 expression in CLL cells via NF-κB. (A) Log2-transformed TBX21 gene expression in CLL cells (n = 5) cultured alone, after coculture with CD40L-expressing fibroblasts, or in vitro–activated autologous T cells. P values were obtained by RM 1-way ANOVA and controlling the FDR using the BH method. (B-C) Flow cytometric analysis of T-bet levels in CLL cells. (B) CLL peripheral blood mononuclear cells (PBMCs) (n = 7) or (C) purified CLL cells (n = 11) were stimulated with various cytokines and combinations thereof. The induction of T-bet expression was compared with that in the medium control. P values were obtained by 1-sample t tests and Wilcoxon signed-rank tests and by controlling the FDR using the BH method. (D) Flow cytometric analysis of T-bet levels in CLL cells of patients before ibrutinib treatment and after 3 and 6 months of ibrutinib treatment (n = 8). P values were obtained by RM 1-way ANOVA and controlling the FDR using the BH method. (E) TBX21 gene expression in CLL cells of patients before acalabrutinib treatment and after 1 and 6 months of acalabrutinib treatment (n = 20). P values were obtained by RM 1-way ANOVA and controlling the FDR using the BH method. (F-G) Flow cytometric analysis of T-bet levels in CLL cells after stimulation of CLL PBMCs with various cytokines and combinations thereof. (F) Cells (n = 7) were stimulated in the presence of vehicle control or ibrutinib. Quantification displays log2FC in comparison to the vehicle control. P values were obtained by RM 1-way ANOVA and controlling the FDR using the BH method. (G) Purified CLL cells (n = 8) were stimulated in the presence of the vehicle control or the NF-κB inhibitor IKK-16. Quantification displays log2FC in comparison with vehicle control. P values were obtained using the Friedman test and controlling the FDR using the BH method. (H) T-bet levels of 2 individual TCL1 CLL clones harboring hyperactive NF-κB signaling (Nfkbie–/–) compared with WT controls, as analyzed by flow cytometry (n = 3 technical replicates). ns, not significant. ∗P ≤ .05; ∗∗P < .01; ∗∗∗P < .001; ∗∗∗∗P < .0001.
Figure 3.
Figure 3.
T-bet has lineage-separating properties in CLL. (A) Expression of T-bet–dependent genes in untransformed B-cell subsets (n = 5-7) and CLL cells (n = 10). (B-C) Activity scores of T-bet were calculated based on (B) induced and (C) repressed genes individually for untransformed B-cell subsets and CLL cells. P values were obtained by 1-way ANOVA and controlling the FDR using the BH method. (D) Correlation between TBX21 gene expression and T-bet activity. P values were obtained using Pearson correlation testing. (E-F) Analysis of B-cell subsets in the human tonsil atlas with a representation of T-bet expression in different clusters. (F) T-bet activity scores in human tonsillar B cells calculated based on induced genes by T-bet in the CLL cells. P values were obtained using the Mann-Whitney test. ∗∗P < .01; ∗∗∗∗P < .0001.
Figure 4.
Figure 4.
T-bet regulates gene transcription mainly via distal chromatin coaccessibility in CLL cells. (A) T-bet–mediated regulation of T-bet-dependent genes. Promoter with an ATAC peak containing a T-bet binding motif, blue; coaccessible link of the promoter to the distal T-bet peak within 1 Mb, yellow; no link to the T-bet motif peak, gray. (B) Number of coaccessible links from T-bet–dependent gene promoters without (left) or with (right) ATAC peak with T-bet binding motif within a 1 Mb window in Tbx21–/– and Tbx21+/+ TCL1 cells. Whiskers represent the standard error of biological replicates (n = 2). (C) Overlap of coaccessible links from T-bet–dependent genes with distal T-bet peaks within 100 kb in Tbx21–/– and Tbx21+/+ TCL1 cells. The coaccessible links from the biological replicates were merged. (D) Gene expression of Nos1 in Tbx21–/– (n = 6) and Tbx21+/+ TCL1 cells (n = 5) from bulk RNA-seq data. (E) Coaccessibility in Tbx21–/– and Tbx21+/+ TCL1 cells at the T-bet-dependent gene Nos1 region. Browser tracks and coaccessible links from the biological replicates were merged. Top: browser tracks of pseudobulk chromatin accessibility from single cells. Middle: 2 kb regions around peaks from pseudobulk chromatin accessibility with no accessibility change (gray), significantly higher accessibility in Tbx21+/+ TCL1 cells (black), and significantly higher accessibility in Tbx21–/– TCL1 cells (blue); T-bet binding motif positions and gene annotation in black. Bottom: coaccessible links between peaks at Nos1 promoters and distal peaks in Tbx21–/– and Tbx21+/+ TCL1 cells. Promoters of Nos1 (1 kb around the TSS1-3) are marked in red.
Figure 5.
Figure 5.
T-bet is required for interferon signaling in CLL cells. (A) GSEA of RNA-seq of Tbx21–/– (n = 6) vs Tbx21+/+ (n = 6) TCL1 cells and TBX21low vs TBX21high CLL cells was performed, and commonly regulated gene sets are depicted. (B) KEGG pathway analysis of RNA-seq and MS data of T-betlow vs T-bethigh CLL cells. (C) Basal expression of ISGs in Tbx21–/– compared with Tbx21+/+ TCL1 cells, as analyzed by RNA-seq. (D) Purified Tbx21–/– and Tbx21+/+ TCL1 cells were stimulated in vitro with IFNβ. Log2FC of ISG expression in comparison with the medium control, as analyzed by quantitative reverse transcription polymerase chain reaction. P values were obtained by multiple t tests and controlling the FDR using the BH method. NES, normalized enrichment score. ∗P ≤ .05; ∗∗P < .01; ∗∗∗P < .001; ∗∗∗∗P < .0001.
Figure 6.
Figure 6.
T-bet acts as a silencing TF in CLL cells. (A-B) Differential chromatin accessibility in (A) Tbx21–/– vs Tbx21+/+ TCL1 cells analyzed by scATAC-seq and (B) TBX21low vs TBX21high CLL cells analyzed by ATAC-seq (FDR 0.05). The numbers of up- and downregulated peaks are indicated. (C) Motif enrichment analysis of the ATAC-seq data was performed individually for U-CLL, M-CLL, and TCL1 cells. Commonly enriched motifs are displayed.
Figure 7.
Figure 7.
T-bet represses cell cycling in CLL cells and predicts a good outcome. (A) scRNA-seq of Tbx21–/– and Tbx21+/+ TCL1 cells was performed and single cells were annotated according to their cell cycle phase. (B) Phospho-specific MS analysis of Tbx21–/– and Tbx21+/+ TCL1 cells was performed and kinase networks enriched in Tbx21–/– TCL1 cells are displayed. (C) The T-bet activity score based on repressed genes was calculated from scRNA-seq data of CLL lymph node samples annotated according to their proliferation status. (D) MEC-1 cell lines with inducible overexpression of T-bet or green fluorescent protein (GFP) as control were generated. Using doxycycline, overexpression was induced and expansion of GFP+ control cells and T-bet-overexpressing MEC-1 cells was analyzed using the CellTiter Glo proliferation assay (n = 4 biological replicates á 3 technical replicates). P values were obtained by unpaired t test of the means of biological replicates. (E-G) RNA-seq of patient samples with CLL was performed at diagnosis. Patients with CLL were stratified according to TBX21 mRNA abundance using the maximally selected rank statistics-based cutoff. (E) The OS of TBX21high vs TBX21low patients with CLL was analyzed. (F) Patients with CLL were stratified according to TBX21 mRNA abundance using the maximally selected rank statistics-based cutoff and their IGHV mutational status (M = mutated vs UM = unmutated). The OS of M-TBX21high, M-TBX21low, UM-TBX21high, and UM-TBX21low patients with CLL was analyzed. (G) Patients with CLL were stratified according to TBX21 mRNA abundance using the maximally selected rank and statistics-based cutoff and their ZAP70 gene expression level (ZAP70high vs ZAP70low). The OS of ZAP70high-TBX21high, ZAP70high-TBX21low, ZAP70low-TBX21high, and ZAP70low-TBX21low patients with CLL was analyzed. P values were obtained by log-rank testing. mRNA, messenger RNA. ∗P ≤ .05.

Comment in

References

    1. Szabo SJ, Kim ST, Costa GL, Zhang X, Fathman CG, Glimcher LH. A novel transcription factor, T-bet, directs Th1 lineage commitment. Cell. 2000;100(6):655–669. - PubMed
    1. Sullivan BM, Juedes A, Szabo SJ, von Herrath M, Glimcher LH. Antigen-driven effector CD8 T cell function regulated by T-bet. Proc Natl Acad Sci U S A. 2003;100(26):15818–15823. - PMC - PubMed
    1. Townsend MJ, Weinmann AS, Matsuda JL, et al. T-bet regulates the terminal maturation and homeostasis of NK and Valpha14i NKT cells. Immunity. 2004;20(4):477–494. - PubMed
    1. Hao Y, O'Neill P, Naradikian MS, Scholz JL, Cancro MP. A B-cell subset uniquely responsive to innate stimuli accumulates in aged mice. Blood. 2011;118(5):1294–1304. - PMC - PubMed
    1. Rubtsov AV, Rubtsova K, Fischer A, et al. Toll-like receptor 7 (TLR7)-driven accumulation of a novel CD11c(+) B-cell population is important for the development of autoimmunity. Blood. 2011;118(5):1305–1315. - PMC - PubMed

Publication types

MeSH terms