

Dynamic cerebral autoregulation is preserved during orthostasis and intrathoracic pressure regulation in healthy subjects: A pilot study
- PMID: 38684421
- PMCID: PMC11058003
- DOI: 10.14814/phy2.16027
Dynamic cerebral autoregulation is preserved during orthostasis and intrathoracic pressure regulation in healthy subjects: A pilot study
Abstract
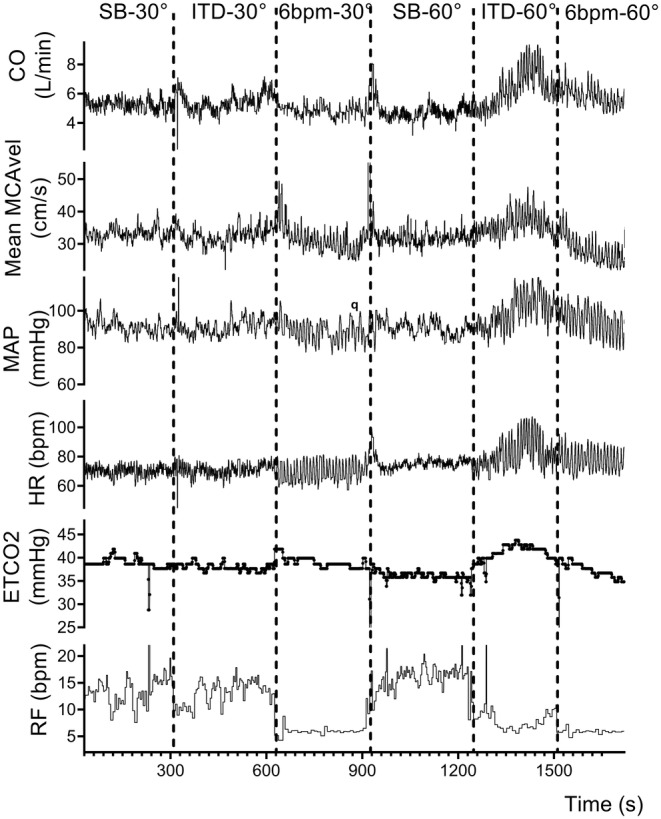
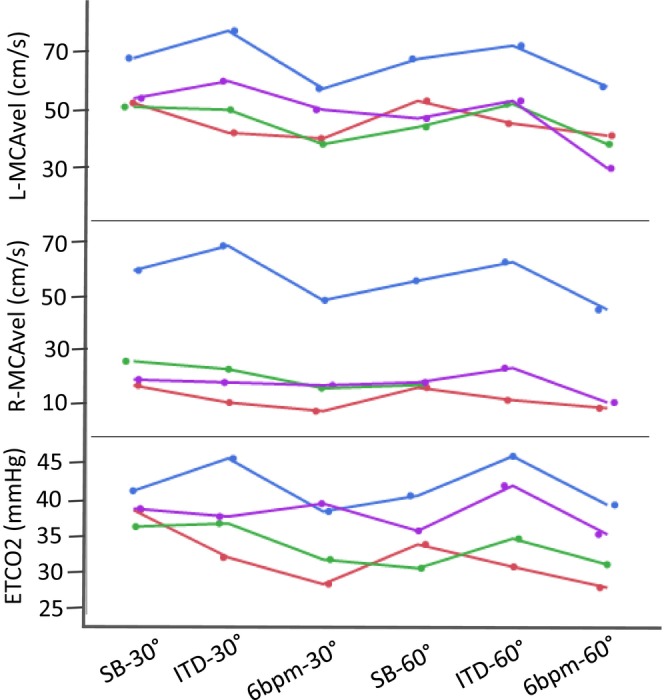
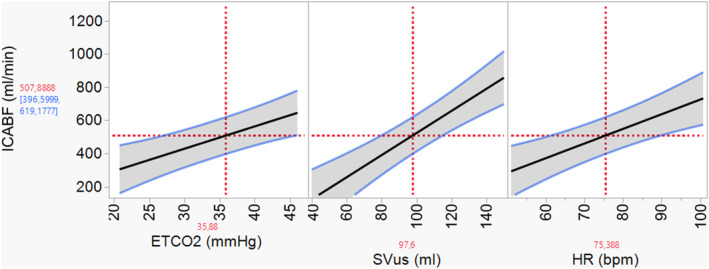
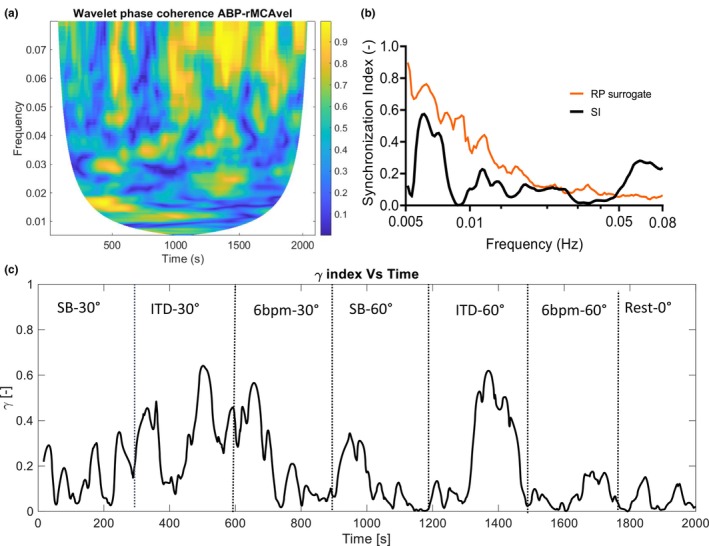
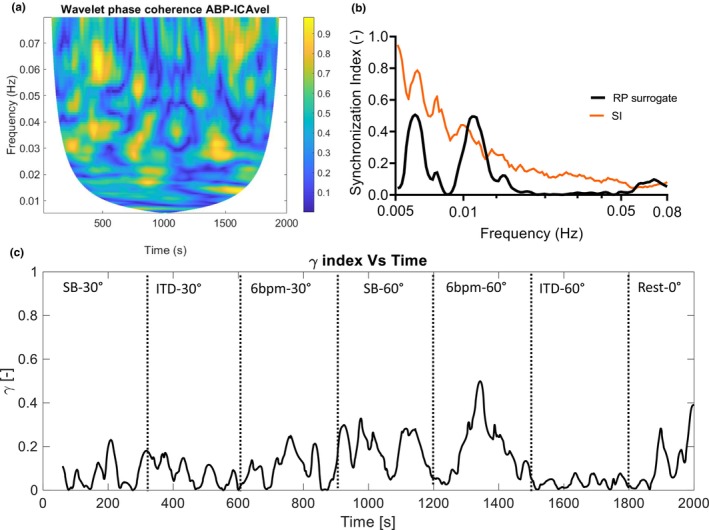
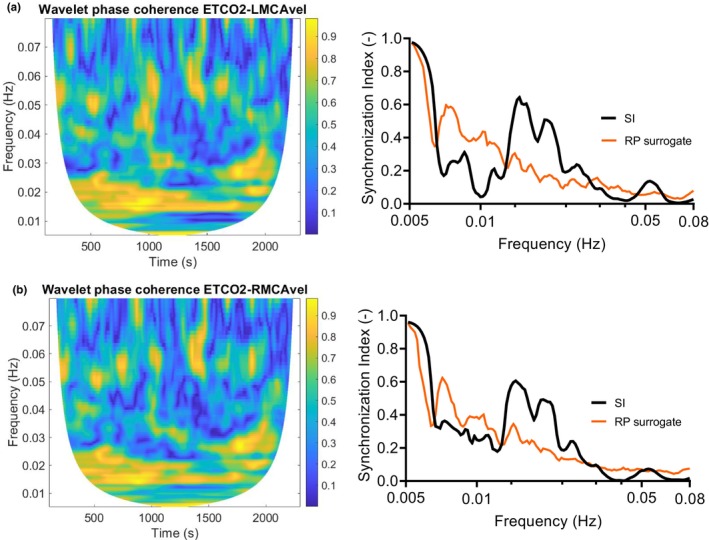
Resistance breathing may restore cardiac output (CO) and cerebral blood flow (CBF) during hypovolemia. We assessed CBF and cerebral autoregulation (CA) during tilt, resistance breathing, and paced breathing in 10 healthy subjects. Blood velocities in the internal carotid artery (ICA), middle cerebral arteries (MCA, four subjects), and aorta were measured by Doppler ultrasound in 30° and 60° semi-recumbent positions. ICA blood flow and CO were calculated. Arterial blood pressure (ABP, Finometer), and end-tidal CO2 (ETCO2) were recorded. ICA blood flow response was assessed by mixed-models regression analysis. The synchronization index (SI) for the variable pairs ABP-ICA blood velocity, ABP-MCA velocities in 0.005-0.08 Hz frequency interval was calculated as a measure of CA. Passive tilting from 30° to 60° resulted in 12% decrease in CO (p = 0.001); ICA blood flow tended to fall (p = 0.04); Resistance breathing restored CO and ICA blood flow despite a 10% ETCO2 drop. ETCO2 and CO contributed to ICA blood flow variance (adjusted R2: 0.9, p < 0.0001). The median SI was low (<0.2) indicating intact CA, confirmed by surrogate date testing. The peak SI was transiently elevated during resistance breathing in the 60° position. Resistance breathing may transiently reduce CA efficiency. Paced breathing did not restore CO or ICA blood flow.
Keywords: cerebral autoregulation; hemodynamics; impedance threshold device; passive tilting; resistance breathing; synchronization index.
© 2024 The Authors. Physiological Reports published by Wiley Periodicals LLC on behalf of The Physiological Society and the American Physiological Society.
Conflict of interest statement
We confirm that none of the authors has any conflicts of interests.
Figures
Similar articles
-
Internal carotid artery blood flow in healthy awake subjects is reduced by simulated hypovolemia and noninvasive mechanical ventilation.Physiol Rep. 2016 Oct;4(19):e12969. doi: 10.14814/phy2.12969. Physiol Rep. 2016. PMID: 27702883 Free PMC article.
-
Cerebrovascular response to the cold pressor test - the critical role of carbon dioxide.Exp Physiol. 2017 Dec 1;102(12):1647-1660. doi: 10.1113/EP086585. Epub 2017 Oct 15. Exp Physiol. 2017. PMID: 28925529 Clinical Trial.
-
Dynamic cerebral autoregulation is preserved during isometric handgrip and head-down tilt in healthy volunteers.Physiol Rep. 2018 Mar;6(6):e13656. doi: 10.14814/phy2.13656. Physiol Rep. 2018. PMID: 29595918 Free PMC article.
-
Cerebral blood flow response to cardiorespiratory oscillations in healthy humans.Auton Neurosci. 2023 Mar;245:103069. doi: 10.1016/j.autneu.2022.103069. Epub 2022 Dec 23. Auton Neurosci. 2023. PMID: 36584666 Review.
-
Contribution of flow-dependent vasomotor mechanisms to the autoregulation of cerebral blood flow.J Vasc Res. 2012;49(5):375-89. doi: 10.1159/000338747. Epub 2012 Jun 22. J Vasc Res. 2012. PMID: 22739136 Free PMC article. Review.
References
-
- Addison, P. S. (2015). A review of wavelet transform time‐frequency methods for NIRS‐based analysis of cerebral autoregulation. IEEE Reviews in Biomedical Engineering, 8, 78–85. - PubMed
-
- Al‐Kawaz, M. , Cho, S. M. , Gottesman, R. F. , Suarez, J. I. , & Rivera‐Lara, L. (2022). Impact of cerebral autoregulation monitoring in cerebrovascular disease: A systematic review. Neurocritical Care, 36, 1053–1070. - PubMed
-
- Bari, V. , de Maria, B. , Mazzucco, C. E. , Rossato, G. , Tonon, D. , Nollo, G. , Faes, L. , & Porta, A. (2017). Cerebrovascular and cardiovascular variability interactions investigated through conditional joint transfer entropy in subjects prone to postural syncope. Physiological Measurement, 38, 976–991. - PubMed
-
- Benjamini, Y. , & Hochberg, Y. (1995). Controlling the false discovery rate: A practical and powerful approach to multiple testing. Journal of the Royal Statistical Society: Series B: Methodological, 57, 289–300.
Publication types
MeSH terms
LinkOut - more resources
Full Text Sources
Miscellaneous
