. 2024 May;41(5):921-935.
doi: 10.1007/s11095-024-03704-3. Epub 2024 Apr 29.

Nicotinamide Mononucleotide and Nicotinamide Riboside Reverse Ovarian Aging in Rats Via Rebalancing Mitochondrial Fission and Fusion Mechanisms

Affiliations

Nicotinamide Mononucleotide and Nicotinamide Riboside Reverse Ovarian Aging in Rats Via Rebalancing Mitochondrial Fission and Fusion Mechanisms

Nazli Pinar Arslan et al. Pharm Res. 2024 May.

Erratum in

Abstract

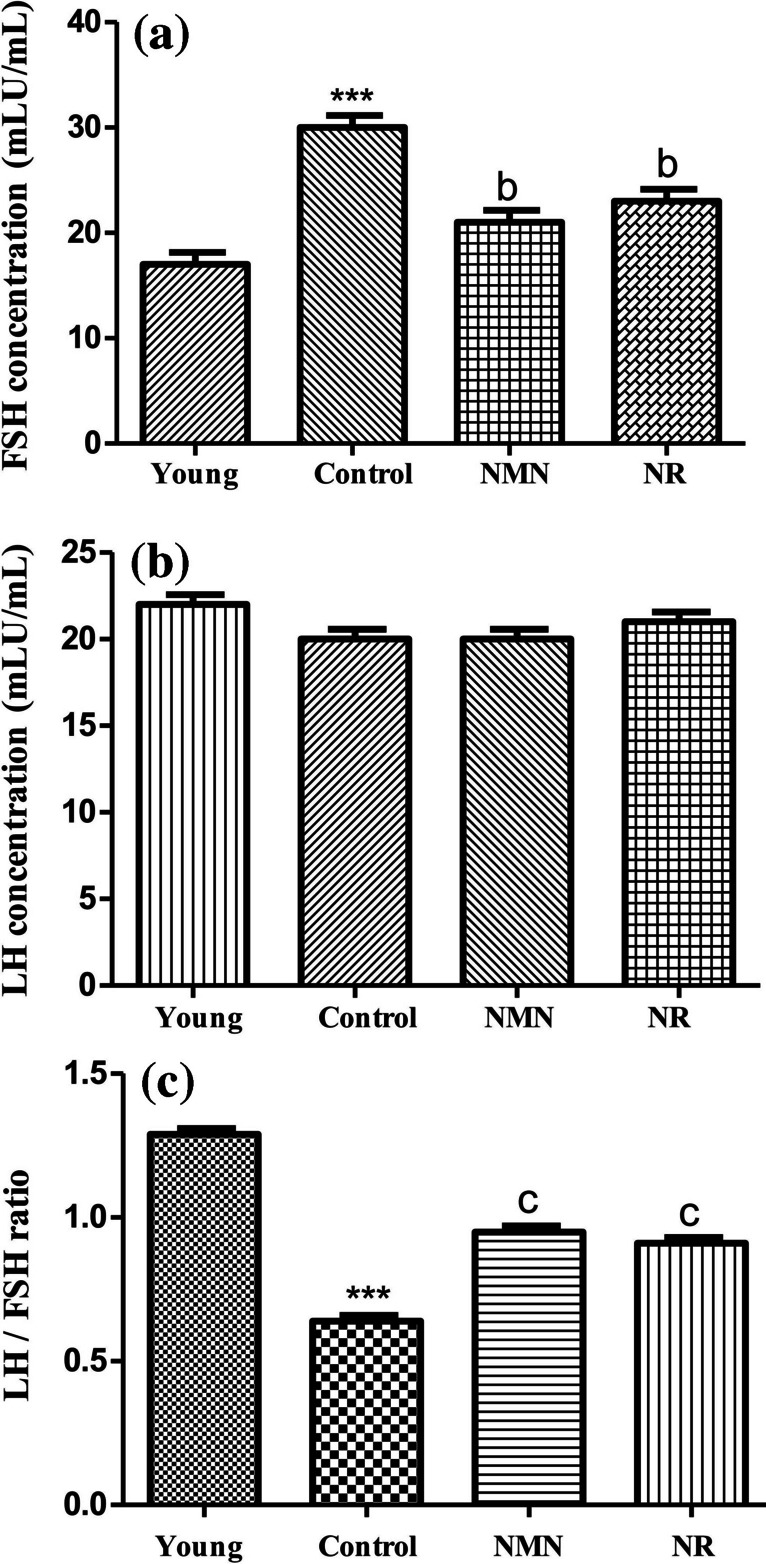
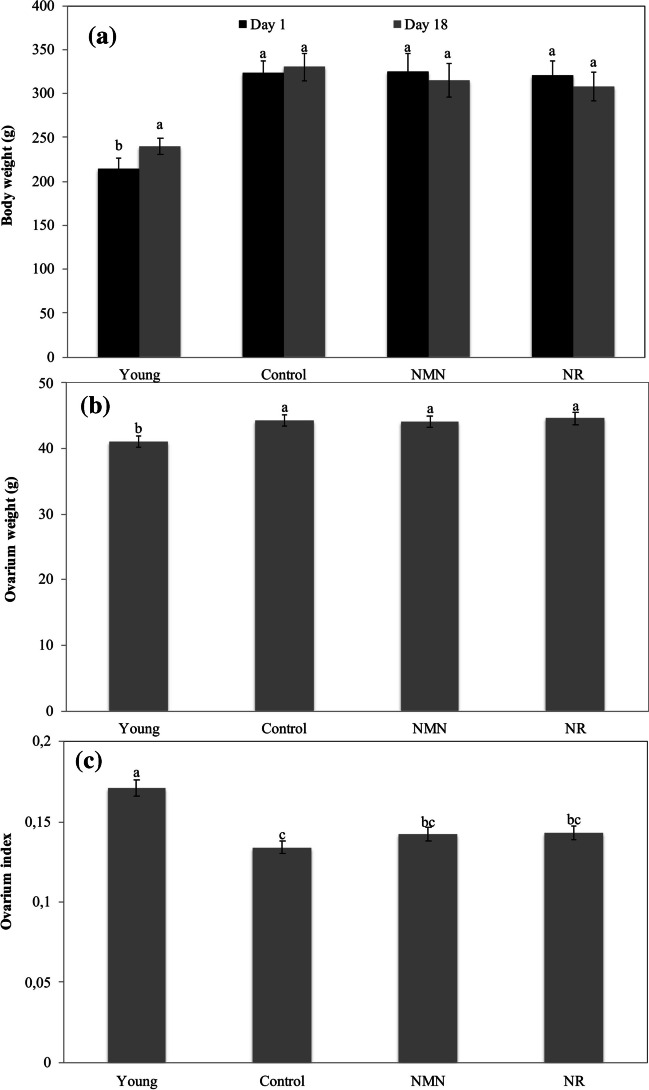
Purpose: This study examined the effects of nicotinamide mononucleotide (NMN) and nicotinamide riboside (NR) on folliculogenesis and mitochondrial dynamics (fission and fusion mechanisms) in ovaries of middle-aged female rats.

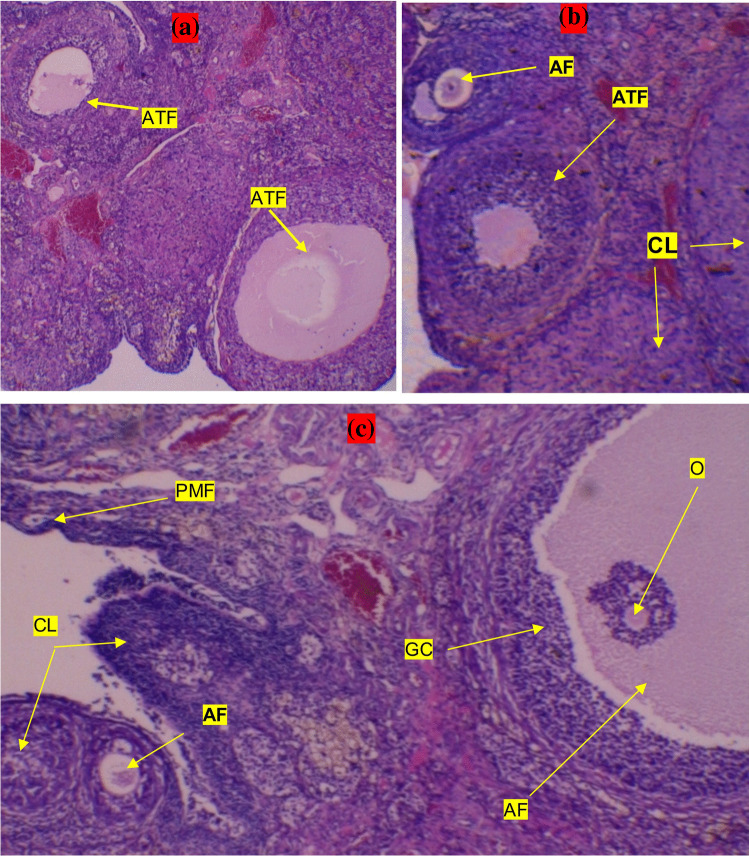
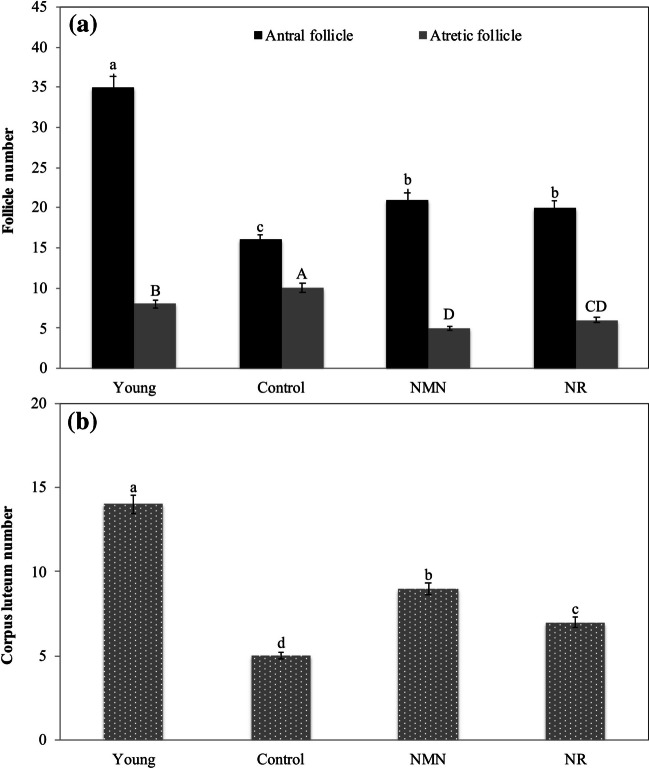
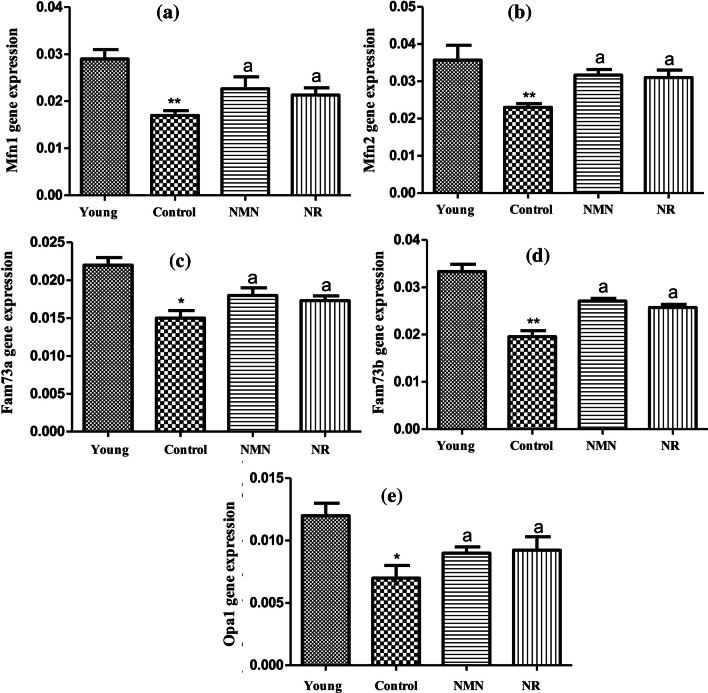
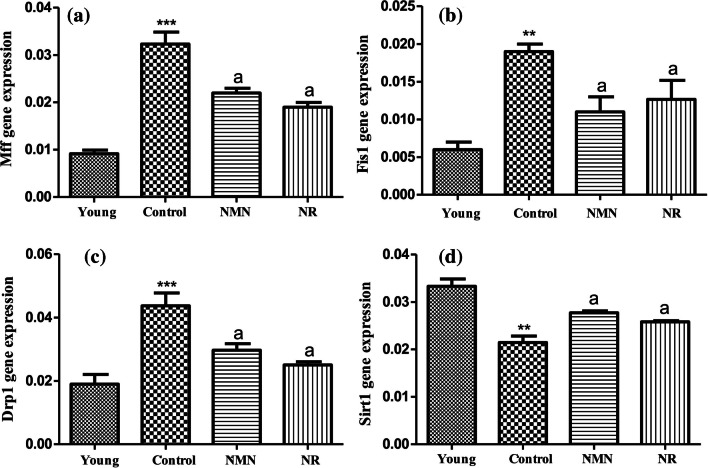
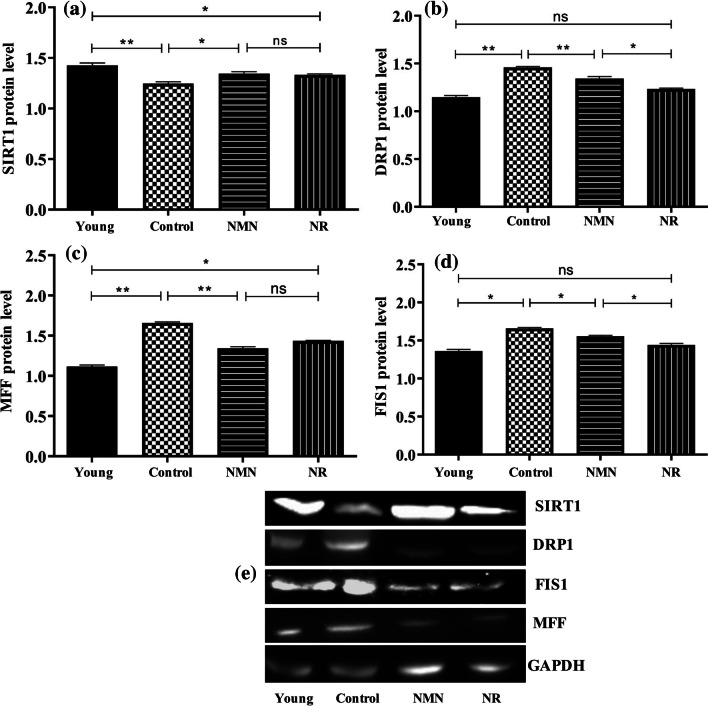
Methods: Experimental groups were young, middle-aged (control), middle-aged + NMN and middle-aged + NR. NMN was administered at a concentration of 500 mg/kg intraperitoneally but NR at a concentration of 200 mg/kg by gavage. Follicle stimulating hormone (FSH) and luteinizing hormone (LH) levels were analyzed by ELISA. Hematoxylin-eosin staining sections were used for histopathological examination and follicles-counting. Expression levels of mitochondrial fission (Drp1, Mff and Fis1) and fusion (Mfn1, Mfn2, Opa1, Fam73a and Fam73b) genes as well as Sirt1 gene were analyzed by RT-PCR. Expression levels of fission-related proteins (DRP1, MFF, FIS1 and SIRT1) were analyzed by Western Blot.

Results: Higher ovarian index, more corpus luteum and antral follicles were detected in NMN and NR groups compared to the control. NMN or NR could rebalance LH/FSH ratio. The control group was determined to possess higher expression levels of fission genes and lower expression levels of fusion genes when compared the young group. In comparison with the control group, both NMN and NR group were found to exhibit less mitochondrial fission but more mitochondrial fussion. Higher gene and protein levels for Sirt1 were measured in NMN and NR groups compared to the control group.

Conclusion: This study reveals that NMN alone or NR alone can rebalance mitochondrial dynamics by decreasing excessive fission in middle-aged rat ovaries, thus alleviating mitochondrial stress and correcting aging-induced folliculogenesis abnormalities.

Keywords: NAD+ precursor; anti-aging; dynamine-related protein 1; mitochondrial dynamics; sirtuins.


Conflict of interest statement

The authors declare that they have no known competing financial interests or personal relationships that could have appeared to influence the work reported in this studies.

Figures

Fig. 1
Fig. 1
Variation of FSH and LH ratios in experimental groups. Analyses were performed on day 18. Data were calculated as mean ± standard deviation. *** p < 0.001 vs young, b p < 0.01 vs control and c p < 0.001 vs control (a p < 0.05, b p < 0.01, c p < 0.001 and n = 3). Young group included 5 months-rats. Control, NMN and NR groups included middle-aged rats (12 months). Phosphate-buffered saline (PBS) was injected or orally given to the control group. NMN prepared in PBS was administered intraperitoneally at 500 mg/kg concentration (middle-aged NMN group) and NR was administered orally at 200 mg/kg concentration by gavage (middle-aged NMN group). Both NMN and NR was applied for 17 days (total of 17 doses
Fig. 2
Fig. 2
Change of body and ovarian weights in groups. Ovarian weights were measured on day 18. Body weights were measured on days 1 and 18. The values measured for ovarian weight were statistically evaluated among themselves. Similarly, the values measured for body weights were statistically evaluated among themselves. *The difference between the values ​​indicated with the same letters on figure column is not statistically significant (p ≤ 0.05).)
Fig. 3
Fig. 3
Examination of follicles and corpus luteum in hematoxylin–eosin staining sections. A, B and C indicate control, NR and NMN groups, respectively. PF, primer follicle; PMF, primordial follicle; AF, antral follicle; ATF, atretic follicles; CL, corpus luteum; GC, granulosa cells and O, oocyt. Sections were examined under light microscope (× 10 magnification)
Fig. 4
Fig. 4
Enumeration of follicles and corpus luteum in treatments groups. Analyses were performed on day 18. Statistical differences in the number of antral follicles are shown in lower letters, whereas statistical differences in the number of atretic follicles are shown in capital letters. The numbers of antral follicles and atretic follicles were not compared statistically with each other. The difference between the values ​​indicated with the same letters on figure column is not statistically significant (p ≤ 0.05)
Fig. 5
Fig. 5
Expression changes of mitochondrial fusion-related genes relative to the β-actin control gene. Mfn1 (A), Mfn2 (B), Fam73a (C), Fam73b (D), and Opa1 (E). Data were calculated as mean ± standard deviation. *** p < 0.001 vs Young, ** p < 0.01 vs young, * p < 0.05 vs young, a p < 0.05 vs Control (a p < 0.05, b p < 0.01, c p < 0.001 and n = 3)
Fig. 6
Fig. 6
Changes in expression levels of mitochondrial fission-related genes relative to the β-actin control gene. Mff (A), Fis1 (B), Drp1 (C) and Sirt1 (D). Data were calculated as mean ± standard deviation. *** p < 0.001 vs Young, ** p < 0.01 vs young, * p < 0.05 vs young, a p < 0.05 vs Control (a p < 0.05, b p < 0.01, c p < 0.001 and n = 3)
Fig. 7
Fig. 7
Changes in expression levels of mitochondrial fission-related proteins relative to the GAPDH. SIRT1 (A), DRP1 (B), MFF (C), FIS1 (D) and protein bands (E). Unpaired t test was applied to the groups. p > 0.05 = ns (not significant), p < 0.05 = * significant, p < 0.01 = * very significant, p < 0.001 = ** highly significant

Similar articles

Cited by

References

    1. Suárez-Rivero JM, Villanueva-Paz M, de la Cruz-Ojeda P, De la Mata M, Cotán D, Oropesa-Ávila M, et al. Mitochondrial dynamics in mitochondrial diseases. Diseases. 2016;5:1. doi: 10.3390/diseases5010001. - DOI - PMC - PubMed
    1. Tilokani L, Nagashima S, Paupe V, Prudent J. Mitochondrial dynamics: overview of molecular mechanisms. Essays Biochem. 2018;62:341–360. doi: 10.1042/EBC20170104. - DOI - PMC - PubMed
    1. Chan DC. Mitochondrial fusion and fission in mammals. Annu Rev Cell Dev Biol. 2006;22:79–99. doi: 10.1146/annurev.cellbio.22.010305.104638. - DOI - PubMed
    1. Westermann B. Molecular machinery of mitochondrial fusion and fission. J Biol Chem. 2008;283:13501–13505. doi: 10.1074/jbc.R800011200. - DOI - PubMed
    1. Grohm J, Kim SW, Mamrak U, Tobaben S, Cassidy-Stone A, Nunnari J, et al. Inhibition of Drp1 provides neuroprotection in vitro and in vivo. Cell Death Differ. 2012;19:1446–1458. doi: 10.1038/cdd.2012.18. - DOI - PMC - PubMed

MeSH terms