. 2024 Apr;56(4):3814-3830.
doi: 10.3758/s13428-024-02416-1. Epub 2024 Apr 29.

Quantifying accuracy and precision from continuous response data in studies of spatial perception and crossmodal recalibration

Affiliations

Quantifying accuracy and precision from continuous response data in studies of spatial perception and crossmodal recalibration

Patrick Bruns et al. Behav Res Methods. 2024 Apr.

Abstract

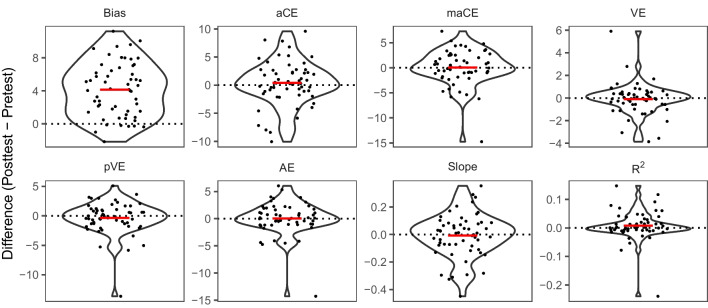
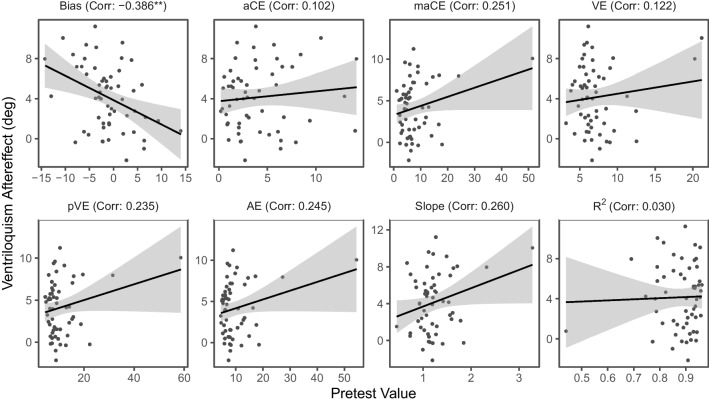
The ability to detect the absolute location of sensory stimuli can be quantified with either error-based metrics derived from single-trial localization errors or regression-based metrics derived from a linear regression of localization responses on the true stimulus locations. Here we tested the agreement between these two approaches in estimating accuracy and precision in a large sample of 188 subjects who localized auditory stimuli from different azimuthal locations. A subsample of 57 subjects was subsequently exposed to audiovisual stimuli with a consistent spatial disparity before performing the sound localization test again, allowing us to additionally test which of the different metrics best assessed correlations between the amount of crossmodal spatial recalibration and baseline localization performance. First, our findings support a distinction between accuracy and precision. Localization accuracy was mainly reflected in the overall spatial bias and was moderately correlated with precision metrics. However, in our data, the variability of single-trial localization errors (variable error in error-based metrics) and the amount by which the eccentricity of target locations was overestimated (slope in regression-based metrics) were highly correlated, suggesting that intercorrelations between individual metrics need to be carefully considered in spatial perception studies. Secondly, exposure to spatially discrepant audiovisual stimuli resulted in a shift in bias toward the side of the visual stimuli (ventriloquism aftereffect) but did not affect localization precision. The size of the aftereffect shift in bias was at least partly explainable by unspecific test repetition effects, highlighting the need to account for inter-individual baseline differences in studies of spatial learning.

Keywords: Audiovisual; Localization errors; Psychophysics; Sensorimotor tasks; Ventriloquism aftereffect.


Conflict of interest statement

The authors have no competing interests to declare.

Figures

Fig. 1
Fig. 1
Accuracy and precision in a localization task. Note. Panels show simulated data illustrating the theoretical independence of accuracy and precision. Solid lines indicate single-trial localization responses, and the dotted line indicates the actual location of the target stimulus. Localization can be accurate and precise, inaccurate but precise, accurate but imprecise, or neither
Fig. 2
Fig. 2
Regression-based localization metrics. Note. Single-trial localization responses (y-axis) of a randomly selected participant at each azimuthal loudspeaker location (x-axis) are indicated by the open circles. The solid line indicates the regression line. Intercept (i.e., bias), slope, and R2 were taken from the regression model as regression-based localization metrics
Fig. 3
Fig. 3
Distributions of individual values in localization performance metrics. Note. Single-subject data points are superimposed on violin plots showing the distribution of individual pretest values in each metric. The group mean value is indicated by the red crossbars. The unit of measurement (y-axis) is in degrees azimuth except for slope and R2, which were taken from the regression model. For bias, negative values indicate leftward biases and positive values indicate rightward biases in localization. Dark gray dots indicate the subsample (n = 120) from Bruns et al. (2020b), and light gray dots indicate the subsample (n = 68) from Bruns and Röder (2019b)
Fig. 4
Fig. 4
Pairwise correlations of localization performance metrics. Note. Scatterplots showing individual data points with regression lines are shown below the diagonal for each pair of metrics. Corresponding Pearson correlation coefficients are indicated above the diagonal. Histograms showing the distribution of individual values in each metric are depicted on the diagonal. The unit of measurement is in degrees azimuth except for slope and R2, which were taken from the regression model. For bias, negative values indicate leftward biases and positive values indicate rightward biases in localization. *p < .05. **p < .01. ***p < .001
Fig. 5
Fig. 5
Changes in sound localization performance metrics after audiovisual exposure. Note. Performance changes in each metric were calculated by subtracting individual pretest from posttest values. Single-subject data points are superimposed on violin plots showing the distribution of individual difference values in each metric relative to the pretest baseline (indicated by the dotted lines). The group mean value is indicated by the red crossbars. The unit of measurement (y-axis) is in degrees azimuth except for slope and R2, which were taken from the regression model
Fig. 6
Fig. 6
Correlations between pretest performance and size of the ventriloquism aftereffect. Note. The size of the ventriloquism aftereffect was calculated by subtracting pretest bias from posttest bias. Scatterplots show individual pretest values in each localization performance metric (x-axis) plotted against the ventriloquism aftereffect (y-axis) with regression lines. Corresponding Pearson correlation coefficients are indicated in the subplot titles. The unit of measurement is in degrees azimuth except for slope and R2, which were taken from the regression model. For pretest bias, negative values indicate leftward biases and positive values indicate rightward biases in localization. *p < .05. **p < .01. ***p < .001

References

    1. Ahveninen J, Kopčo N, Jääskeläinen IP. Psychophysics and neuronal bases of sound localization in humans. Hearing Research. 2014;307:86–97. doi: 10.1016/j.heares.2013.07.008. - DOI - PMC - PubMed
    1. Alais D, Burr D. The ventriloquist effect results from near-optimal bimodal integration. Current Biology. 2004;14:257–262. doi: 10.1016/j.cub.2004.01.029. - DOI - PubMed
    1. Aston S, Negen J, Nardini M, Beierholm U. Central tendency biases must be accounted for to consistently capture Bayesian cue combination in continuous response data. Behavior Research Methods. 2022;54:508–521. doi: 10.3758/s13428-021-01633-2. - DOI - PMC - PubMed
    1. Badde S, Ley P, Rajendran SS, Shareef I, Kekunnaya R, Röder B. Sensory experience during early sensitive periods shapes cross-modal temporal biases. eLife. 2020;9:e61238. doi: 10.7554/eLife.61238. - DOI - PMC - PubMed
    1. Badde S, Navarro KT, Landy MS. Modality-specific attention attenuates visual-tactile integration and recalibration effects by reducing prior expectations of a common source for vision and touch. Cognition. 2020;197:104170. doi: 10.1016/j.cognition.2019.104170. - DOI - PMC - PubMed

Publication types

LinkOut - more resources