. 2024 Apr 29;15(4):300.
doi: 10.1038/s41419-024-06685-8.

Arsenic trioxide augments immunogenic cell death and induces cGAS-STING-IFN pathway activation in hepatocellular carcinoma

Affiliations

Arsenic trioxide augments immunogenic cell death and induces cGAS-STING-IFN pathway activation in hepatocellular carcinoma

Xin Li et al. Cell Death Dis. .

Abstract

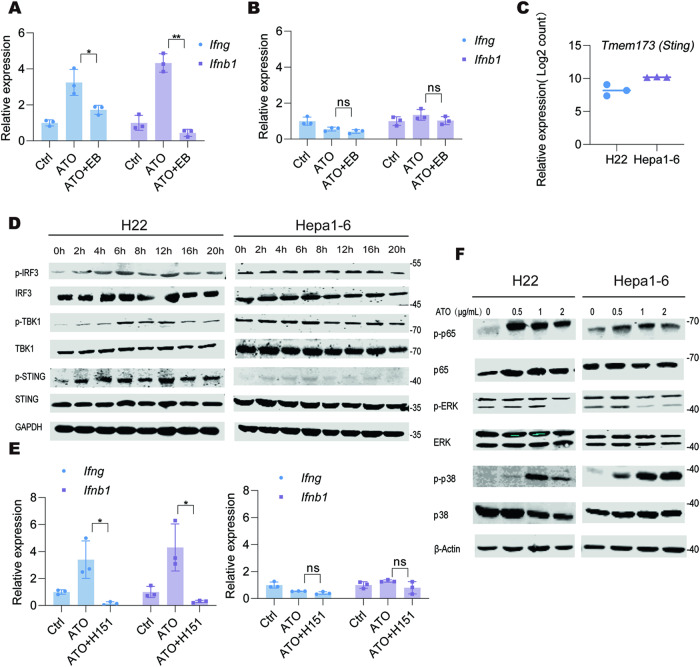
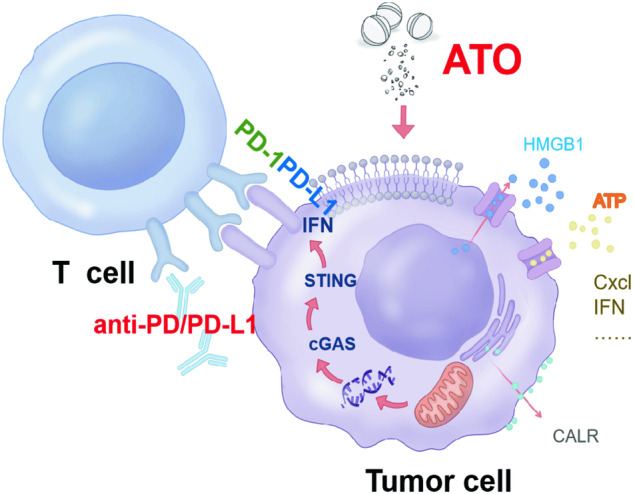
The treatment of hepatocellular carcinoma (HCC) is particularly challenging due to the inherent tumoral heterogeneity and easy resistance towards chemotherapy and immunotherapy. Arsenic trioxide (ATO) has emerged as a cytotoxic agent effective for treating solid tumors, including advanced HCC. However, its effectiveness in HCC treatment remains limited, and the underlying mechanisms are still uncertain. Therefore, this study aimed to characterize the effects and mechanisms of ATO in HCC. By evaluating the susceptibilities of human and murine HCC cell lines to ATO treatment, we discovered that HCC cells exhibited a range of sensitivity to ATO treatment, highlighting their inherent heterogeneity. A gene signature comprising 265 genes was identified to distinguish ATO-sensitive from ATO-insensitive cells. According to this signature, HCC patients have also been classified and exhibited differential features of ATO response. Our results showed that ATO treatment induced reactive oxygen species (ROS) accumulation and the activation of multiple cell death modalities, including necroptosis and ferroptosis, in ATO-sensitive HCC cells. Meanwhile, elevated tumoral immunogenicity was also observed in ATO-sensitive HCC cells. Similar effects were not observed in ATO-insensitive cells. We reported that ATO treatment induced mitochondrial injury and mtDNA release into the cytoplasm in ATO-sensitive HCC tumors. This subsequently activated the cGAS-STING-IFN axis, facilitating CD8+ T cell infiltration and activation. However, we found that the IFN pathway also induced tumoral PD-L1 expression, potentially antagonizing ATO-mediated immune attack. Additional anti-PD1 therapy promoted the anti-tumor response of ATO in ATO-sensitive HCC tumors. In summary, our data indicate that heterogeneous ATO responses exist in HCC tumors, and ATO treatment significantly induces immunogenic cell death (ICD) and activates the tumor-derived mtDNA-STING-IFN axis. These findings may offer a new perspective on the clinical treatment of HCC and warrant further study.


Conflict of interest statement

The authors declare no competing interests.

Figures

Fig. 1
Fig. 1. HCC cells and tumors showed diverse sensitivities to ATO treatment.
A Relative cell viability of H22 and Hepa1-6 cells treated with the indicated concentrations of ATO for 48 h were measured by ATP-Glo assay (n = 3 biological replications). B H22 and Hepa1-6 cells were pretreated with Acetylcysteine (NAC, 2 mM), Necrostatin-1 (NEC, 50 μM), Ferrostatin-1 (FER, 10 μM), Chloroquine (CQ, 10 μM) or z-VAD-FMK (z-VAD, 10 μM) for 3 h, respectively, followed by ATO treatment (0.5 μg/mL or 1 μg/mL) for 48 h, and the relative cell viability was measured. C Human HCC cell lines Huh7, Hep 3B, Hep G2, and MHCC97H were treated with the indicated concentrations of ATO for 48 h, and their cell viabilities were determined (n = 3 biological replications). D Huh7 and MHCC97H cells were pretreated with the inhibitors as in B for 3 h, followed by ATO (1 μg/mL) treatment for 48 h, and the relative cell viability was measured by ATP-Glo assay. E The Venn-diagram of the differential expressed genes (DEGs) compared between human Huh7 to MHCC97H cells, or between murine H22 and Hepa1-6 cells with human orthologs. A total of 265 genes were commonly altered and this gene set was utilized as the features to distinguish the ‘Huh7-like’ and ‘MHCC97H-like’ signatures. F The Metascape analysis was conducted on the 265 genes identified in E, revealing significantly changed pathways. G Plot graphs of the indicated compounds activities (z-score) on the NCI-60 cell lines. The NCI-60 cell lines were classified according to the ‘Huh7-like’ and ‘MHCC97H-like’ signatures. H The ssGSEA analysis of the arsenic response associated gene signatures in HCC_Gao-cohort [24] and TCGA-LIHC cohort. The HCC samples were classified as ‘Huh7-like’ or ‘MHCC97H-like’ tumors according to the features identified in E. Significance was determined by one-way ANOVA in B and D. ns, not significant; **p < 0.01; ***p < 0.001; ****p < 0.0001.
Fig. 2
Fig. 2. ATO treatment leads to immunogenic cell death (ICD) in ATO-sensitive HCC cells.
A Murine HCC cells were treated with ATO (H22, 0.5 μg/mL; Hepa1-6, 1.0 μg/mL) for 3 or 12 h. The cell surface calreticulin (CRT) levels were measured by flow cytometry. B The relative concentrations of HMGB1 in the supernatant of H22 and Hepa1-6 cells treated with ATO (0.5 μg/mL) for 20 h were quantified by ELISA. C, D The supernatants of H22 and Hepa1-6 cells treated with ATO for 20 h were collected, and the ATP levels were measured by ATP-Glo kit in C. The relative IFNβ contents were quantified by ELISA in D. E H22 and Hepa1-6 cells were treated with ATO (0.5 μg/mL) or doxorubicin (DOX, 1 μM) for 20 h, and the relative cell viabilities were measured. F The changes of Il1b, Tnfa, Ifng, Ifnb1, H2db, Cxcl9, Cxcl10, Cxcl11, and Cxcl12 in H22 cells treated with ATO and DOX were detected by qPCR. Significance was determined by one-way ANOVA in A, C, and D, Student’s t-test in B and E. ns not significant; *p < 0.05; **p < 0.01; ***p < 0.001; ****p < 0.0001.
Fig. 3
Fig. 3. ATO treatment elicits prophylactic activities.
A, B H22 and Hepa1-6 cells were treated with ATO (0.5 μg/1 μg) for 20 h. The relative expression of Il1b and Tnfa (A) as well as Ifng and Ifnb1 (B) were detected by qPCR and shown as the fold changes comparing with their basal levels respectively. C Mice were vaccinated with ATO or Dox-pretreated dying tumor H22 cells and rechallenged with the corresponding live tumor cells 10 days later. Tumor growth kinetics were monitored for each group (n = 5–6 mice/per group). D The remaining tumor tissues as in C were collected and the infiltrated CD3+ T cells and their subpopulations CD4+ T and CD8+ T cells were analyzed by flow cytometry. Significance was determined by Student’s t-test in A and B, two-way ANOVA in C and one-way ANOVA in D. DOX, doxorubicin. ns, not significant; * p < 0.05; ** p < 0.01; ****p < 0.0001.
Fig. 4
Fig. 4. ATO treatment induces mitochondrial damage in HCC cells.
A GSEA analysis of the transcriptomes of H22 cells treated with PBS or ATO (0.5 μg/mL) for 20 h. The top gene signatures with FDR < 0.05 were listed. B The electron microscopy morphology of H22 cells treated with ATO (0.5 μg/mL, upper panel) and Hepa1-6 cells treated with ATO (1.0 μg/mL, lower panel) for 16 h. The mitochondria were indicated by arrows and their high magnifications were shown. The images were the representatives of at least 5 view fields. C The number of damaged mitochondria per cell as indicated in B was counted and analyzed. DF H22 cells and Hepa1-6 cells were treated with ATO (0.5 μg/mL and 1.0 μg/mL, respectively) for the indicated times. The relative changes of intracellular ROS levels (D), mitochondrial ROS (E) and mitochondrial membrane potential (F) were measured by flow cytometry using the indicated kits. G GSEA analysis of ‘REACTOME_AUTOPHAGY’ signature in H22 cells treated with ATO (0.5 μg/mL) or PBS for 20 h. H The cytoplasmic mtDNA was extracted from H22 and Hepa1-6 cells treated with PBS or ATO for 20 h and the expression of D-loop3 and Nd1 were detected by qPCR. Significance was determined by Student’s t-test in C and H. ns not significant; ****p < 0.0001.
Fig. 5
Fig. 5. ATO-induced mitochondrial injury contributes to cGAS-STING activation.
A, B H22 (A) and Hepa1-6 (B) cells were cultured with or without ethyl bromide (EB, 120 ng/mL) for 3 days, followed by ATO (0.5 μg/mL) or PBS treatment for another 20 h. The transcripts of Ifng and Ifnb1 were quantified. C The transcripts of Tmem173 (Sting) was quantified by Log2 count in RNA-seq. D H22 and Hepa1-6 cells were treated with ATO (0.5 μg/mL and 1.0 μg/mL, respectively) for the indicated times and Western blot analysis was performed to assess the activities of the STING-IRF-3 pathway using the indicated antibodies. GAPDH was measured as a loading control. The images were the representatives of three independent experiments. E H22 and Hepa1-6 cells were treated with ATO in the presence of H151 (500 nM) or DMSO for 20 h. The transcripts of Ifng and Ifnb1 were quantified by qPCR and shown as the fold changes comparing with their basal levels respectively. F Western blot analysis of the phosphorylation levels of p65, ERK and p38 proteins in H22 and Hepa1-6 cells treated with indicated concentrations of ATO for 20 h. β-Actin was measured as a loading control. The images were the representatives of three independent experiments. Significance was determined by one-way ANOVA in A, B and E. ns, not significant; * p < 0.05; ** p < 0.01.
Fig. 6
Fig. 6. Synergetic anti-tumor effect of PD1-blocking antibody in combination with ATO in ATO-sensitive HCC cells.
A Murine H22 cells were orthotopically implanted into Balb/c mice. After 7 days, the mice were treated with PBS or ATO (3 mg/kg) every two days, and the tumors were collected and measured on day 17. The representative liver images were shown (n = 5 mice/group). B The transcriptomes of the tumor tissues shown in A were assessed by RNA-seq and GSEA analysis were performed. The top significantly altered pathways with FDR < 0.05 were listed. C Western blot analysis of STING phosphorylation levels in tumor tissues shown in A and the representative images were presented. D The relative expression of PD-L1 in H22 and Hepa1-6 cells treated with ATO for 20 h was detected by flow cytometry. E, F H22 cells were subcutaneously inoculated into Balb/c mice. After 7 days, the mice were randomly grouped and treated with PBS, ATO (A, 3 mg/kg), αPD-1 (P, 10 mg/kg) or ATO combined with αPD-1, respectively. The tumor tissues were collected on day 21 with tumor growth quantified (E), and the macroscopy at the end stage was shown in F (n = 6-8 mice/group). G H22-Luc cells were orthotopically implanted into Balb/c mice. After 5 days, the specified mice were pretreated with ATO (A, 3 mg/kg) twice. On day 7, tumor-bearing mice received the treatments as described in E. Tumor growth was monitored by bioluminescence imaging. H Macroscopic images of orthotopic tumors from G. I, J Hepa1-6 cells were subcutaneously inoculated into C57BL/6 mice. After 7 days, the mice were randomly grouped and treated with the treatments as described in E. The tumor tissues were collected on day 17 with tumor growth quantified (I), and the macroscopy at the end stage was shown in J (n = 6-8 mice/group). Significance was determined by two-way ANOVA in E and I, one-way ANOVA in D and G. ns, not significant; *p < 0.05; **p < 0.01; ***p < 0.001; ****p < 0.0001.
Fig. 7
Fig. 7. ATO promoted CD8+T cell infiltration and activation in tumor.
A, B H22-Luc cells were orthotopically implanted into Balb/c mice. After 5 days, the mice were randomly assigned to various treatment groups, including PBS, ATO (A, 3 mg/kg), αPD-1 (P, 10 mg/kg), ATO + αPD-1, ATO + αPD-1 + αCD8 (10 mg/kg) and ATO + αPD-1 + αIFNAR-1 (10 mg/kg). The tumor tissues were collected on day 21. The administration process of the treatments and tumor macroscopy was shown in A. The tumor growth was quantified in B. C, D H22 cells were subcutaneously inoculated into Balb/c mice. After 5 days, the mice were randomly grouped and treated separately with the treatment doses described in A. The tumor tissues were collected on day 21. The administration process of the treatments and tumor macroscopy was shown in C. The tumor growth was quantified in D. E, F Nude mice were vaccinated with ATO-pretreated dying H22 cells and rechallenged with the corresponding live tumor cells 10 days later. Tumor growth kinetics were monitored for each group (n = 5–6 mice/per group). The tumor macroscopy was shown in E and the tumor growth was quantified in F. G Tumor infiltration of IFN-γ, TNFα, and Granzyme B (GZMB) in H22 orthotopic tumors was measured by flow cytometry. H Tumor infiltration of IFN-γ, TNFα and GZMB in H22 subcutaneous tumors was measured by flow cytometry. Significance was determined by two-way ANOVA in D and F, one-way ANOVA in B, G and H. ns, not significant; *p < 0.05; **p < 0.01; ***p < 0.001; ****p < 0.0001.
Fig. 8
Fig. 8
The pattern diagram of the synergistic effects of ATO in combination with PD-1 antibody.

References

    1. Rumgay H, Arnold M, Ferlay J, Lesi O, Cabasag CJ, Vignat J, et al. Global burden of primary liver cancer in 2020 and predictions to 2040. J Hepatol. 2022;77:1598–606. doi: 10.1016/j.jhep.2022.08.021. - DOI - PMC - PubMed
    1. Oh JH, Jun DW. The latest global burden of liver cancer: a past and present threat. Clin Mol Hepatol. 2023;29:355–7. doi: 10.3350/cmh.2023.0070. - DOI - PMC - PubMed
    1. Foglia B, Turato C, Cannito S. Hepatocellular carcinoma: latest research in pathogenesis, detection and treatment. Int J Mol Sci. 2023;24:12224. doi: 10.3390/ijms241512224. - DOI - PMC - PubMed
    1. Allaire M, Bruix J, Korenjak M, Manes S, Maravic Z, Reeves H, et al. What to do about hepatocellular carcinoma: recommendations for health authorities from the International Liver Cancer Association. JHEP Rep. 2022;4:100578. doi: 10.1016/j.jhepr.2022.100578. - DOI - PMC - PubMed
    1. Liu CY, Cheng CY, Yang SY, Chai JW, Chen WH, Chang PY. Mortality evaluation and life expectancy prediction of patients with hepatocellular carcinoma with data mining. Healthcare (Basel) 2023;11:925. doi: 10.3390/healthcare11060925. - DOI - PMC - PubMed

Publication types

MeSH terms