. 2024 Apr 29;15(1):3330.
doi: 10.1038/s41467-024-47601-0.

Atypical heat shock transcription factor HSF5 is critical for male meiotic prophase under non-stress conditions

Affiliations

Atypical heat shock transcription factor HSF5 is critical for male meiotic prophase under non-stress conditions

Saori Yoshimura et al. Nat Commun. .

Abstract

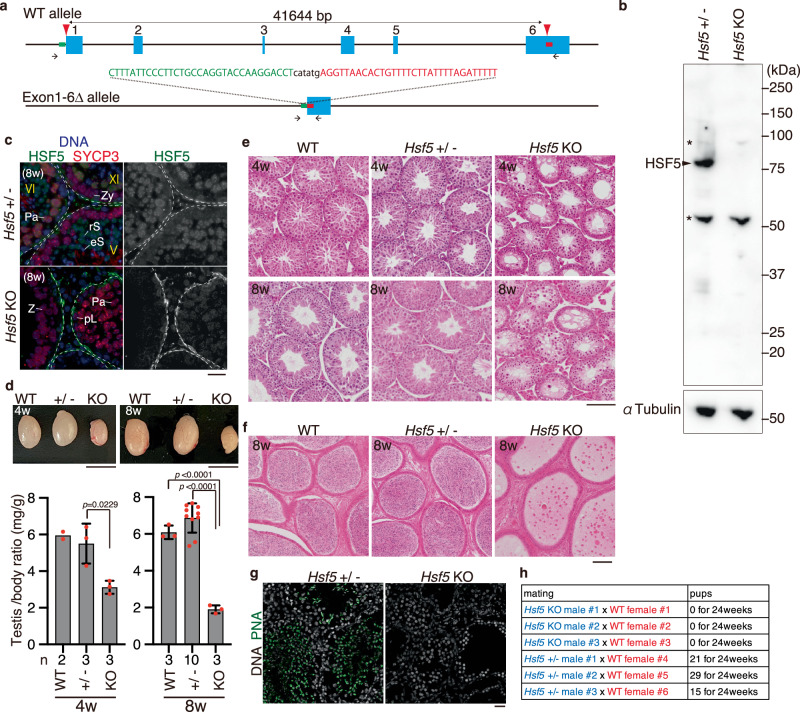
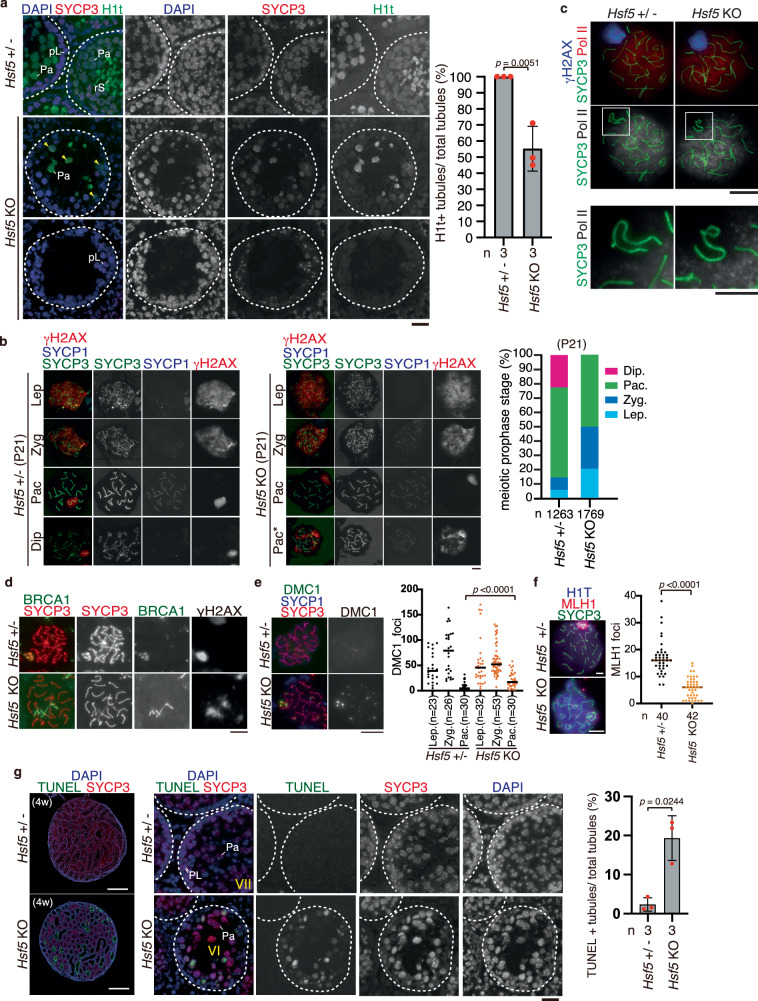
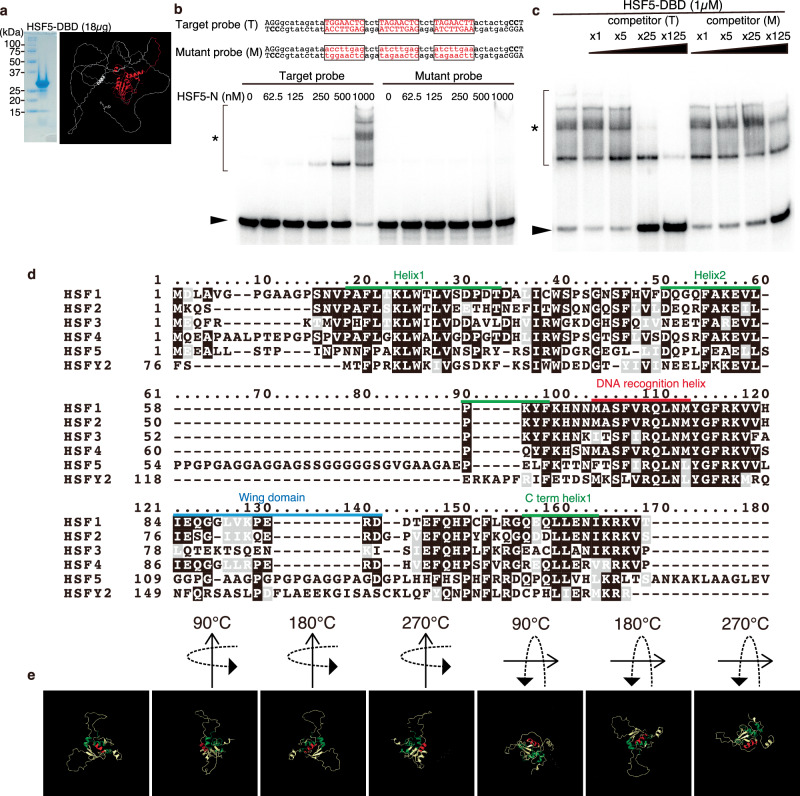
Meiotic prophase progression is differently regulated in males and females. In males, pachytene transition during meiotic prophase is accompanied by robust alteration in gene expression. However, how gene expression is regulated differently to ensure meiotic prophase completion in males remains elusive. Herein, we identify HSF5 as a male germ cell-specific heat shock transcription factor (HSF) for meiotic prophase progression. Genetic analyzes and single-cell RNA-sequencing demonstrate that HSF5 is essential for progression beyond the pachytene stage under non-stress conditions rather than heat stress. Chromatin binding analysis in vivo and DNA-binding assays in vitro suggest that HSF5 binds to promoters in a subset of genes associated with chromatin organization. HSF5 recognizes a DNA motif different from typical heat shock elements recognized by other canonical HSFs. This study suggests that HSF5 is an atypical HSF that is required for the gene expression program for pachytene transition during meiotic prophase in males.


Conflict of interest statement

The authors declare no competing interests.

Figures

Fig. 1
Fig. 1. HSF5 is expressed during meiotic prophase in the mouse testis.
a Genomic view of MEIOSIN and STRA8 binding peaks over the Hsf5 locus. Genomic coordinates derived from NCBI. To specify testis specific transcription, RNA polymerase II ChIP-seq in the testis is shown. b Schematic diagram of domain structure in six members of mouse heat shock factor (HSF) protein family. Domain name and the number of the amino acid residues are assigned according to Uniprot. DBD DNA-binding domain, HR heptad repeat, IDR Intrinsically disordered region, DD D domain, RD Regulatory domain, 9aaTAD; Transactivation motif. c SEC-MALS profiles of MBP-full length HSF5 (left) and HSF5-DNA binding domain (a.a. 1-209) (right) at room temperature (blue) and after heat treatment at 42 °C for 30 min (red). Thin and bold lines show the refractive index (RI) profile and mass plot, respectively. d The tissue-specific expression pattern of Hsf5 was examined by RT-PCR. Testis RNA was obtained from 3 weeks old (3w) and 8 weeks old (8w) male mice. Ovary RNA was obtained from adult 8 weeks old (8w) female mice. RT- indicates control PCR without reverse transcription. The data was acquired from two separate experiments. e The expression patterns of Hsf5 in the embryonic ovary (E12.5-E18.5, n = 1 for each) and testis (3w, n = 1) were examined by RT-qPCR. Average values normalized to E12.5 ovary are shown with SD from technical triplicates.
Fig. 2
Fig. 2. HSF5 expression pattern in the mouse seminiferous tubules.
a Seminiferous tubule sections in WT testis (8 weeks old) were immunostained as indicated. pL preleptotene, L Leptotene, Z Zygotene, ePa early Pachytene, P Pachytene, M I Metaphase I, int Interkinesis, rS round Spermatid, eS elongated Spermatid. Boundaries of the seminiferous tubules are indicated by white dashed lines. * indicates a non-specific cross-reactivity of the gunia pig anti-SYCP3 antibody to sperm tail. HSF5 was immunostained by HSF5-C antibody. The same immunostaining pattern of HSF5 was confirmed by other HSF5-N1 and HSF5-N2 antibodies, as shown in Fig. S2a. Roman numbers indicate the seminiferous tubule stages. Biologically independent mice (n = 3) were examined in three separate experiments. Scale bar: 25 μm. b The schematic of the Hsf5-3xFLAG-HA knockin allele. c Testis extracts from Hsf5-3xFLAG-HA knockin and negative control WT mouse testis (5 weeks old) were immunoblotted as indicated. Red arrow indicates HSF5-3xFLAG-HA protein derived from the knockin allele. Blue arrow indicates HSF5 protein derived from WT allele. d Seminiferous tubule sections in Hsf5-3xFLAG-HA knockin (n = 1) and negative control WT mouse testis (n = 1) at 5 weeks old were immunostained as indicated. Scale bar: 25 μm. e Seminiferous tubule sections in WT testis (P16) were immunostained as indicated. Arrow and arrowhead indicate HSF5-positive/H1t-positive and HSF5-negative/H1t-positive pachytene spermatocytes, respectively. Scale bar: 25 μm. A single experiment was performed. f The schematic of expression of HSF5 (green), H1t (blue), HSF1(red), in the stages of the seminiferous tubules.
Fig. 3
Fig. 3. Spermatogenesis was impaired in Hsf5 knockout male.
a The targeted Hsf5 allele with deletion of Exon1-6 is shown. 5’- and 3’- homology sequences in the ssODN are shown in green and red, respectively. Arrowheads: synthetic gRNAs. Arrows: PCR primers for genotyping. b Immunoblot analysis of testis extracts prepared from mice with the indicated genotypes (P17). The arrow indicates a band of HSF5. * indicates nonspecific bands. Two technically independent experiments from two pairs of WT and Hsf5 KO siblings were repeated and showed similar results. c Seminiferous tubule sections (8 weeks old) were stained for SYCP3, HSF5, and DAPI. pL preleptotene, Pa pachytene spermatocyte, rS round spermatid, eS elongated spermatid. Boundaries of the seminiferous tubules are indicated by white dashed lines. Roman numbers indicate the seminiferous tubule stages. Biologically independent mice (n = 3) for each genotype were examined. Scale bars: 25 μm. d Testes from WT, Hsf5 +/- and Hsf5 KO (upper left: 4 weeks old, upper right: 8 weeks old left). Testis/body-weight ratio (mg/g) of WT, Hsf5 +/-, and Hsf5 KO mice (lower left: 4 weeks old, lower right: 8 weeks old) are shown below (Mean with SD). n: the number of animals examined. Statistical significance is shown by p value (Two-tailed t-test). Scale bar: 5 mm. e Hematoxylin and eosin staining of the sections from WT, Hsf5 +/- and Hsf5 KO testes (upper: 4 weeks old, lower: 8 weeks old). Biologically independent mice (n = 3) for each genotype were examined. Scale bar: 100 μm. f Hematoxylin and eosin staining of the sections from WT, Hsf5 +/- and Hsf5 KO epididymis (8 weeks old). Biologically independent mice (n = 3) for each genotype were examined. Scale bar: 100 μm. g Seminiferous tubule sections (8 weeks old) were stained for PNA lectin and DAPI. Scale bar: 25 μm. A single experiment was performed. h Number of pups born by mating Hsf5 + /- and Hsf5 KO males with WT females to examine fertility. Hsf5 +/- males and Hsf5 KO males were initially mated with WT females (all 4 weeks old at the start point of mating). This cage was observed for 24 weeks from the start of mating.
Fig. 4
Fig. 4. Hsf5 KO spermatocytes failed to progress through pachytene.
a Seminiferous tubule sections (4 weeks) were stained as indicated. Scale bar: 25 μm. Yellow arrowhead indicates H1t-positive spermatocyte with abnormal SYCP3 staining. pL: preleptotene, Pa: pachytene, rS: round spermatid. Shown on the right is the quantification of the seminiferous tubules that have H1t + /SYCP3+ cells per the seminiferous tubules that have SYCP3+ spermatocyte cells in Hsf5 +/- and Hsf5 KO testes (Mean with SD). n: the number of animals examined. Statistical significance is shown (p = 0.0051, unpaired two-tailed t-test). bf Chromosome spreads of Hsf5 +/- and Hsf5 KO spermatocytes (P21) were immunostained as indicated. b Lep: leptotene, Zyg: zygotene, Pac: pachytene, Dip: diplotene. Pac* indicates pachytene spermatocyte with high level of γH2AX signals remained on autosomes. Scale bar: 10 μm. Shown on the right is quantification of stages per total SYCP3+ spermatocytes. n: the number of cells examined. c Hsf5 +/- (n = 60) Hsf5 KO (n = 55). Scale bar: 10 μm. Enlarged images of the XY body are shown on the bottom. Scale bar: 5μm. d  ~ 17.8% of Hsf5 KO pachytene spermatocytes (n = 62) exhibited BRCA1 along autosomes with γH2AX signals, whereas none of Hsf5 +/- pachytene spermatocytes (n = 51) did except for XY chromosome. Scale bar: 10 μm. e The number of DMC1 foci is shown in the scatter plot with median (right). Statistical significance is shown (p < 0.0001, two-sided Mann-Whitney U-test). Lep leptotene, Zyg Zygotene, Pac Pachytene. Scale bar: 10 μm. f The number of MLH1 foci is shown in the scatter plot with median (right). Statistical significance is shown (Mann-Whitney U-test). n: number of spermatocytes examined. Statistical significance is shown (p < 0.0001, two-sided Mann–Whitney U-test). Scale bar: 5 μm. g Seminiferous tubule sections (4 weeks) were subjected to TUNEL assay. Whole testis sections (left, Scale bar: 500 μm) and closeup view of seminiferous tubule sections (middle, Scale bar: 25 μm) are shown. Shown on the right is the quantification of the seminiferous tubules that have TUNEL+ cells per total tubules in Hsf5 +/- (n = 3) and Hsf5 KO (n = 3) testes (Mean with SD). Statistical significance is shown by p-value (p = 0.0244, unpaired two-tailed t-test).
Fig. 5
Fig. 5. RNA-seq analysis of whole testes at 33 and 37 °C in Hsf5 KO.
a Principal component analysis of the transcriptomes of whole testes from Hsf5 +/-(n = 3) and Hsf5 KO (n = 3) at P16, that were incubated at 33 and 37 °C for 3 h. b Venn diagram representing the overlap of DEGs at 33 versus 37 °C between Hsf5 +/- testes and Hsf5 KO testes. c Shown are scatter plot of the transcriptomes of Hsf5 +/- (n = 3, left) or Hsf5 KO (n = 3, right) testes treated at 33 °C versus at 37 °C. The red dots indicate the upregulated genes and the blue dots indicate the downregulated genes at 37 °C. d The expression changes of Hsf5, Hspa1a(Hsp70.3) and Hspa1b(Hsp70) at 33 °C and 37 °C by in the Hsf5 +/- and KO testes (P16, n = 3) were examined by RT-qPCR. Average values normalized to Hsf5 +/- testis at 33 °C are shown with SD from technical triplicates. Statistical significance is shown by p-value (unpaired two-tailed t-test).
Fig. 6
Fig. 6. scRNA-seq analysis of WT and Hsf5 KO spermatogenic germ cells.
a UMAP representation of scRNA-seq transcriptome profiles for germ cells from P16 WT and Hsf5 KO testes. b Clustering analysis of different gene expression patterns on UMAP-defined scRNA-seq transcriptomes of P16 WT and Hsf5 KO cells. Gray arrow indicates developmental direction. c Bar graph showing the proportion of WT and Hsf5 KO germ cells among the clusters. d UMAP plots show mRNA levels of key developmental marker genes of spermatogenic cells. Key developmental marker genes include Gfra1: spermatogonial stem cell, Zbtb16: undifferentiated spermatogonia, Kit: differentiating spermatogonia, Meiosin: pleleptotene spermatocyte, Spo11: early meiotic prophase spermatocyte, Tesmin: mid-pachytene spermatocyte. e The mRNA levels of Hsf5 on the UMAP plot. f Venn diagram representing the overlap between the 958 downregulated genes identified in SMART RNA-seq data (Supplementary Fig. 4) and Downregulated genes in Clusters 2, 3, and 9 of Hsf5 KO. g Gene enrichment analysis of highly expressed genes in Cluster 2 or Cluster 10. h Expression patterns of the representative genes in Cluster 2 (Spink2, Clgn) on the UMAP plot. i Expression patterns of the representative genes in Cluster 10 (Ttll8, Dnah8) on the UMAP plot. j The mRNA levels of the sex chromosomal genes among the clusters are shown in violin plots with a median. p-values by two-sided Wilcoxon rank sum test are shown on the right. k The mRNA levels of the autosomal genes among the clusters are shown in violin plots with a median. p-values by two-sided Wilcoxon rank sum test are shown on the right. l The subtype clusters delineated by scRNA-seq and the timing of HSF5 protein expressions are shown along the developmental stages. HSF5 started to appear in the spermatocyte nuclei from mid-pachytene onward, and were expressed in round spermatids. Vertical bars indicate the stages when the developmental progression is blocked in Hsf5KO spermatocytes. See also Supplementary Fig. 5, Supplementary Data 4. The schematic of developmental stages was adapted from our previously published paper (10.1038/s41467-021-23378-4).
Fig. 7
Fig. 7. HSF5 binds to the gene promoter regions.
a HSF5-bound peaks were commonly identified among the 4 replicates of HSF5 CUT&Tag (rabbit anti-HSF5-N1, rabbit anti-HSF5-N2, rabbit anti-HSF5-C antibodies), but not overlapped with control IgG CUT&Tag. HSF5 binding sites were classified by the genomic locations as indicated. b Heat map of the common HSF5 binding sites of HSF5 CUT&Tag at the positions −3.0 kb upstream to +3.0 kb downstream relative to the TSS. Average distributions of HSF5- ChIP-seq binding peak are shown on the top. c Genomic view of the CUT&Tag peaks revealed by HSF5-N1, HSF5-N2, HSF5-C (rep1, rep2) antibodies and control IgG over representative gene loci. Genomic coordinates were obtained from RefSeq. RefSeq IDs for mRNA isoforms are indicated. To specify testis specific transcription, binding peaks of RNA polymerase II in the testis are shown. d Gene expression patterns of HSF5 bound genes during spermatogenesis were shown as Heatmap. Heatmaps show the hierarchical relationship of the expression patterns of the HSF5-bound genes across the developmental direction. Expression pattern of the HSF5-bound genes was assessed by scRNA-seq data of spermatogenic cells as described in Fig. 6k. The cluster number is indicated on the top. The order of clusters from left to right corresponds to developmental direction of spermatogenesis (undifferentiated spermatogonia to pachytene spermatocyte). The expression patterns of the HSF5-bound genes were classified (Class1-Class3). On the right, top3 gene enrichment terms ranked by Enrichment score, log(q-value), are shown. e The average expression levels of the HSF5-target genes (Class 1, 2, and 3) are shown in violin plots with a median. The expression levels were compared between WT and Hsf5 KO mice using the scRNA-seq data for pachytene sub-populations that were pooled from clusters 9, 3, and 2. Note that scRNA-seq data of cluster 10 was excluded since the cluster 10 sub-population was already eliminated in Hsf5 KO mice. Statistical significance is shown by p-value (Class1; p = 1.145 × 10−10, Class 2; p < 2.2 × 10−16, Class 3; p < 2.2 × 10−16, two-sided Wilcoxon rank sum test). See also Supplementary Data 6 for a complete list of the HSF5-bound genes and the Gene enrichment analyzes.
Fig. 8
Fig. 8. HSF5 possesses an unique DNA binding specificity.
a The purified HSF5 N-terminal (aa1-209) protein was used for EMSA assay (left). Shown on the right is the corresponding HSF5 N-terminal part is shown (red) on the ribbon model that was predicted from AlphaFold2. b DNA binding ability of HSF5 DNA binding domain was examined by EMSA assay. Shown on the top are the target (T) and mutant (M) sequences of the DNA probes. Target (T) sequence was designed according to the enriched motif that was predicted by Chip-seq as shown in Fig. S8e. Increasing amount of the purified protein was mixed with 0.04 pmol of 32P-labeled DNA probes (T or M) at the protein/DNA molar ratio of 15.6 − 250. Arrowhead: unbound DNA. The protein-DNA complexes are shown by * with a bracket. c HSF5 N-terminal protein (1 μM) was mixed with 0.04 pmol of the 32P-labeled target (T) DNA probe. DNA binding specificity of HSF5- DNA complex was assessed by adding the unlabeled target or mutant competitor DNA (1 – 125 fold excess to the 32P-labeled DNA probes). A single experiment was performed in (ac). d Amino acid sequences of the DNA-binding domain in the mouse HSFs are aligned. HSF1, HSF2, and HSF4 possess a DNA recognition helix (red) containing a conserved Ser-Phe-Val-Arg-Gln amino acid sequence, which is known to insert into the major groove of the HSE. HSF5 possesses a Ser-Phe-Ile-Arg-Gln amino acid sequence at the corresponding position. HSF5 possesses insertion of amino acid sequence between the helix 2 and DNA recognition helix. e Ribbon models of HSF5-DBD (1-167 a.a.) are shown that were predicted from AlphaFold2. Helixes are colored as shown in (a).

References

    1. Handel MA, Schimenti JC. Genetics of mammalian meiosis: regulation, dynamics and impact on fertility. Nat. Rev. Genet. 2010;11:124–136. doi: 10.1038/nrg2723. - DOI - PubMed
    1. Zickler D, Kleckner N. Recombination, pairing, and synapsis of homologs during meiosis. Cold Spring Harb. Perspect. Biol. 2015;7:a016626. doi: 10.1101/cshperspect.a016626. - DOI - PMC - PubMed
    1. Hunter N. Meiotic recombination: the essence of heredity. Cold Spring Harb. Perspect. Biol. 2015;7:a016618. doi: 10.1101/cshperspect.a016618. - DOI - PMC - PubMed
    1. Page SL, Hawley RS. The genetics and molecular biology of the synaptonemal complex. Annu Rev. Cell Dev. Biol. 2004;20:525–558. doi: 10.1146/annurev.cellbio.19.111301.155141. - DOI - PubMed
    1. Li XZ, et al. An ancient transcription factor initiates the burst of piRNA production during early meiosis in mouse testes. Mol. Cell. 2013;50:67–81. doi: 10.1016/j.molcel.2013.02.016. - DOI - PMC - PubMed

Publication types

Substances

LinkOut - more resources