. 2024 Apr 29;15(1):3602.
doi: 10.1038/s41467-024-47985-z.

VC-resist glioblastoma cell state: vessel co-option as a key driver of chemoradiation resistance

Affiliations

VC-resist glioblastoma cell state: vessel co-option as a key driver of chemoradiation resistance

Cathy Pichol-Thievend et al. Nat Commun. .

Abstract

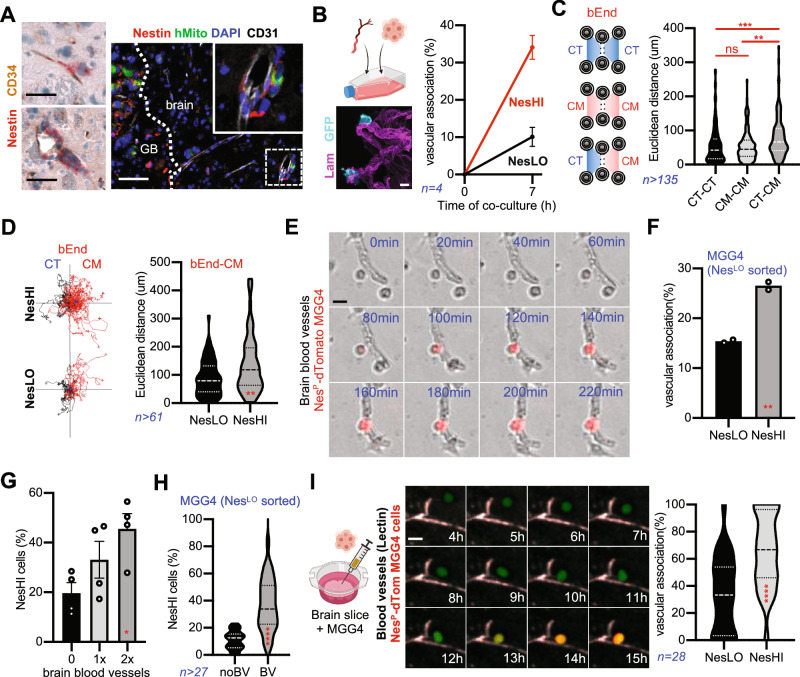
Glioblastoma (GBM) is a highly lethal type of cancer. GBM recurrence following chemoradiation is typically attributed to the regrowth of invasive and resistant cells. Therefore, there is a pressing need to gain a deeper understanding of the mechanisms underlying GBM resistance to chemoradiation and its ability to infiltrate. Using a combination of transcriptomic, proteomic, and phosphoproteomic analyses, longitudinal imaging, organotypic cultures, functional assays, animal studies, and clinical data analyses, we demonstrate that chemoradiation and brain vasculature induce cell transition to a functional state named VC-Resist (vessel co-opting and resistant cell state). This cell state is midway along the transcriptomic axis between proneural and mesenchymal GBM cells and is closer to the AC/MES1-like state. VC-Resist GBM cells are highly vessel co-opting, allowing significant infiltration into the surrounding brain tissue and homing to the perivascular niche, which in turn induces even more VC-Resist transition. The molecular and functional characteristics of this FGFR1-YAP1-dependent GBM cell state, including resistance to DNA damage, enrichment in the G2M phase, and induction of senescence/stemness pathways, contribute to its enhanced resistance to chemoradiation. These findings demonstrate how vessel co-option, perivascular niche, and GBM cell plasticity jointly drive resistance to therapy during GBM recurrence.


Conflict of interest statement

The authors declare no competing interests.

Figures

Fig. 1
Fig. 1. scRNA-seq analysis unveils a GBM radiotherapy-induced cell state transition.
A Cell state heterogeneity in MGG4 gliomaspheres: astrocyte (AC)-like, oligodendrocyte progenitor cells (OPC)-like, mesenchymal (MES)-like and neural progenitor cells (NPC)-like. Schematics created with BioRender.com. B UMAP dimensionality reduction plot of scRNA-seq for MGG4 gliospheres exposed to 5 Gy IR or not, at day3 or 5 of culture (n = 2 independent experiments). C Effect of IR on each cluster (p = 0,0005; Chi-square). D, E RNA velocity and trajectory analysis of irradiated or naïve MGG4 cells at day5. F Expression of CL3 geneset in the Neftel’ representation of cell states. GBM cell positions indicate relative scores for meta-modules, with colors reflecting CL3 geneset expression. Violin and box-and-whiskers plot (Tukey) from 28 GBM patients produced with https://singlecell.broadinstitute.org. G Feature plot for CL3 signature in the harmonized database with over 1 M GBM cells. H Feature plot of Nestin expression. I Enrichment of NesHI cell population upon IR (2 and 5 Gy) in NestinP-dTomato MGG4 cells analyzed by real-time microscopy. Data are means ± SEM (n = 3 independent experiments, technical duplicates per experiment; p < 0.0001; one-way ANOVA, Turkey’s multiple comparisons test). J Enrichment of NesHI cell population upon IR (2, 5, 8, 10, 12 Gy) analyzed at day5 by FACS in NestinP-dTomato MGG4 and MGG18 cells. Data are means ± SEM (MGG4 n = 4; MGG18 n = 3; ns, non-significant; *p < 0.05; **p < 0.01; ***p < 0.001; ****p < 0.0001; one-way ANOVA, Turkey’s multiple comparisons test). K Spearman correlation analysis of basal Nestin expression and fold change (FC) of Nestin expression after irradiation (5 Gy) in 10 GBM cell lines. X-axis: 1/basal CT values for Nestin expression determined by RT-PCR; Y-axis: Nestin FC after IR determined by RT-PCR. Patient-derived (blue) mouse (green) cell lines (n = 3 per cell line, R = 0,88; p = 0,001, Spearman test). L Time-lapse micrographs of FACS-sorted MGG4 NesLO cells showing Nestin reporter activation (arrows). M, N Enrichment of MGG4 NesHI cell population overtime upon IR (5 Gy) or not (Naive) in FACS-sorted MGG4 NesLO cells analyzed by real-time microscopy and FACS. Data are means ± SEM (n = 3 biologically independent experiments, p < 0.0001, Pearson test). O Enrichment of NesHI cell population under IR (5 Gy) in FACS-sorted MGG18 and GL261 NesLO cells analyzed at day3 by FACS. Data are means ± SEM (MGG18 n = 4; GL261 n = 3; ***p < 0.001; ****p < 0.0001; unpaired two-sided t test).
Fig. 2
Fig. 2. TMZ treatment induces GBM cell state transition.
A (Left)Volcano plot of the differential expression analysis between MGG4 naïve and treated with TMZ (25 μM) for 3days. (Right) GSEA plot of the CL3 signature in TMZ-treated MGG4 cells vs naïve. Normalized enrichment score (NES) and q.value are indicated (p = 0,0003; Fisher’s test). B CL3 signature distribution in the scRNA-seq dataset from Larsson, 2021. (Left) Visualization of conditions (naïve or TMZ-treated U3065MG cells) and feature plot of CL3 geneset expression in scRNA-seq UMAP. (Right) Proportions of CL3-HI or CL3-LO cells (p = 0.0003; z-test). C NesHI cell population upon TMZ treatment (25, 50 and 100 μM) in NestinP-dTomato MGG4 cells by real-time microscopy (n = 3 biologically independent experiments, p < 0.0001 vs naïve cells, Pearson test). D NesHI cell population upon TMZ treatment (25, 50 and 100uM) at day3 by FACS in NestinP-dTomato MGG4, MGG18 and GL261 cells. Data are means ± SEM (n = 4 independent experiments; ns, non-significant; **p < 0.01; ***p < 0.001; ****p < 0.0001; one-way ANOVA, Turkey’s multiple comparisons test). E Spearman correlation analysis of basal Nestin expression and Nestin fold change (FC) of upon TMZ (25 μM) in 7 GBM cell lines. X-axis: 1/basal CT values for Nestin expression by RT-PCR. Y-axis: Nestin FC after IR. Patient-derived (blue) mouse (green) cell lines (n = 3; R = 0,84; p = 0,001; Spearman test). F (Left) Time-lapse micrographs of FACS-sorted MGG4 NesLO cells showing the reprogramming detected by dTomato fluorescence (arrow). (Right) of NesHI cell population enrichment upon TMZ treatment in FACS-sorted NesLO MGG4 cells. (n = 4 biologically independent experiments, p < 0.0001 vs naïve cells, Pearson test). G NesHI cell population upon TMZ treatment (25 and 50 μM) in FACS-sorted MGG4 NesLO cells analyzed at day3 by FACS. Data are means ± SEM (n = 3 independent experiments; ****p < 0.0001; one-way ANOVA, Turkey’s multiple comparisons test). H NesHI cell population enrichment upon TMZ treatment in FACS-sorted MGG18 (left) and GL261 NesLO cells (right) analyzed at day3 by FACS. Data are means ± SEM (n = 3; *p < 0.05; ***p < 0.001, ****p < 0.0001; one-way ANOVA, Turkey’s multiple comparisons test). I NesHI cell population upon IR alone or combinatorial therapy (25 μM TMZ and indicated IR dose) in NestinP-dTomato MGG4 by FACS at day3. Data are means ± SEM (n = 3 independent experiments; ***p < 0.001, ****p < 0.0001 vs the correspondent IR doses; two-way ANOVA, Turkey’s multiple comparisons test).
Fig. 3
Fig. 3. Preclinical and clinical validation of the therapy-induced functional GBM state.
A (Top) MGG4-GFP-Gluc intracranially implanted and subjected to whole-brain irradiation. (Left) Nestin immunostaining (Nestin, brown; hematoxylin, blue) and quantification of Nestin positive nuclei. Data are means ± SEM (n = 15 naïve, n = 13 IR-10Gy; **p < 0.01; unpaired two-sided t test). Scale bar, 100 μm. (Right) GSEA plot of the CL3 signature after in vivo IR. Only the probes aligned to human genes were taken in account. The normalized enrichment score (NES) and q.value are indicated. B (Top) MGG4-GFP-Gluc intracranially implanted and treated with TMZ. (Left) Nestin immunostaining (Nestin, red; hematoxylin, blue) and quantification of Nestin positive nuclei. Data are means ± SEM (n = 11 naïve (DMSO), n = 11 TMZ (10 mg/kg); **p < 0.01, unpaired two-sided t test). Scale bar, 100 μm (Right) GSEA plot of the CL3 signature after in vivo TMZ-treatment. Only the probes aligned to human genes were taken in account. The normalized enrichment score (NES) and q.value are indicated. C Pearson correlation analysis between the amount of Nestin staining in the tumor tissue at endpoint and the tumor growth velocity (GLuc increase divided by the number of days). 11 mice in total; p = 0,0002; Pearson test. D Overall survival and progression-free interval prognostic index estimation in TCGA-GBM (only IDH-wt patients). CL3 signature was used to stratify patients. Age and gender were not different in the two groups. E CL3 signature enrichment analysis in paired GBM patient’ tissues from the longitudinal GLASS consortium dataset. GSEA was performed on the paired tissues from each patient (first vs second surgery). Patients were stratified in 2 classes: with TMZ + IR after the first surgery or with no therapy. When q.val(NES) was less than 0.25 was considered to be “no change” (81 patients were analyzed in total). Distribution of patients and corresponding table. F Reactome over-representation analysis for the CL3 geneset and its interactors. G Gene Ontology analysis for the CL3 geneset in the KEGG or HALLMARKS datasets. H Biological functions by Ingenuity Pathway Analysis using the differentially expressed genes in CL3 vs the rest of the cells in MGG4 gliomaspheres from Fig. 1B. I Over-representation analysis for CL3 signature. The significantly over-represented pathways are colored and specified (performed with DecoPath). Schematics created with BioRender.com.
Fig. 4
Fig. 4. The CL3/NesHI state is already present in naïve GBM cells and is reversible, slow-cycling, senescent-like and resistant to therapy.
A GSEA plot of the CL3 signature between NesLO and NesHI cells in NestinP-dTomato MGG4, MGG18 and GL261 sorted-cells. Normalized enrichment score (NES) and q.value are indicated. B Genes in common in CL3/NesHI genesets. C Feature plot and violin graph of NesHI common genes, i.e. the genes commonly upregulated in at least 3 genesets, among NesHI MGG4, MGG18, GL261 and CL3 (see Supplementary Fig. 5B) (2 independent experiments and 2 time-points per experiment). D Feature plot for CL3/NesHI signature (32 genes) in the database from Ruiz-Moreno, 2023. E Feature plot for CL3/NesHI signature (32 genes) in the Proneural-Mesenchymal axis RNA-velocity from Wang et al. 2023. F Bubble plot of GBM states genesets in NesHI MGG4, MGG18 and GL261 cells. G Biological functions by IPA in NesHI MGG4, MGG18 and GL261 cells. H Kinase enrichment analysis (KEA) on phosphoproteome of NesHI vs NesLO-sorted MGG4 GBM cells (n = 5; z-score is indicator of the kinase activity estimated; significant kinase groups are plotted). Volcano plot of the phosphoproteome in Supplementary Fig. 8F. I Cell death analysis in NesLO and NesHI cell populations in NestinP-dTomato MGG4 cells upon IR or TMZ. Data are means ± SEM. (n = 3 independent experiments, two-way ANOVA, p value between NesLO and NesHI). J Area under the curve analysis of Sytox+ cells in MGG4, MGG18, and GL261 cells treated with 2, 5, 8, 10, 12 Gy overtime (1–7 days) by FACS. Data are means ± SEM (n = 3 independent experiments, two-way ANOVA, Turkey’s multiple comparison test, p value between NesLO and NesHI are shown). Dose-effect plots in Supplementary Fig. 9. K FACS analysis of CellTraceTM dye dilution during cell division. Data are means ± SEM (n = 3 independent experiments; ns, non-significant; ***p < 0.001). L Bar plots showing decrease in SubG1 and increase in G2M cell cycle phases in NesHI cells compared to NesLO in NestinP-dTomato MGG4 cells. Data are means ± SEM (n = 3; *p < 0,05; **p < 0.01; paired two-sided t test). M Decrease of NesHI cell population overtime in FACS-sorted NesHI MGG4 and NesHI GL261 cells by FACS. Data are means ± SEM (n = 3). N β-Gal senescence staining in FACS-sorted NesLO and NesHI MGG4 or GL261 cells. Data are means ± SEM (n = 3 independent experiments; ***p < 0.001; unpaired two-sided t-test).
Fig. 5
Fig. 5. VC-Resist GBM state co-opts brain vasculature, which in turn induces cell reprogramming towards the VC-Resist state.
A, (Left) Immunostaining of Nestin+ GBM cells (red) close to CD34+ blood vessels (brown) in the invasive front of intracranial MGG4 tumor sections. Similar results was seen in 4 mice. Scale bar, 10 μm. (Right) IF staining for Nestin, human mitochondria, CD31 (blood vessels) in MGG4-tumor-bearing mouse brain irradiated (10 Gy). Scale bar, 50 μm. B, (Left) Immunostaining of isolated brain blood vessel (laminin, red) and MGG4-GFP cells in the ex-vivo coculture model. Scale bar, 10 μm. (Right) Vascular association of NestinP-dTomato MGG4 cells after 7 h of co-culture. Data are means ± SEM (n = 4 independent experiments; **p < 0.01; unpaired two-sided t test). C Ibidi chamber slide for chemotaxis of NestinP-dTomato MGG4 cells to endothelial cells conditioned media (bEnd-CM). MGG4 cells directionality (Euclidean distance) in conditioned media (CM)-control (CT) in comparison to CT-CT and CM-CM conditions (n = 3; total number of cells quantified are >135; ns, non-significant; **p < 0.01; one-way ANOVA, Turkey’s multiple comparisons test). D, (Left) Trajectory plots of FACS-sorted NesHI and NesLO NestinP-dTomato MGG4 cells in response to bEnd conditioned media (CM) vs control (CT) condition (n = 3). (Right) Directionality (Euclidean distance) of FACS-sorted NesHI and NesLO cells towards bEnd conditioned media (CM). Data are means ± SEM, n = 3, total cells quantified are >65; **p < 0.01; unpaired two-sided t test. E Time-lapse imaging of cell state transition of a NesLO MGG4 cell to NesHI when close to blood vessel. Scale bar, 10 μm. F Vascular association in NesLO-sorted MGG4 cells after 7 h of co-culture. Data are means ± SEM (n = 4 independent experiments; **p < 0.01; unpaired two-sided t test). G Percentage of NesHI cells after 7 h of co-culture with different amounts of brain blood vessels by FACS. Data are means ± SEM (n = 4 independent experiments; *p < 0.05; unpaired two-sided t test). H Percentage of cell state transitions in NesLO cells cultured with blood vessels by FACS. Data are means ± SEM (n = 2 independent experiments, total number of cells analyzed >27; ****p < 0.0001; unpaired two-sided t test). I (Left), Time-lapse confocal micrographs showing the NesLO-to-NesHI reprogramming when close to blood vessels (lectin) and MGG4-Nes-GFP cell in brain slice organotypic model. Scale bar, 20 μm. (Right), Vascular association of NestinP-dTomato MGG4 cells after 20 h of co-culture. Tracking of 28 cells (****p < 0.0001, unpaired two-sided t test). Schematics created with BioRender.com.
Fig. 6
Fig. 6. Preclinical and clinical validation of the VC-Resist cell state post-therapy increase and localization.
A Intravital multiphoton imaging of GFP and NestinP-dTomato MGG4 cells. Blood vessels are visualized using CascadeBlue dextran. Similar results was seen in 4 mice. B 3D confocal imaging of cleared thick brain slices from MGG4 tumor-bearing mouse brains. Vessel co-opting GFP+ (magenta) and NesHI (dTomato, red) GBM cells at the leading edge of the tumor. C Vessel co-option at the invasive fronts of MGG4 tumors. GBM cells (hMito; red) close to blood vessels (CD34; brown). Similar results was seen in 10 mice. Scale bar, 50 μm D Percentage of vessel co-opting GBM cells in the infiltrative front or the density of infiltrative GBM cells in MGG4-tumor-beraring mice at 7 days post-irradiation (10 Gy) or post-TMZ-treatment (10 mg/kg). Data are means ± SEM; n = 7 (naïve), n = 8 (10 Gy), n = 6 (naïve, DMSO), n = 6 (TMZ, 10 mg/kg); *p < 0,05; unpaired two-sided t test. E GSEA analysis for the VC-Resist signature in the IvyGAP atlas. Perivascular region is named microvascular proliferation in the atlas (44 patients). The normalized enrichment score (NES) and q.value are indicated. F Surface plot of spatially resolved expression of VC-Resist (150 genes), VC-Resist (32 genes) and BEC_Capillary signatures of 3 patients. Infiltrative cortex and cellular tumor are delimited. Normalized GSEA score is color-coded. G Bubble plot of spatially weighted correlations across VC-Resist (150 genes), VC-Resist (32 genes) and BEC_Capillary signatures in n = 3 patients in both infiltrative cortex and cellular tumor. Spatially weighted correlation is color-coded. Schematics created with BioRender.com.
Fig. 7
Fig. 7. Angiocrine factors induce VC-Resist state transition, cell survival and partial proneural-to-mesenchymal transition.
A Nestin expression in NestinP-dTomato MGG4 cells in presence of conditioned media from blood vessels (CM-BV) or conditioned media from brain endothelial cells (CM-bEnd) using time-lapse imaging. Data are means ± SEM (n = 4 independent experiments; p = 0.0003; Spearman correlation). B Enrichment of GL261 NesHI cell population when cultured with bEnd-CM or control (CT) media by FACS. Data are means ± SEM (n = 3 independent experiments; p = 0.0016; paired two-side t test). C Nestin mRNA per cell in NestinP-dTomato MGG4 cells in the presence of bEnd.3 conditioned media (CM) or control media (CT). Total number of cells=46, unpaired two-sided t test. D (Left) Real-time micrographs of NestinP-dTomato MGG4 cells embedded in agarose gel showing the induced NesLO-to-NesHI transitions. (Right) Quantification of the reprogramming rate in NestinP-dTomato MGG4 cells pre-conditioned in CT or CM for 3 days (n = 76; ****p < 0.0001; unpaired two-sided t test). E Pearson correlation analysis of basal Nestin expression and fold change (FC) of Nestin expression in presence of conditioned media (bEnd-CM) in 4 GBM cell lines. X-axis: 1/basal CT values for Nestin expression by RT-PCR, Y-axis: Nestin expression FC with bEnd-CM. Patient-derived (blue) mouse (green) cell lines (n = 3; R = 0,88; p = 0,001; Pearson test). F Enrichment of MGG4 NesHI cell population in the presence of CM-bEnd (CM) both with (5 Gy) and without IR analyzed at day5 by FACS. Data are means (n = 2 independent experiments; *p < 0.05; **p < 0.01; two-way ANOVA, Turkey’s multiple comparisons test). G (Top), GSEA plots of the VC-Resist signature and senescence geneset (FRIDMAN_SENESCENCE_UP) in MGG4 co-cultured with blood vessels (Bottom), or GSC2 co-cultured with endothelial cells. The normalized enrichment score (NES) and q.value are indicated. H β-Gal senescence in NestinP-dTomato MGG4 cells after treatments (5 Gy of IR, 50 μM TMZ) or stimulated with CM-BV. Data are means ± SEM (n = 3 independent experiments; *p < 0.05; unpaired two-sided t test). I FACS analysis of CellTraceTM dye dilution during cell division in CT or CM-bEnd cells. Time to undergo cell division was calculated based on the mean fluorescent intensity values. Data are means ± SEM (n = 4, **p < 0.01). J Cell death (percentage of Sytox+ cells) in NestinP-dTomato MGG4 cells conditioned with bEnd.3 conditioned media (CM) or control (CT). Data are means ± SEM (n = 3 independent experiments; ***p < 0.001; unpaired two-sided t test).
Fig. 8
Fig. 8. Time-resolved proteome/phosphoproteome of the angiocrine-induced VC-Resist state transition unveils partial proneural-to-mesenchymal transition.
A Upregulated proteins in common between the patient-derived PN-MGG4 and the mouse MES-GL261 GBM cells treated for 6 or 72 h with control or blood vessel conditioned media (CM-BV) (n = 5 independent experiments). (Top) Venn graph of the common genes. (Middle) Kinase enrichment analysis (KEA) of the common proteins using the KEA3 web-based platform. Lower is the combined score, more probable is the activity of the kinase. (Bottom) Network among the top proteins in the KEA. Volcano plots are in Supplementary Fig. 14A. B Temporal proteomic profiling of cell plasticity in GBM exposed to blood vessel conditioned media (CM-BV). Y-axes are means of all log2(fold change) between CT and CM-BV for Neftel’ cell states (20–30 markers per GBM classifier) or VC-Resist (32 proteins), excluding the infinite values. C More phosphorylated proteins in common between the patient-derived PN-MGG4 and the mouse MES-GL261 GBM cells treated for 6 or 72 h with control (CT-CM) or blood vessel conditioned media (BV-CM). (Top) Venn graph of the common genes. (Bottom) Word cloud plot for the commonly hyper-phosphorylated proteins. The largest fonts represent proteins that are present in all four datasets, while the smallest fonts are for proteins shared in just 2 datasets (from different cell lines). Volcano plots are in Supplementary Fig. 14C. D Kinase enrichment analysis (KEA) on phosphoproteome in the patient-derived PN-MGG4 and the mouse MES-GL261 GBM cells treated for 72 h with control (CT-CM) or blood vessel conditioned media (BV-CM) (n = 5 independent experiments; z-score is indicator of the kinase activity estimated; significant in black and not-significant in gray).
Fig. 9
Fig. 9. Therapy- and vascular-induced VC-Resist state transition is driven by FGFR1-YAP1 activation.
A YAP1 Ingenuity Pathway Analysis (IPA) z-scores for all conditions and cell lines with corresponding p value. B Level of YAP1 S127-phosphorylation. Quantification of immunoblot using YAP and p-YAP antibodies for YAP activation in VC-Resist state transitions. Data are means ± SEM (n = 3 independent experiments; *p < 0.05; unpaired two-sided t test). Quantification of YAP localization in FACS-sorted MGG4 (C), GL261 (D) NesLO or NesHI cells or in MGG4 bEnd-conditioned (CM) or control (CT) media (E) (n = 326 cells for MGG4 NesLO, 315 cells for MGG4 NesHI; 343 cells for GL261 NesLO; 316 cells for GL261 NesHI; 377 cells for CT; 361 cells for CM; 3 independent experiments; unpaired two-sided t test). F(Left) FACS plots of YAP-activation (dsRed) in MGG4 cells treated with bEnd conditioned media (bEnd-CM) vs control (CTRL). (Top right) YAP-responsive reporter lentiviral construct. (Bottom right) YAP activation in MGG4 cells treated with blood vessel conditioned media (bEnd-CM) vs control (CTRL). Data are means ± SEM (n = 4 independent experiments; *p < 0.05; unpaired two-sided t test). G Inhibition of the BV-CM induced enrichment of NesHI when NestinP-dTomato MGG4 cells are silenced for YAP1 (siYAP1) in comparison with scramble (siCTRL) by FACS. Data are means ± SEM (n = 3 independent experiments; **p < 0.01; paired two-sided t test). H Nestin expression in NestinP-dTomato MGG4 cells silenced for YAP1 (siYAP1) or scramble (siCTRL) in presence of conditioned media from blood vessels using live-cell imaging. Data are means ± SEM (n = 3 independent experiments; p < 0.001; Spearman correlation). I GSEA plot of the VC-Resist signature in verteporfin-treated GBM cells vs control from Barrette et al., 2021. J YAP activation is in silico predicted by using the Molecular Activity Predictor with the genes from VC-Resist signature. K, L The FGF-trap compound NSC12 inhibits the bEnd conditioned media (bEnd-CM) or the irradiation-induced reprogramming, while it does not modify the maintenance of NesHI state. Data are means ± SEM (n = 3 independent experiments; *p < 0.05; **p < 0.01 vs the CM/vehicle condition; paired two-sided t test). M The FGF-trap inhibitor NSC12 blocks the bEnd-CM-induced YAP-responsive reporter activation. YAP activation in MGG4 cells treated with conditioned media (bEnd-CM) vs control (CT) (n = 3 independent experiments; *p < 0.05; ***p < 0.001 vs the respective CM/vehicle condition; paired two-sided t test).
Fig. 10
Fig. 10. Here we show a cell state called VC-Resist that, even if already present in naïve tumors at different levels, is strongly induced by chemoradiation and angiocrine factors from the brain blood vessels.
The VC-Resist cells are intermediate in the PMT and are highly resistant to therapy, vessel co-opting, senescent-like and slow-cycling. Considering our discoveries, we propose a model wherein chemoradiation leads to vessel co-option and resistance to therapy via reprogramming of GBM cells into the VC-Resist cell state. This creates a self-perpetuating cycle, as increased resistance and vessel co-option contribute to the recurrence of GBM.

References

    1. Ostrom QT, Cioffi G, Waite K, Kruchko C, Barnholtz-Sloan JS. CBTRUS statistical report: Primary brain and other central nervous system tumors diagnosed in the United States in 2014–2018. Neuro Oncol. 2021;23:iii1–iii105. doi: 10.1093/neuonc/noab200. - DOI - PMC - PubMed
    1. Louis DN, et al. The 2021 WHO classification of tumors of the central nervous system: A summary. Neuro Oncol. 2021;23:1231–1251. doi: 10.1093/neuonc/noab106. - DOI - PMC - PubMed
    1. Stepanenko, A. A. & Chekhonin, V. P. Recent advances in oncolytic virotherapy and immunotherapy for glioblastoma: A glimmer of hope in the search for an effective therapy? Cancers (Basel)1010.3390/cancers10120492 (2018). - PMC - PubMed
    1. Bikfalvi A, et al. Challenges in glioblastoma research: focus on the tumor microenvironment. Trends Cancer. 2023;9:9–27. doi: 10.1016/j.trecan.2022.09.005. - DOI - PubMed
    1. Stupp R, et al. Radiotherapy plus concomitant and adjuvant temozolomide for glioblastoma. N. Engl. J. Med. 2005;352:987–996. doi: 10.1056/NEJMoa043330. - DOI - PubMed

Publication types

MeSH terms