. 2024 Apr 29;15(1):3631.
doi: 10.1038/s41467-024-47867-4.

Mitochondrial complex I deficiency stratifies idiopathic Parkinson's disease

Affiliations

Mitochondrial complex I deficiency stratifies idiopathic Parkinson's disease

Irene H Flønes et al. Nat Commun. .

Abstract

Idiopathic Parkinson's disease (iPD) is believed to have a heterogeneous pathophysiology, but molecular disease subtypes have not been identified. Here, we show that iPD can be stratified according to the severity of neuronal respiratory complex I (CI) deficiency, and identify two emerging disease subtypes with distinct molecular and clinical profiles. The CI deficient (CI-PD) subtype accounts for approximately a fourth of all cases, and is characterized by anatomically widespread neuronal CI deficiency, a distinct cell type-specific gene expression profile, increased load of neuronal mtDNA deletions, and a predilection for non-tremor dominant motor phenotypes. In contrast, the non-CI deficient (nCI-PD) subtype exhibits no evidence of mitochondrial impairment outside the dopaminergic substantia nigra and has a predilection for a tremor dominant phenotype. These findings constitute a step towards resolving the biological heterogeneity of iPD with implications for both mechanistic understanding and treatment strategies.


Conflict of interest statement

The authors declare no competing interests.

Figures

Fig. 1
Fig. 1. Neuronal CI deficiency stratifies iPD.
SNpc (a) and PFC (b) sections immunohistochemically stained for CI (NDUFS4). The stippled lines in a indicate neuromelanin in dopaminergic neurons of the SNpc. Arrowheads show examples of CI deficient (green) and -intact (black) neurons. Scalebar: 50 µm. c, d Inter-rater and inter-region replicability of the proportion of CI positive neurons in the PFC. Bland–Altmann plots showing the difference between the measurements of observer 1 (O1) and observer 2 (O2) (c), and the difference between measurements by observer 1 in three different regions of the same PFC sections: region 1 (R1) vs region 2 (R2), or region 3 (R3) (d). e, f Scatter plots showing the proportion (in %) of CI positive neurons (y-axes) of controls and individuals with iPD (x-axes) in the SNpc (controls NOR: n = 11, PD NOR: n = 25, controls ESP: n = 11, PD ESP: n = 35; e) and PFC (controls NOR: n = 12, PD NOR: n = 40, controls ESP: n = 10, PD ESP: n = 49; (f). Bars show median and interquartile range. The groups were compared using a two-sided Mann–Whitney U-test. The test statistics are given in Table 2. Multiple comparison adjustments were not made. g Scatter plots showing the proportion (in %) of CI positive neurons (y-axes) in the PFC of controls and individuals with iPD (x-axes). K-means clustering classified the iPD subjects into three groups: nCI-PD (purple), CI-PD mild (dark green) and CI-PD severe (light green), in each of the NOR and ESP cohorts and in the combined cohorts.
Fig. 2
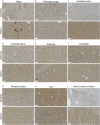
Fig. 2. CI and VDAC1 immunostaining in selected brain regions.
Representative images of immunostaining against CI (NDUFS4) and VDAC1, in areas showing CI deficiency in iPD; substantia nigra pars compacta (SNpc; a), prefrontal cortex (b), occipital cortex (c), cingulate gyrus (d), putamen (e), amygdala (f), temporal cortex (g), CA1 of the hippocampus (h) and inferior olivary nucleus (i). Green arrowheads show examples of CI negative neurons. No negative neurons were observed in the VDAC1 staining. Scalebar: 50 µm.
Fig. 3
Fig. 3. Anatomical distribution of neuronal CI deficiency in the nCI-PD and CI-PD groups.
a Box plots showing the proportion (in %) of CI positive neurons in 16 brain regions from controls (gray), and individuals with nCI-PD (purple) and CI-PD (green). The boxplot from PFC represents the spread in all individuals, dots show individuals included in downstream analyses for regional CI staining. Box plots show individual values (dots), median and interquartile range (box) and minimum-maximum range (whiskers). Statistical analysis was not performed in the PFC, since this region was used to classify the samples, and the samples were selected to represent the full spectrum of CI status for each group. Nominal p-values of two-sided Mann-Whitney U-tests are shown. Multiple testing correction was not performed for these analysis, due to the relatively small sample size and high correlation between the CI state of different anatomical regions per individual, as illustrated in the heatmap (c). All individuals within the CI-PD group are shown in the same green boxplot, but differentiated by the color of the points into mild (dark green) and severe (light green) CI-PD. b Structural brain maps illustrating the anatomical distribution of neuronal CI deficiency in the control, nCI-PD and CI-PD groups. The median proportion of CI positive neurons is shown as a heatmap. Brain illustrations are modified images from the 7MRI atlas published by Edlow et al.. c Hierarchical clustering of the median proportion of CI positive neurons in each group. SNpc substantia nigra pars compacta, PFC prefrontal cortex, OC occipital cortex, TC temporal cortex, Sub subiculum, Am amygdala, CG cingulate gyrus, Put putamen, GPe external globus pallidus, GPi internal globus pallidus, ION inferior olivary nucleus, CC cerebellar cortex, DN dentate nucleus, Hi hippocampal regions CA4-CA1, Ctrl controls. n/a: statistical comparison not performed.
Fig. 4
Fig. 4. Clinical differences between CI-PD and nCI-PD.
Box plots (a–e) show individual values (dots), median and interquartile range (box) and minimum-maximum range (whiskers) of age of onset (a), age of death (b), total UPDRS at final clinical examination (c), total number of weekly ethanol units at the time of diagnosis (d), and total number of daily cigarettes at the time of diagnosis (e) for the three iPD groups (nCI-PD: purple, CI-PD mild: dark green, CI-PD severe: light green). Statistical significance was tested between nCI-PD and the entire CI-PD group (i.e., not differentiating between mild and severe), due to the low number of individuals in the severe group, using the two-sided Mann–Whitney U-test. Bar plots (f–i) show for each iPD subgroup the distribution (in percentage) of males/females (f), presence of dementia at final clinical examination (g), PIGD/TD phenotype (h) and AR/TD phenotype (i), at the time of diagnosis within each iPD group. Statistical significance was tested using the X2 test. Demographic data, data on dementia at time of death, and the AR/TD-clinical phenotypes were available from both cohorts. All other clinical variables were available only from the NOR cohort. The number of included individuals is not equal in the different comparisons and is shown in Supplementary Data 5. AR akinetic rigid, TD tremor dominant, PIGD postural instability and gait disorder, UPDRS Unified Parkinson’s Disease Rating Scale.
Fig. 5
Fig. 5. The nCI-PD and CI-PD groups show different neuronal mtDNA profiles.
Single neurons were collected from frozen PFC sections using laser-microdissection and mtDNA was analyzed for copy number (CN) and deletion proportion using qPCR. Eight to sixteen single neurons were assessed per individual from individuals with CI-PD (n = 6), nCI-PD (n = 9) and controls (n = 7). a Microphotograph of a representative PFC section, stained with cresyl violet and showing neurons before (#) and after (*) microdissection. Scale bar 10 µm. b Neuronal mtDNA deletion levels. c Total neuronal mtDNA copy number. d Non-deleted neuronal mtDNA copy number. Box plots (b–c) show median and interquartile range (box) and minimum-maximum range (whiskers) of the mean values for each individual (points) per group. Statistical significance of group difference was tested using two-sided ANOVA. CN copy number, Ctrl control.
Fig. 6
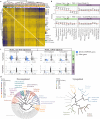
Fig. 6. nCI-PD and CI-PD groups exhibit distinct transcriptomic profiles in the PFC.
a Hierarchical clustering of the samples based on sample-sample correlation. The heatmap colors indicate Pearson’s correlation values between each pair of samples. AGE: age of death. b The estimated group difference (y-axis) in MGPs of the cell types (x-axis) based on linear regression using the two different models are shown. The cell types are described in Mancarci et al.. The estimate and the 95% confidence intervals are indicated by the point and the whiskers, respectively (c) Significance (shown as -log10 of the adjusted p-value) of genes included in the KEGG OXIDATIVE_PHOSPHORYLATION pathways (blue) or all other genes (gray) among the downregulated/upregulated genes based on a model not adjusting (Model_2) or adjusting (Model_1) for the confounded MGPs, in each of the iPD subtypes. Dashed line indicates adjusted pvalue of 0.05. Boxplots represent the interquartile range (IQR) with the median indicated by the bold line. Whiskers are extensions from the top and the bottom of the boxplot by a value of 1.5*IQR. Values outside of the whisker range are indicated by circles. d Visualization of the enrichment analysis outcome of the nCI-PD group, based on DE analysis using Model_2. Each leaf of the tree represents one significantly enriched gene-set. Jaccard similarity was used to cluster the gene-sets based on semantic similarity. Each cluster was annotated to represent the main function represented by its members. The names of the specific gene-sets are shown in Supplementary Fig. S7 (downregulated) and Supplementary Fig. S8 (upregulated).
Fig. 7
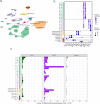
Fig. 7. Single-nuclei RNA-seq shows distinct cell type-specific transcriptional profiles for CI-PD and nCI-PD.
a UMAP plot of the filtered snRNA-seq dataset (117,105 nuclei) showing the clustering in the main cortical cell types (ex: excitatory neurons, in: inhibitory neurons, oligodendrocytes, astrocytes, microglia, OPCs, and endothelial cells). b Dotplot showing the average cell type markers’ expression in each of the 28 subclusters identified by Seurat, unequivocally mapping the nuclei to the main cortical known cell types. The color of the dots indicates average scaled expression, the size representing the proportion of nuclei in the cluster that express the marker. c Summary of the number of differentially expressed genes in autosomes (at FDR < 5%) within each cluster for the CI-PD vs controls (left hand side panel, green bars), for the nCI-PD vs controls (center panel, purple bars), and common between the two contrasts (right hand side panel, gray bars).

References

    1. Bloem BR, Okun MS, Klein C. Parkinson’s disease. Lancet. 2021;397:2284–2303. doi: 10.1016/S0140-6736(21)00218-X. - DOI - PubMed
    1. Kalia LV, Lang AE. Parkinson’s disease. Lancet. 2015;386:896–912. doi: 10.1016/S0140-6736(14)61393-3. - DOI - PubMed
    1. Athauda D, Foltynie T. The ongoing pursuit of neuroprotective therapies in Parkinson disease. Nat. Rev. Neurol. 2015;11:25–40. doi: 10.1038/nrneurol.2014.226. - DOI - PubMed
    1. Espay AJ, et al. Biomarker-driven phenotyping in Parkinson disease: a translational missing link in disease-modifying clinical trials. Mov. Disord. J. Mov. Disord. Soc. 2017;32:319–324. doi: 10.1002/mds.26913. - DOI - PMC - PubMed
    1. Dickson DW. Parkinson’s Disease and Parkinsonism: Neuropathology. Cold Spring Harb. Perspect. Med. 2012;2:a009258–a009258. doi: 10.1101/cshperspect.a009258. - DOI - PMC - PubMed

Publication types

MeSH terms

Substances

Supplementary concepts