Comparative Study
. 2024 Apr 29;14(1):9785.
doi: 10.1038/s41598-024-57981-4.

Variability and bias in microbiome metagenomic sequencing: an interlaboratory study comparing experimental protocols

Affiliations
Comparative Study

Variability and bias in microbiome metagenomic sequencing: an interlaboratory study comparing experimental protocols

Samuel P Forry et al. Sci Rep. .

Abstract

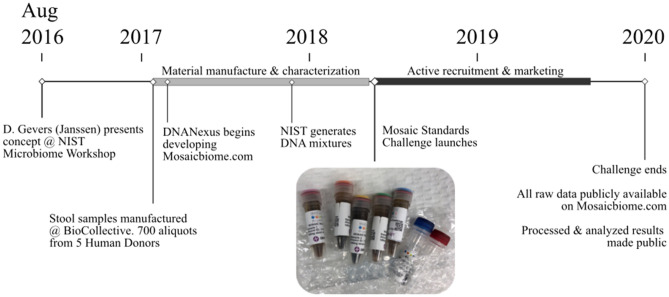
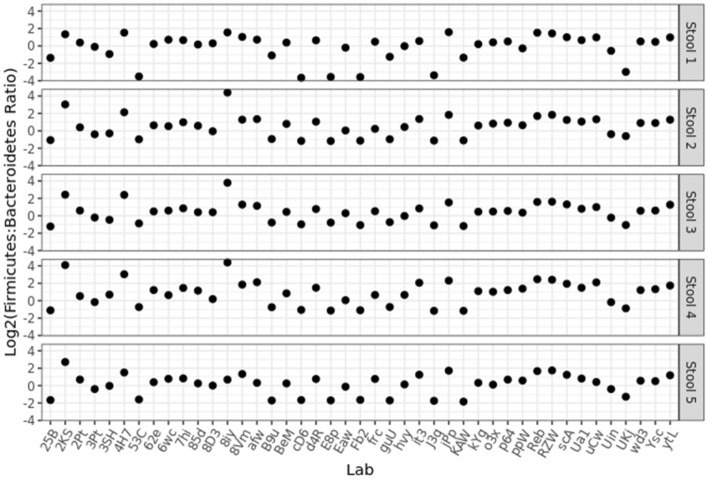
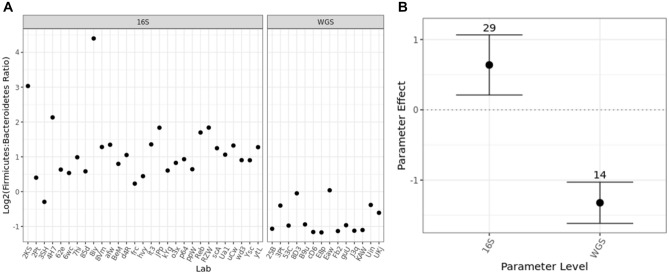
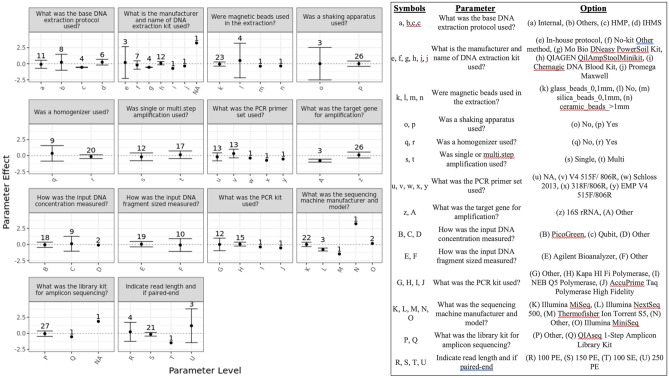
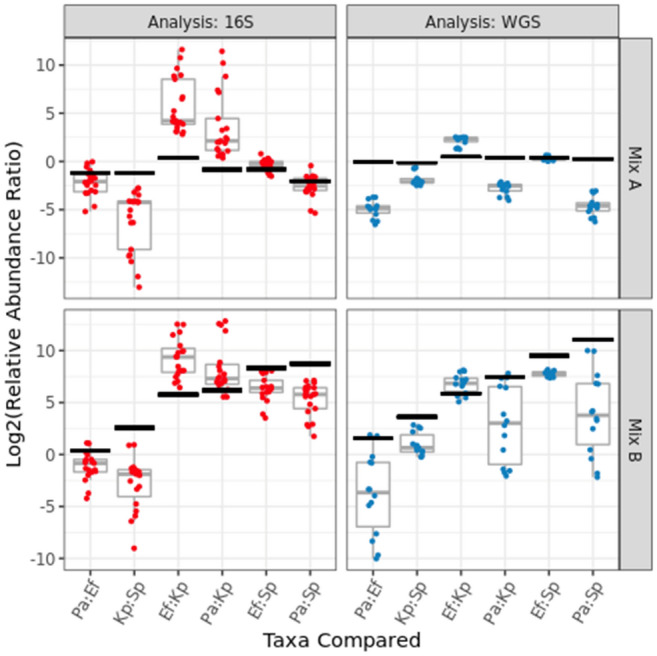
Several studies have documented the significant impact of methodological choices in microbiome analyses. The myriad of methodological options available complicate the replication of results and generally limit the comparability of findings between independent studies that use differing techniques and measurement pipelines. Here we describe the Mosaic Standards Challenge (MSC), an international interlaboratory study designed to assess the impact of methodological variables on the results. The MSC did not prescribe methods but rather asked participating labs to analyze 7 shared reference samples (5 × human stool samples and 2 × mock communities) using their standard laboratory methods. To capture the array of methodological variables, each participating lab completed a metadata reporting sheet that included 100 different questions regarding the details of their protocol. The goal of this study was to survey the methodological landscape for microbiome metagenomic sequencing (MGS) analyses and the impact of methodological decisions on metagenomic sequencing results. A total of 44 labs participated in the MSC by submitting results (16S or WGS) along with accompanying metadata; thirty 16S rRNA gene amplicon datasets and 14 WGS datasets were collected. The inclusion of two types of reference materials (human stool and mock communities) enabled analysis of both MGS measurement variability between different protocols using the biologically-relevant stool samples, and MGS bias with respect to ground truth values using the DNA mixtures. Owing to the compositional nature of MGS measurements, analyses were conducted on the ratio of Firmicutes: Bacteroidetes allowing us to directly apply common statistical methods. The resulting analysis demonstrated that protocol choices have significant effects, including both bias of the MGS measurement associated with a particular methodological choices, as well as effects on measurement robustness as observed through the spread of results between labs making similar methodological choices. In the analysis of the DNA mock communities, MGS measurement bias was observed even when there was general consensus among the participating laboratories. This study was the result of a collaborative effort that included academic, commercial, and government labs. In addition to highlighting the impact of different methodological decisions on MGS result comparability, this work also provides insights for consideration in future microbiome measurement study design.


Conflict of interest statement

The authors declare no competing interests.

Figures

Figure 1
Figure 1
Study design timeline. Inset image shows material received by participants.
Figure 2
Figure 2
Principal coordinate analysis of donor samples in the BioCollective stool collection. Stool samples included in the Mosaic study (green points) were selected based on their PCoA diversity within the constellation of samples available from the BioCollective. All selected donors self-reported being healthy except BC001485, who reported Parkinson’s Disease.
Figure 3
Figure 3
Metagenomic sequencing analysis of Mosaic stool samples to determine homogeneity of samples. The bar chart shows the relative abundance as measured by 16S rRNA MGS at the genus level for 10 replicate tubes from each stool sample (stool 1–5). Taxa colors denote the 17 most abundant genera overall, as well as an exogenously added internal standard; all other genera are grouped as ‘other’ and shown in grey. MGS analysis by WGS also exhibited good homogeneity (Fig. SI-1).
Figure 4
Figure 4
Principal coordinate plots of the Bray–Curtis dissimilarities for 16S and WGS analyses exhibits clustering by Stool sample. Each data point represents a distinct laboratory analysis of each sample. The separation in the clusters is attributed to methodological differences between labs.
Figure 5
Figure 5
The Firmicutes:Bacteroidetes ratio was calculated for all stool samples and plotted for each participating laboratory. Of note, data submission was anonymous, so multiple submissions from the same research center would appear as distinct labs.
Figure 6
Figure 6
The effect of analysis strategy (16S versus WGS) on the Firmicutes:Bacteroidetes ratio was readily observed for just one stool sample by simple grouping (A), and the effect was quantified (B) by dividing the average results among labs reporting the specified parameter level by the average results overall. In (B), this parameter effect was plotted on a log (base 2) scale, such that the horizontal line at 0 denotes the null hypothesis of no effect; error bars show the 99% confidence interval. Quantified effects for the other stool samples were similar and are included in Fig. SI-3. Similar stratification was observed when measuring other taxa ratios (Fig. SI-4) or with each sample’s Inverse Simpson alpha diversity (Fig. SI-5).
Figure 7
Figure 7
Within labs performing 16S amplicon sequencing, the parameter effect on the Firmicutes:Bacteroidetes ratio was calculated as described in Fig. 6 for each relevant metadata parameter. Shown here from just one stool sample, results from other stool samples were similar and are provided in Fig. SI-6.
Figure 8
Figure 8
For the DNA mixtures, independently measured ‘ground truth’ results (black 99% confidence intervals) for the ratios between taxa relative abundances can be compared to each individual lab’s amplicon (red points) or shotgun (blue points) metagenomic sequencing results, as well as the range of results (grey boxplots) among participating labs. The taxa in Mix A were roughly equally abundant, while the Mix B sample exhibited groups of taxa added at tenfold dilutions. The horizontal axis identifies the taxa (known to be present in the DNA mixtures) whose observed relative abundances were ratioed. The ground truth values were scaled to account for known 16S copy numbers (for amplicon sequencing) or genome sizes (for shotgun sequencing), so the ‘actual’ ratios vary slightly between the two analyses even though the DNA concentrations are identical. Genus-level taxonomic bar charts by (16S and WGS analysis) show the average composition observed for each DNA mixture (Fig. SI-10).

References

    1. Quince C, et al. Shotgun metagenomics, from sampling to analysis. Nat. Biotechnol. 2017;35(9):833–844. doi: 10.1038/nbt.3935. - DOI - PubMed
    1. Lu J, et al. Bracken: Estimating species abundance in metagenomics data. PeerJ Comput. Sci. 2017;3:e104. doi: 10.7717/peerj-cs.104. - DOI
    1. Knight R, et al. Best practices for analysing microbiomes. Nat. Rev. Microbiol. 2018;16(7):410–422. doi: 10.1038/s41579-018-0029-9. - DOI - PubMed
    1. Jovel J, et al. Characterization of the gut microbiome using 16S or shotgun metagenomics. Front. Microbiol. 2016;7:459. doi: 10.3389/fmicb.2016.00459. - DOI - PMC - PubMed
    1. Simner PJ, Miller S, Carroll KC. Understanding the promises and hurdles of metagenomic next-generation sequencing as a diagnostic tool for infectious diseases. Clin. Infect. Dis. 2018;66(5):778–788. doi: 10.1093/cid/cix881. - DOI - PMC - PubMed

Publication types

Substances