. 2024 Jun;38(6):1266-1274.
doi: 10.1038/s41375-024-02258-y. Epub 2024 Apr 29.

Clonal hematopoiesis-derived therapy-related myeloid neoplasms after autologous hematopoietic stem cell transplant for lymphoid and non-lymphoid disorders

Affiliations

Clonal hematopoiesis-derived therapy-related myeloid neoplasms after autologous hematopoietic stem cell transplant for lymphoid and non-lymphoid disorders

Hussein Awada et al. Leukemia. 2024 Jun.

Abstract

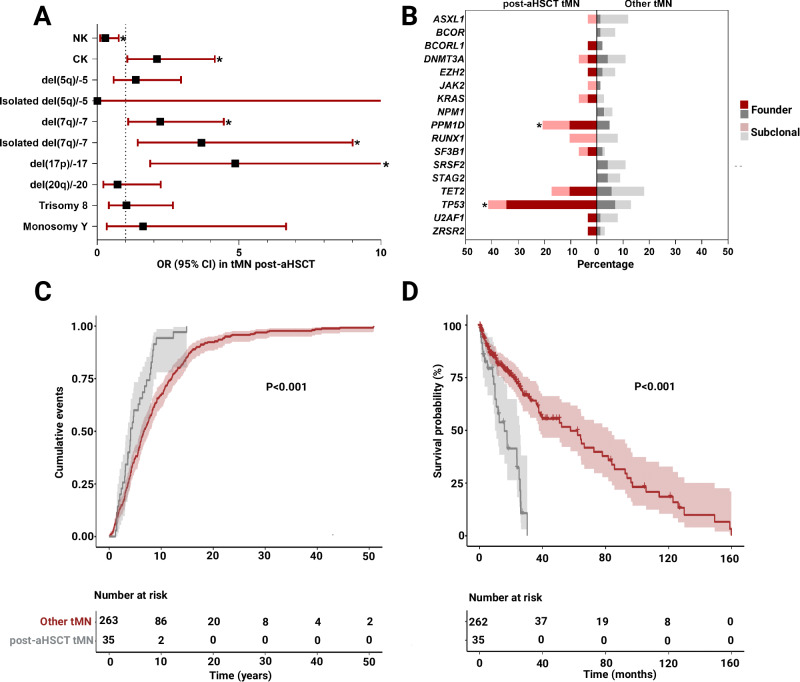
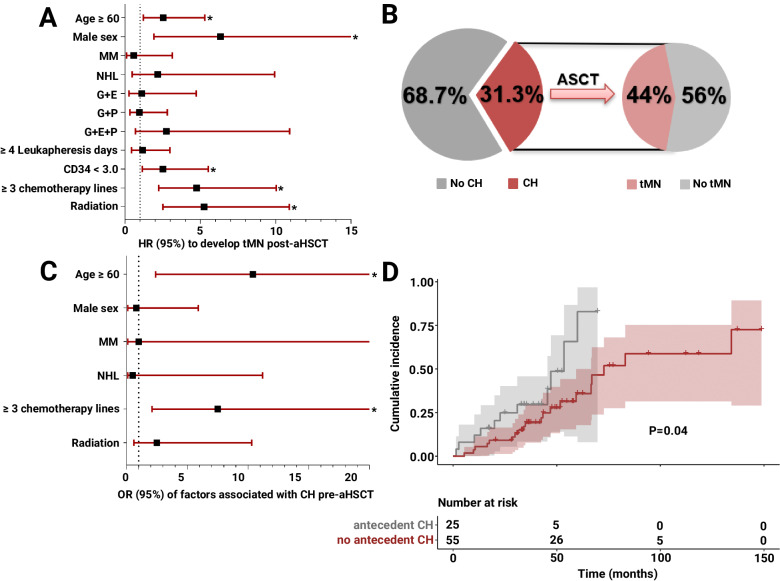
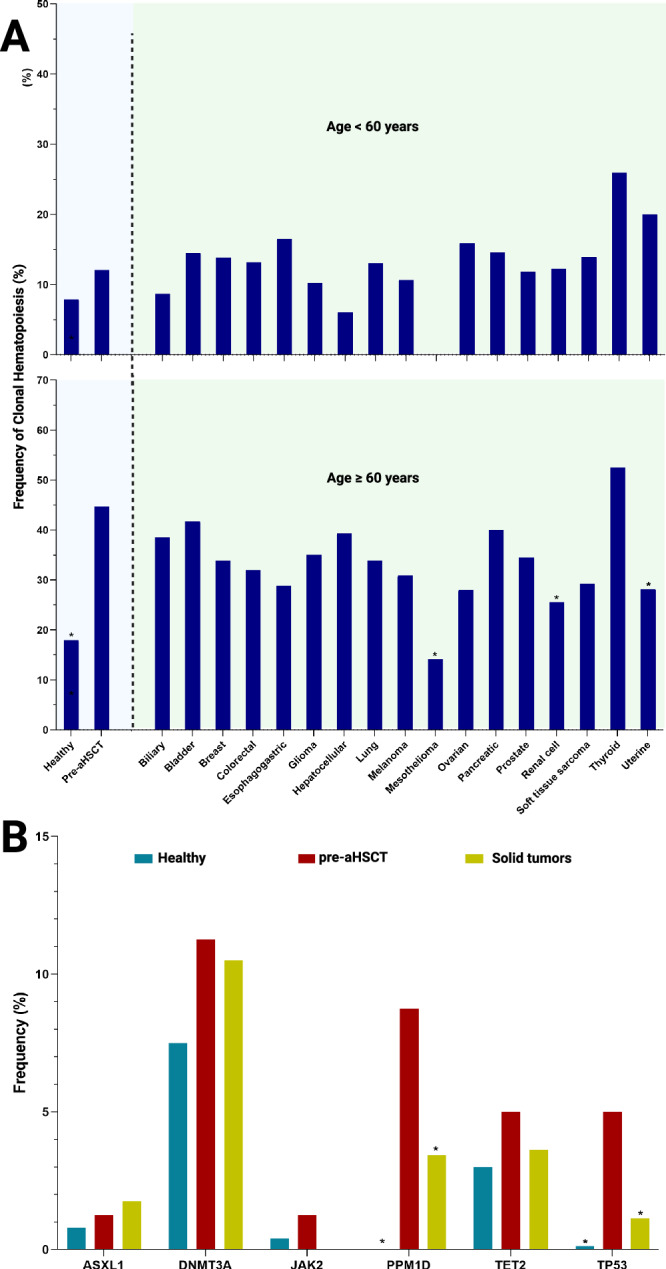
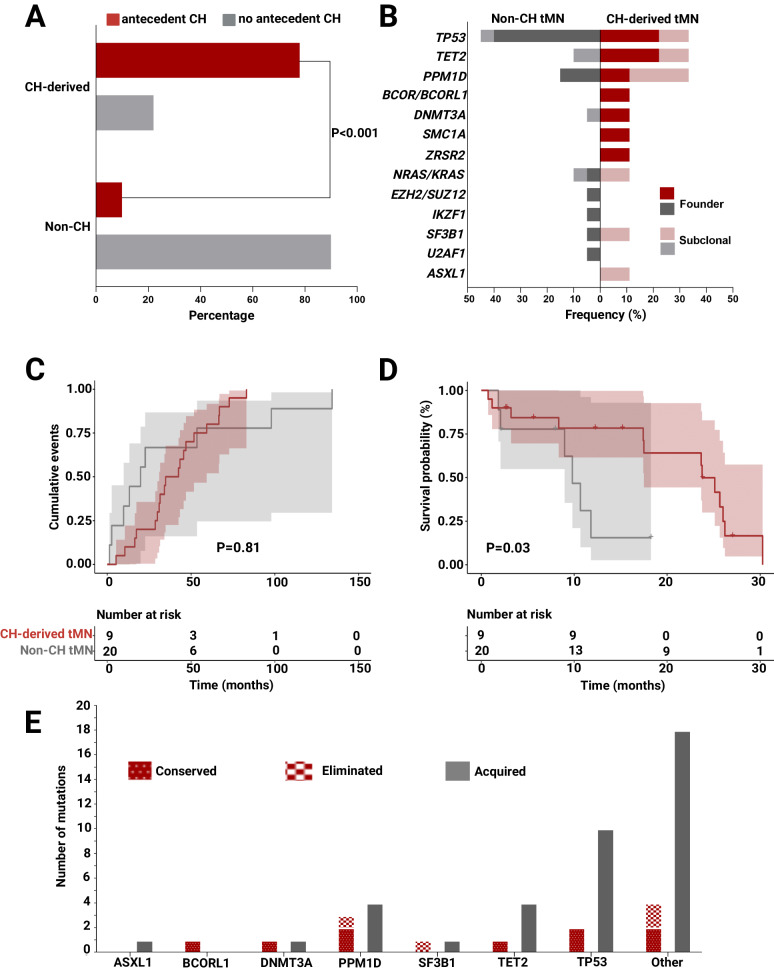
Therapy-related myeloid neoplasms (tMN) are complications of cytotoxic therapies. Risk of tMN is high in recipients of autologous hematopoietic stem cell transplantation (aHSCT). Acquisition of genomic mutations represents a key pathogenic driver but the origins, timing and dynamics, particularly in the context of preexisting or emergent clonal hematopoiesis (CH), have not been sufficiently clarified. We studied a cohort of 1507 patients undergoing aHSCT and a cohort of 263 patients who developed tMN without aHSCT to determine clinico-molecular features unique to post-aHSCT tMN. We show that tMN occurs in up to 2.3% of patients at median of 2.6 years post-AHSCT. Age ≥ 60 years, male sex, radiotherapy, high treatment burden ( ≥ 3 lines of chemotherapy), and graft cellularity increased the risk of tMN. Time to evolution and overall survival were shorter in post-aHSCT tMN vs. other tMN, and the earlier group's mutational pattern was enriched in PPM1D and TP53 lesions. Preexisting CH increased the risk of adverse outcomes including post-aHSCT tMN. Particularly, antecedent lesions affecting PPM1D and TP53 predicted tMN evolution post-transplant. Notably, CH-derived tMN had worse outcomes than non CH-derived tMN. As such, screening for CH before aHSCT may inform individual patients' prognostic outcomes and influence their prospective treatment plans. Presented in part as an oral abstract at the 2022 American Society of Hematology Annual Meeting, New Orleans, LA, 2022.


Conflict of interest statement

The authors declare no competing interests.

Figures

Fig. 1
Fig. 1. Characteristics of post-aHSCT tMN vs. other tMN.
A Forest plot of Odds ratios (OR, and 95% CI) of cytogenetic abnormalities in post-aHSCT tMN relative to other tMN, with higher odds of post-aHSCT tMN to have complex karyotypes (OR 2.1, P = 0.5), del(7q)/7- (OR 2.2, P = 0.03), isolated del(7q)/7- (OR 3.7, P = 0.01) and del(17p)/17- (OR 4.7, P = 0.003), while other tMN patients are more likely to have normal karyotypes (OR 3.6, P = 0.02), with * denoting significance. B shows the mutational landscapes (top mutated genes) of post-aHSCT tMN compared to other tMN, including more frequent PPM1D (OR 5.1, P = 0.003) and TP53 mutations (OR 4.9, P < 0·001) post-aHSCT, where * denotes P < 0.05. C Cumulative incidence demonstrates the significantly shorter latency period from first exposure to chemotherapy to tMN diagnosis in patients who had had subsequent aHSCT vs. no aHSCT (median 4.2 vs. 6.6 years, P < 0.001). D Kaplan-Meier curves showing the overall survival of post-aHSCT tMN to be significantly shorter than that of other tMN (median 17.7 vs. 57.7 months, P < 0.001).
Fig. 2
Fig. 2. Risks of post-aHSCT tMN and study of CH prevalence pre-transplant.
A Forest plot of the cox proportional hazard ratios of clinical factors that independently increase the risk of tMN post-aHSCT per multivariate analysis of 1507 patients undergoing aHSCT, including age ≥ 60 years at aHSCT (HR 2.5, 95% CI 1.2–5.3), male sex (HR 6.3, 95%CI 1.9–20.9), graft cellularity of CD34 + < 3.0 × 106/Kg (HR 2.2, 95% CI 1.1–5.5), ≥ 3 lines of chemotherapy pre-aHSCT (HR 4.7, 95% CI 2.2–10.0), and prior radiation (OR 5.2, 95% CI 2.5–10.9), with * indicating P < 0·05. B illustrates the prevalence of CH pre-aHSCT in 31.3% of the patients, of whom 44% developed tMN post-aHSCT. C Forest plot of the OR of clinical factors that influence CH prevalence pre-aHSCT as per multivariate analysis of a case control cohort of 80 patients with available samples pre-aHSCT, including age ≥ 60 years (OR 10.4, 95% CI 2.4–64.2) and ≥ 3 lines of chemotherapy (OR 7.5, 95% CI 2.1–33.5), with * indicating statistical significance. D Cumulative incidence of tMN development post-aHSCT in patients with antecedent CH vs. others (median 53.5 vs. 72.8 months; P = 0.04).
Fig. 3
Fig. 3. Prevalence of CH mutations pre-aHSCT compared to healthy patients and solid tumors.
A Bar chart comparing the prevalence of CH in our pre-aHSCT cohort to healthy controls aged < 60 years (12.5 vs. 7.9%, P = 0.3) and ≥ 60 years (43.8 vs. 17.9%, P < 0.001), and to each of 17 types of solid tumors across the < 60 and ≥ 60 years age groups (Supplementary Fig. S8), with * indicating significant differences compared to the same age subgroup of our pre-aHSCT cohort. B Bar chart showing the higher frequency of lesions involving PPM1D (8.8 vs. 3.4%, P = 0.02) and TP53 mutations (5.0 vs. 1.1%, P = 0.002) pre-aHSCT vs. all solid tumors.
Fig. 4
Fig. 4. Characteristics of CH-derived vs. non-CH tMN post-aHSCT and clonal dynamics during aHSCT.
A Bar chart showing the significantly higher OR of antecedent CH as a precursor to CH-derived tMN post-aHSCT (OR 31.5, P < 0.001). B compares the molecular landscape of CH-derived vs. non-CH tMN, with CH-derived disease being TET2 and TP53 predominant while non-CH tMN primarily TP53-related. C compares times to tMN diagnosis post-aHSCT in CH-derived vs. non-CH tMN (median 19.9 vs. 38.6 months, P = 0.81). In (D), Kaplan Meier curves demonstrate poorer prognosis of CH-derived tMN vs. non-CH disease post-transplant (median 9.8 vs. 23.8 months, P = 0.03), with disease aggressiveness noted by higher 1-year mortality rates (66.7 vs. 20%, P = 0.01). E Bar chart of gene-specific pre-aHSCT clones that were conserved, eliminated, and acquired through the transplant process as determined by comparisons between pre-aHSCT and post-aHSCT samples.

References

    1. Arber DA, Orazi A, Hasserjian R, Thiele J, Borowitz MJ, Le Beau MM, et al. The 2016 revision to the World Health Organization classification of myeloid neoplasms and acute leukemia. Blood. 2016;127:2391–405. doi: 10.1182/blood-2016-03-643544. - DOI - PubMed
    1. Arber DA, Orazi A, Hasserjian RP, Borowitz MJ, Calvo KR, Kvasnicka HM, et al. International Consensus Classification of Myeloid Neoplasms and Acute Leukemias: integrating morphologic, clinical, and genomic data. Blood. 2022;140:1200–28. doi: 10.1182/blood.2022015850. - DOI - PMC - PubMed
    1. Khoury JD, Solary E, Abla O, Akkari Y, Alaggio R, Apperley JF, et al. The 5th edition of the World Health Organization classification of haematolymphoid tumours: myeloid and histiocytic/dendritic neoplasms. Leukemia. 2022;36:1703–19. doi: 10.1038/s41375-022-01613-1. - DOI - PMC - PubMed
    1. Voso MT, Falconi G, Fabiani E. What’s new in the pathogenesis and treatment of therapy-related myeloid neoplasms. Blood. 2021;138:749–57. doi: 10.1182/blood.2021010764. - DOI - PubMed
    1. Kuzmanovic T, Patel BJ, Sanikommu SR, Nagata Y, Awada H, Kerr CM, et al. Genomics of therapy-related myeloid neoplasms. Haematologica. 2020;105:e98–101. doi: 10.3324/haematol.2019.219352. - DOI - PMC - PubMed

MeSH terms

Substances