. 2024 Apr 29;7(1):512.
doi: 10.1038/s42003-024-06209-2.

Identification and affinity enhancement of T-cell receptor targeting a KRASG12V cancer neoantigen

Affiliations

Identification and affinity enhancement of T-cell receptor targeting a KRASG12V cancer neoantigen

Mengyu Zhang et al. Commun Biol. .

Abstract

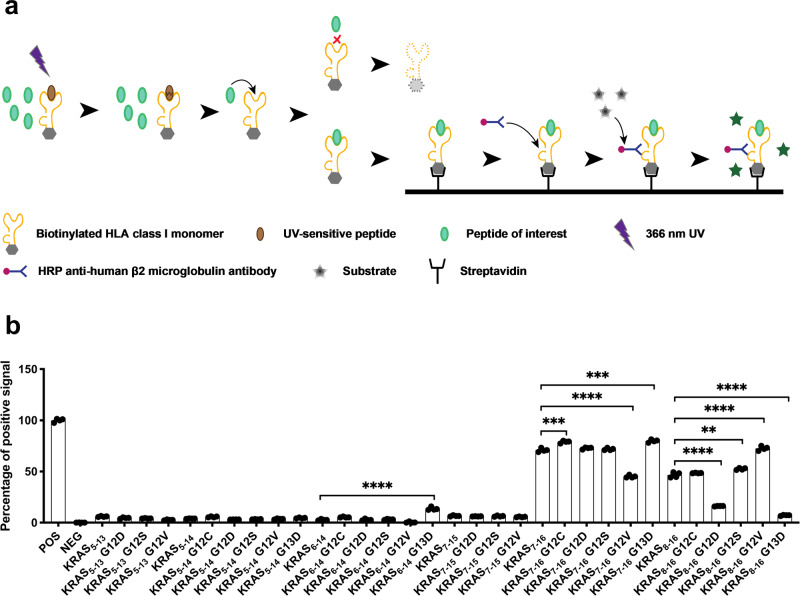
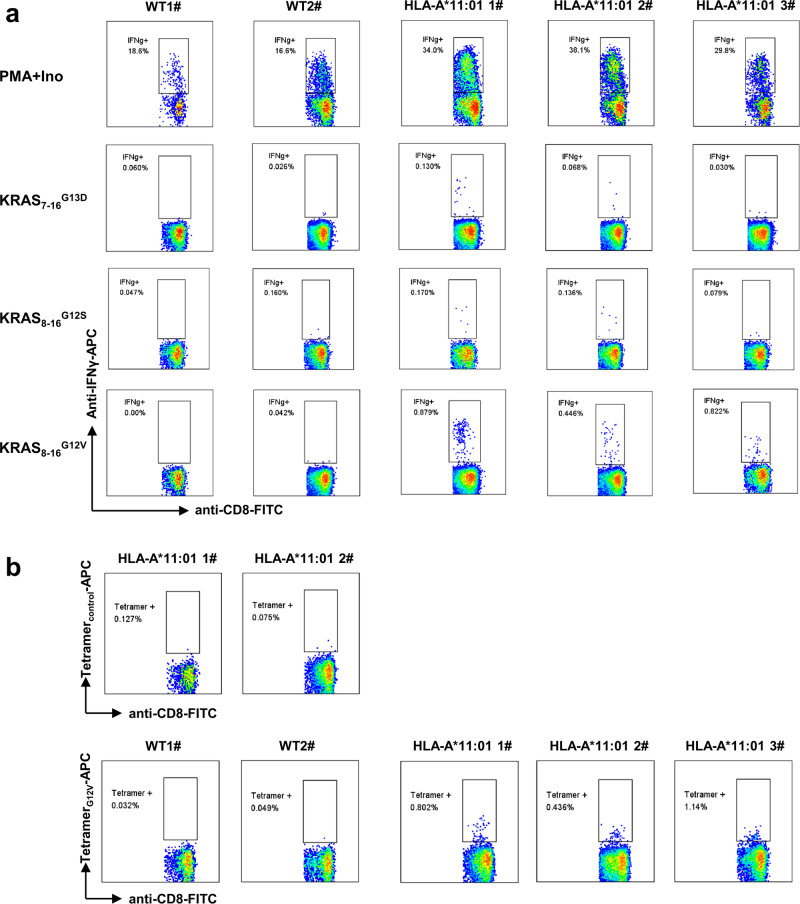
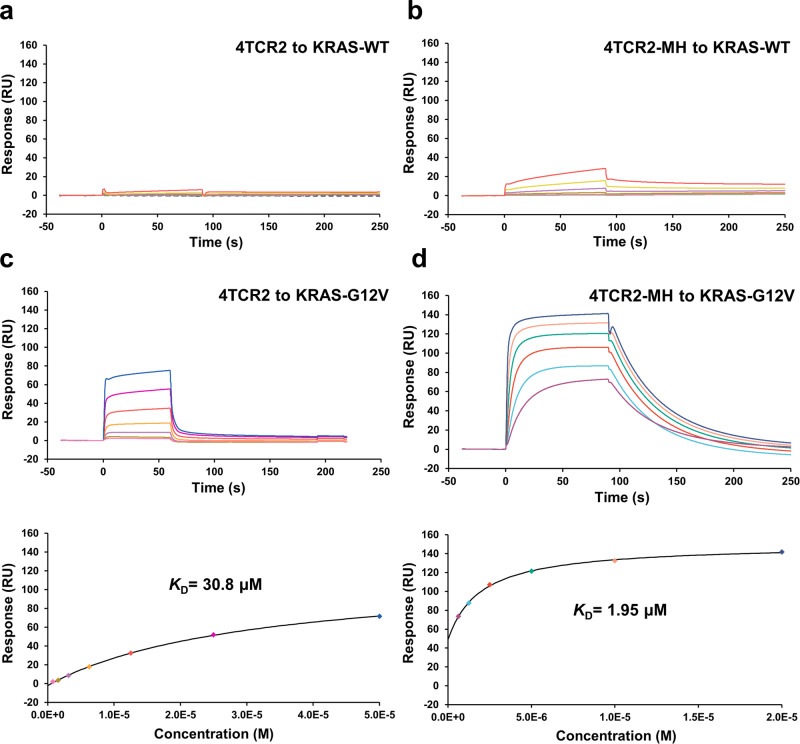
Neoantigens derived from somatic mutations in Kirsten Rat Sarcoma Viral Oncogene Homolog (KRAS), the most frequently mutated oncogene, represent promising targets for cancer immunotherapy. Recent research highlights the potential role of human leukocyte antigen (HLA) allele A*11:01 in presenting these altered KRAS variants to the immune system. In this study, we successfully generate and identify murine T-cell receptors (TCRs) that specifically recognize KRAS8-16G12V from three predicted high affinity peptides. By determining the structure of the tumor-specific 4TCR2 bound to KRASG12V-HLA-A*11:01, we conduct structure-based design to create and evaluate TCR variants with markedly enhanced affinity, up to 15.8-fold. This high-affinity TCR mutant, which involved only two amino acid substitutions, display minimal conformational alterations while maintaining a high degree of specificity for the KRASG12V peptide. Our research unveils the molecular mechanisms governing TCR recognition towards KRASG12V neoantigen and yields a range of affinity-enhanced TCR mutants with significant potential for immunotherapy strategies targeting tumors harboring the KRASG12V mutation.


Conflict of interest statement

M.Z., F.G., F.W., and S.Y. are listed as inventors for a patent granted to generate TCR variant towards KRAS8–16G12V–HLA-A*11:01. The remaining authors declare no competing interests.

Figures

Fig. 1
Fig. 1. Assessment of predicted KRAS-derived neoantigen binding affinity to HLA-A*11:01 monomers.
a UV-mediated HLA class I-peptide binding: UV-sensitive peptides, which are preloaded on biotinylated HLA class I monomers, are destroyed upon exposure to 366 nm UV light. This results in the exposure of the peptide-binding epitope on the biotinylated HLA class I monomers. Subsequently, co-incubated peptides of interest can readily bind to the exposed epitope. Biotinylated HLA class I monomers lacking bound peptide undergo degradation. The biotinylated HLA class I-peptide monomers bound to streptavidin anchors on the plate are then detected by using an HRP-conjugated anti-human β2 microglobulin antibody. The addition of a substrate leads to an enzymatic reaction with HRP, allowing for quantification of HLA class I-peptide monomers through OD measurement. b Interaction between preloaded UV-sensitive peptide-HLA-A*11:01 monomers and predicted KRAS-derived peptides: Upon exposure to UV light, the UV-sensitive peptides on HLA-A*11:01 monomers are degraded, thereby exposing the peptide-binding epitope on the HLA-A*11:01 monomers. Monomers lacking bound peptide are subsequently degraded. The evaluation of peptide-binding monomers is conducted using an Anti-human β2-microglobulin ELISA, with OD values serving as the basis for measurement. The capacity of peptide-monomer binding is expressed as the percentage of positive signal, calculated as follow: percentage of positive signal = [(OD value of monomers with the predicted peptide - OD value of monomers with the negative control peptide)/(OD value of monomers with the positive control peptide - OD value of monomers with the negative control peptide)] × 100%. Data are from one representative experiment out of three and are presented as mean ± SEM. For this experiment n = 4 biological replicates.*p < 0.05; **p < 0.005; ***p < 0.0005; ****p < 0.0001 as determined by the t test.
Fig. 2
Fig. 2. Immune response of HLA-A*11:01 transgenic mice to predicted neoantigens derived from high-affinity KRAS mutations.
HLA-A*11:01 transgenic mice were subjected to an immunization regimen involving the top three KRAS-derived peptides with high HLA-A*11:01 affinity: KRAS7–16G13D, KRAS8–16G12S, and KRAS8–16G12V. This immunization occurred on both day 0 and day 14. Subsequently, on day 21, the mice received a reimmunization using plasmids carrying these three peptides. By day 28, peripheral blood samples were collected and subjected to separate stimulation with the aforementioned peptides. a The subsequent expression of IFNγ in CD8+ T cells was analyzed. b Based on the observations from Panel a, CD8+ T cells specific to KRAS8–16G12V were identified and sorted using KRAS8–16G12V-HLA-A*11:01 tetramers. This experimentation utilized 2 wild-type and 3 HLA-A*11:01 transgenic mice, with PMA+Ino serving as the positive control.
Fig. 3
Fig. 3. 10× single-cell sequencing analysis.
a, b Dimensionality reduction and clustering analysis of scRNA-seq data (a) and cluster annotation (b). c CD8+ T cells activation and effector marker expression analysis. d Distribution of highly expanded KRAS8–16G12V-specific CD8+ T cells clonotypes. e Distribution of the top 3 TCR clonotypes in each cluster. C0: Gzma+ Effector CD8 T cells, C1: Ltbhi Exhausted CD8 T cells, C2: Dock2+ Effector CD8 T cells, C3: Ifnghi Effector CD8 T cells, C4: Ifitmhi Effector CD8 T cells, C5: Tnfrsf25hi Effector CD8 T cells, C6: Proliferated CD8 T cells, C7: Gzmb+ Effector CD8 T cells.
Fig. 4
Fig. 4. SPR analysis of TCR binding to KRASWT–HLA-A*11:01 and KRASG12V-HLA-A*11:01.
a 4TCR2 at concentrations of 0.098, 0.195, 0.39, 0.78, 1.56, 3.12, 6.25, and 12.5 μM was injected over immobilized KRASWT-HLA- A*11:01. b 4TCR2-MH at concentrations of 0.098, 0.195, 0.39, 0.78, 1.56, 3.12, 6.25, and 12.5 μM was injected over immobilized KRASWT-HLA- A*11:01. c 4TCR2 at concentrations of 0.78, 1.56, 3.12, 6.25, 12.5, 25, and 50 μM was injected over immobilized KRASG12V-HLA- A*11:01. d 4TCR2-MH at concentrations of 0.63, 1.25, 2.5, 5, 10, and 20 μM was injected over immobilized KRASG12V-HLA- A*11:01.
Fig. 5
Fig. 5. 4TCR2 binds to the HLA-A*11:01 and the KRASG12V peptide.
a Overall structure of KRASG12V/HLA-A*11:01 bound to the 4TCR2 (PDB 8WTE). HLA-A*11:01 and β2 macroglobulin (β2m) are colored in gray and orange, respectively. TCR α chain and β chain are colored in cyan and blue, respectively. The KRASG12V nonapeptide is shown in green between helices α1 and α2 of the HLA. b Top view of the 4TCR2-HLA-A*11:01-KRASG12V complex. The HLA and KRASG12V peptide are shown in surface representation, and the CDRs are shown in cartoon tube representations. The crossing angle vector is drawn connecting the disulphides between the 4TCR2 TCR α chain (cyan sphere) and TCR β chain (blue sphere) variable domains. The KRAS-G12V peptide is presented as a surface in green with the mutated P5 Val residue in yellow. c Composite omit electron density map of the KRASG12V peptide contour at 1σ. d The HLA interaction network around the peptide residue V5 in the 4TCR2-HLA-A*11:01-KRASG12V. e 4TCR2 CDR3β interactions with the KRASG12V peptide. f Comparison of the structure of KRASWT peptide (yellow) (PDB ID: 8I5E) with KRASG12V peptide (green) (PBD 8WTE) presented by HLA-A*11:01. The HLA helices are shown in cartoon.
Fig. 6
Fig. 6. Structure of the 4TCR2 MH double mutant in complex with HLA-A*11:01-KRAS8–16G12V.
a Superposition of the 4TCR2 MH/HLA-A*11:01-KRAS8–16 G12V and the 4TCR2/HLA-A*11:01-KRAS8–16 G12V complexes. 4TCR2 α chain is cyan, β chain is blue, MHC is gray, β2m is orange, and peptide is green (shown as sticks); residues that were mutated are shown as sticks. Close-ups of b wild-type K51β, c mutant M51β, d wild-type E100β, e mutant H100β are shown. be Residue of the mutation site is shown as stick.
Fig. 7
Fig. 7. Surface Electrostatics of 4TCR2 WT/MH and KRASG12V–HLA-A*11:01.
a Surface electrostatics of 4TCR2-WT with the β chain K51 residue indicated by dotted green circle. b Surface electrostatics of pMHC in the 4TCR2-WT-KRASG12V–HLA-A*11:01 complex. c Residues adjacent to TCR-β K51 on pMHC. d Residues adjacent to TCR-β E100 on pMHC. e Surface electrostatics of 4TCR2-MH with the β chain M51 residue indicated by dotted green circle. f Surface electrostatics of pMHC in the 4TCR2-MH-KRASG12V–HLA-A*11:01 complex. g Residues adjacent to TCR-β M51 on pMHC. h Residues adjacent to TCR-β H100 on pMHC. Surface electrostatics: blue–positive, red-negative.

Similar articles

Cited by

References

    1. Downward J. Targeting ras signalling pathways in cancer therapy. Nat. Rev. Cancer. 2003;3:11–22. doi: 10.1038/nrc969. - DOI - PubMed
    1. Drugan JK, Rogers-Graham K, Gilmer T, Campbell S, Clark GJ. The Ras/p120 GTPase-activating protein (GAP) interaction is regulated by the p120 GAP pleckstrin homology domain. J. Biol. Chem. 2000;275:35021–35027. doi: 10.1074/jbc.M004386200. - DOI - PubMed
    1. Bos JL, Rehmann H, Wittinghofer A. GEFs and GAPs: critical elements in the control of small G proteins. Cell. 2007;129:865–877. doi: 10.1016/j.cell.2007.05.018. - DOI - PubMed
    1. Huang, L. M., Guo, Z. X., Wang, F. & Fu, L. W. KRAS mutation: from undruggable to druggable in cancer. Sig. Transduct. Target Ther.6, 10.1038/s41392-021-00780-4 (2021). - PMC - PubMed
    1. Prior IA, Hood FE, Hartley JL. The frequency of ras mutations in cancer. Cancer Res. 2020;80:2969–2974. doi: 10.1158/0008-5472.CAN-19-3682. - DOI - PMC - PubMed

Publication types

MeSH terms

Substances