. 2024 Apr 29;7(1):510.
doi: 10.1038/s42003-024-06202-9.

Wnt/β-catenin signaling regulates amino acid metabolism through the suppression of CEBPA and FOXA1 in liver cancer cells

Affiliations

Wnt/β-catenin signaling regulates amino acid metabolism through the suppression of CEBPA and FOXA1 in liver cancer cells

Saya Nakagawa et al. Commun Biol. .

Abstract

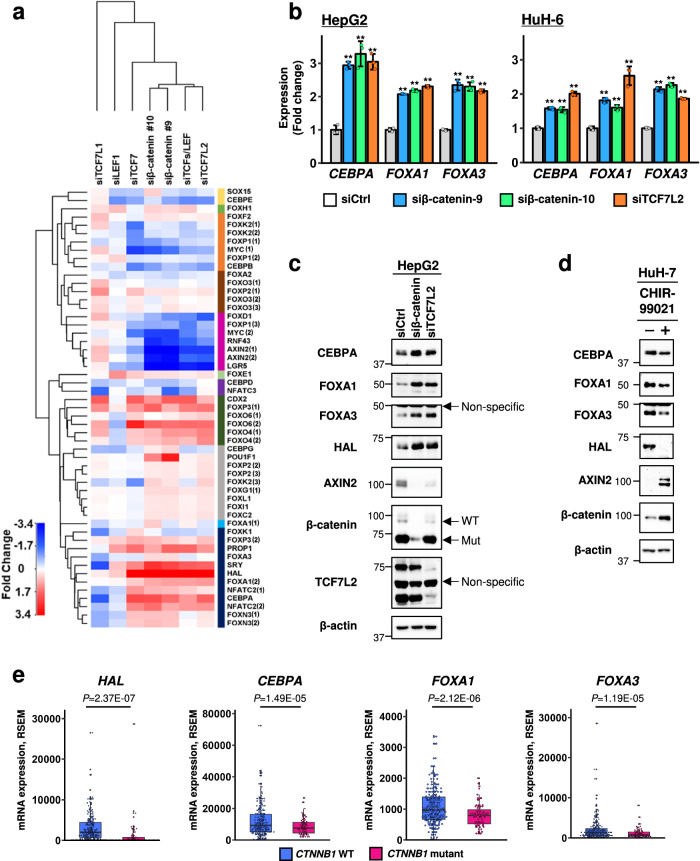
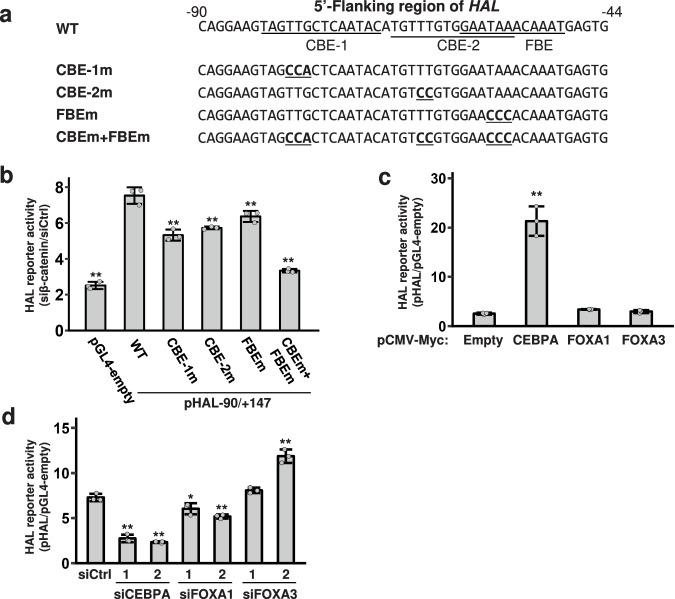
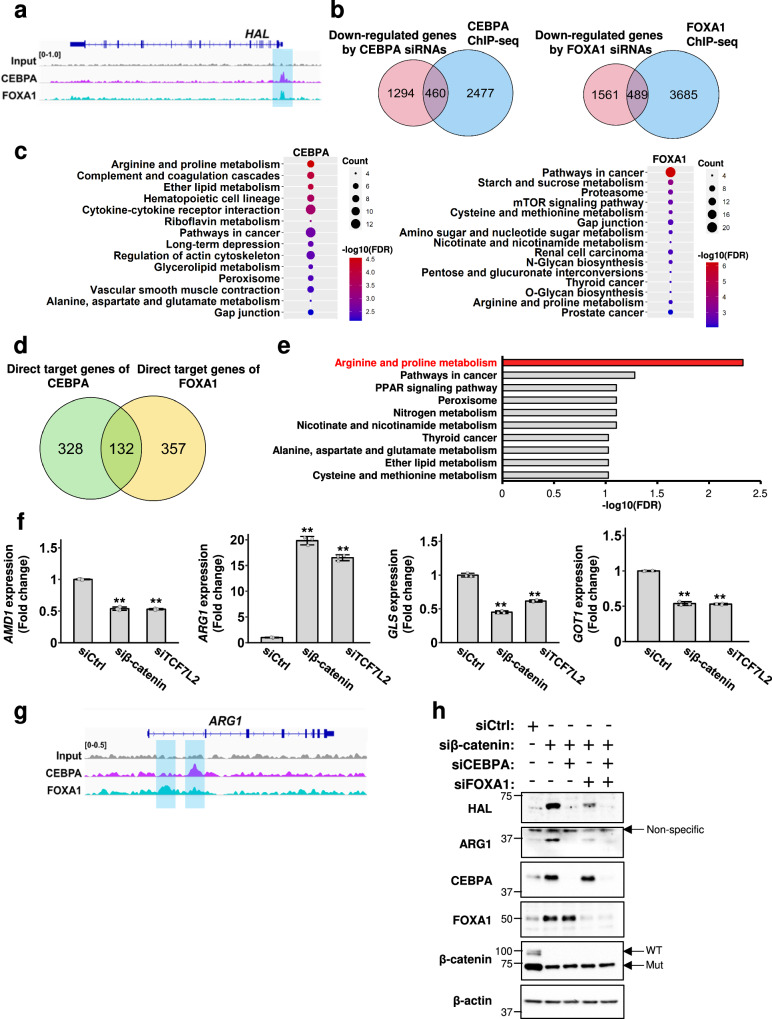
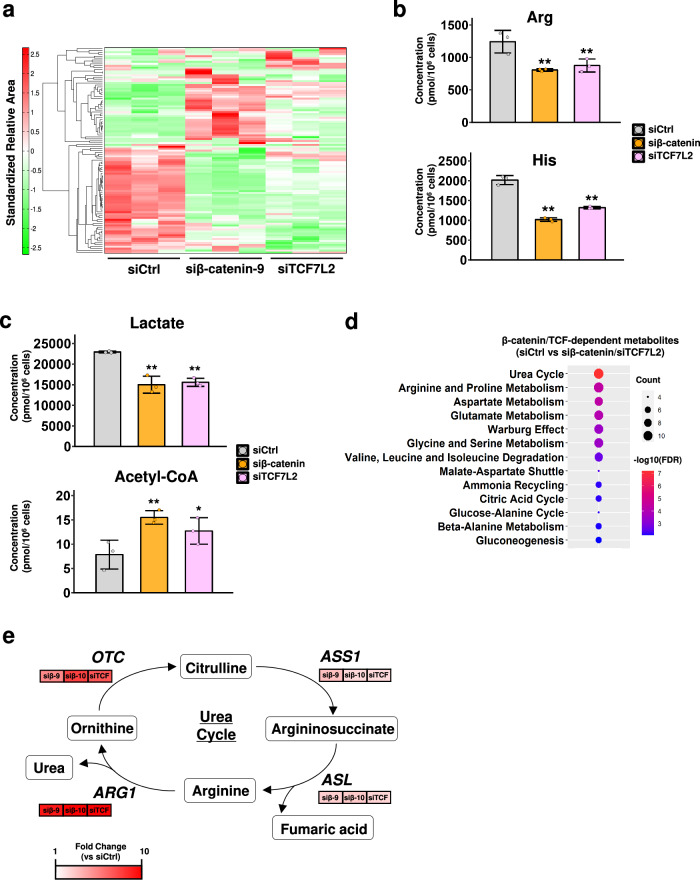
Deregulation of the Wnt/β-catenin pathway is associated with the development of human cancer including colorectal and liver cancer. Although we previously showed that histidine ammonia lyase (HAL) was transcriptionally reduced by the β-catenin/TCF complex in liver cancer cells, the mechanism(s) of its down-regulation by the complex remain to be clarified. In this study, we search for the transcription factor(s) regulating HAL, and identify CEBPA and FOXA1, two factors whose expression is suppressed by the knockdown of β-catenin or TCF7L2. In addition, RNA-seq analysis coupled with genome-wide mapping of CEBPA- and FOXA1-binding regions reveals that these two factors also increase the expression of arginase 1 (ARG1) that catalyzes the hydrolysis of arginine. Metabolome analysis discloses that activated Wnt signaling augments intracellular concentrations of histidine and arginine, and that the signal also increases the level of lactic acid suggesting the induction of the Warburg effect in liver cancer cells. Further analysis reveals that the levels of metabolites of the urea cycle and genes coding its related enzymes are also modulated by the Wnt signaling. These findings shed light on the altered cellular metabolism in the liver by the Wnt/β-catenin pathway through the suppression of liver-enriched transcription factors including CEBPA and FOXA1.


Conflict of interest statement

The authors declare no competing interests.

Figures

Fig. 1
Fig. 1. Identification of transcription factors that are negatively regulated by the β-catenin-TCF/LEF complex in liver cancer.
a Hierarchical cluster analysis of HepG2 cells treated with siRNA targeting components of β-catenin-TCF/LEF complex. Expression levels of genes encoding candidate transcription factors, Wnt target genes (AXIN2, LGR5, MYC, and RNF43), and HAL are shown in the heatmap. The numbers after the gene symbols indicate the different microarray probes. Information of probe ID is shown in Supplementary Data 1c. b Expression levels of CEBPA, FOXA1, and FOXA3 in HepG2 and HuH-6 cells treated with control, β-catenin (−9 and −10), or TCF7L2 siRNA were analyzed by RT-qPCR. The y-axis represents fold change of the expression in the cells treated with β-catenin or TCF7L2 siRNA compared to control siRNA. HPRT1 was used as an internal control for qPCR. The data represent mean ± SD from three-independent experiments. Statistical significance was determined by Dunnett’s test. **p < 0.01 vs siCtrl. c Increased expression of CEBPA, FOXA1, and FOXA3 by β-catenin or TCF7L2 siRNA in HepG2 cells. AXIN2 was used as a direct target of the β-catenin/TCF complex. Since HepG2 cells carry a heterozygous deletion encompassing exon 3 and exon 4 of CTNNB1, immunoblot analysis of the cells depicted two bands corresponding to the wild-type (96 kDa) and mutant (75 kDa) β-catenin protein. d Effect of CHIR-99021, a GSK3 inhibitor, on the expression of β-catenin, AXIN2, HAL, CEBPA, FOXA1, and FOXA3 in HuH-7 cells. e Expression of HAL, CEBPA, FOXA1, and FOXA3 in hepatocellular carcinoma tissues with or without CTNNB1 mutation. The expression values and genetic status of CTNNB1 mutation were obtained from the dataset of 361 hepatocellular carcinoma (TCGA, Pan-Cancer Atlas). Statistical significance was determined by unpaired two-tailed t-test. Center line, median; Box limits, upper and lower quartiles; Whiskers, 1.5× interquartile range.
Fig. 2
Fig. 2. Reporter assay of the HAL-promoter region containing putative CEBP- and Forkhead-binding elements.
a Sequences of the wild type and mutant HAL-promoter region used for the reporter assay. The 5’-flanking region of HAL (between −90 and −44 bp) contains two putative CEBP-binding elements (CBE-1 and CBE-2) and a putative Forkhead-binding element (FBE). Substitutions in the binding elements are underlined and shown in bold. b Reporter activity of the wild-type and mutant HAL-reporter plasmids in response to β-catenin-9 siRNA. The activity of each reporter plasmid in the cells treated with β-catenin siRNA was divided by that with control siRNA. Dual reporter assay was carried out using pRL-null plasmid for the normalization of transfection. c The effect of CEBPA, FOXA1, and FOXA3 over-expression on the reporter activity. HepG2 cells were transfected with wild type HAL-reporter plasmid and the indicated transcription factors. The y-axis represents relative reporter activity compared to the mock reporter plasmid. d The effect of siRNA for CEBPA, FOXA1, and FOXA3 on the reporter activity. Hep3B cells transfected with the wild type reporter plasmid were treated with the indicated siRNAs. The y-axis represents the relative reporter activity compared to the mock reporter plasmid. Unless specified otherwise, data are represented as the mean ± SD of three independent cultures. Statistical significance was determined by Dunnett’s test. *p < 0.05, **p < 0.01 vs Empty or siCtrl.
Fig. 3
Fig. 3. Involvement of CEBPA and FOXA1 in HAL expression.
a Expression of HAL in HuH-7 and Hep3B cells treated with the indicated siRNAs. Expression was assessed by RT-qPCR. The y-axis represents the fold change in the expression of HAL observed in the cells treated with the indicated siRNAs compared to control siRNA. b Expression of HAL, CEBPA, FOXA1, and FOXA3 in the cells treated with the indicated siRNAs was detected by immunoblotting. β-actin served as a loading control. c The effect of CEBPA, FOXA1, and FOXA3 over-expression on the expression of HAL in HepG2 and Hep3B cells. Expression was assessed by RT-qPCR. The y-axis represents fold change in HAL expression observed in the cells over-expressing the indicated transcription factors relative to EGFP (control). d Expression of HAL, CEBPA, FOXA1, and FOXA3 in the cells over-expressing the indicated plasmids was detected by immunoblotting. β-actin served as a loading control. Unless specified otherwise, data are represented as the mean ± SD of three independent experiments. Statistical significance was determined by Dunnett’s test. **p < 0.01 vs siCtrl or EGFP.
Fig. 4
Fig. 4. Gene set enrichment analysis using genes directly regulated by CEBPA and FOXA1 in liver cancer cells.
a Visualization of ChIP-seq peaks of CEBPA (magenta) and FOXA1 (blue) in the genomic region of HAL. b Venn diagrams depicting the number of genes regulated by CEBPA and genes regulated by FOXA1 in HuH-7 cells. The overlapping genes were considered as direct targets of each transcription factor. c Over-representation analysis (ORA) using KEGG pathway gene sets with the 460 and 489 genes directly regulated by CEBPA and FOXA1, respectively. Significant pathways are shown with q-value and the number of genes. d Venn diagram showing common direct targets of CEBPA and FOXA1. e ORA using the 132 common target genes (FDR q-value < 0.01). f The expression levels of AMD1, ARG1, GLS, and GOT1 in HepG2 cells treated with β-catenin or TCF7L2 siRNA analyzed by RT-qPCR. HPRT1 was used as an internal control. Data are represented as the mean ± SD of three independent experiments. Statistical significance was determined by Dunnett’s test. **p < 0.01 vs siCtrl. g Visualization of ChIP-seq peaks of CEBPA (magenta) and FOXA1 (blue) in the genomic region of ARG1. h Expression of HAL and ARG1 in HepG2 cells treated with CEBPA and/or FOXA1 siRNA in combination with β-catenin siRNA.
Fig. 5
Fig. 5. Alterations in the levels of amino acids in β-catenin- or TCF7L2-depleted cells.
a Metabolite analysis using HepG2 cells treated with control, β-catenin, or TCF7L2 siRNA. Each group was analyzed in triplicate. b, c Quantitative analysis of the indicated metabolites using mass spectrometry in the HepG2 cells treated with control, β-catenin, or TCF7L2 siRNA. The y-axis represents the concentration (pmol/106 cells) of metabolites. b Levels of arginine and histidine. c Levels of lactate and acetyl-CoA. d Metabolic pathway analysis using metabolites that were commonly altered by the knockdown of β-catenin and TCF7L2. FDR q-value < 0.01 was considered significant. e A simplified schematic representation of the urea cycle and related enzymes. ASS1, argininosuccinate synthetase1; ASL, argininosuccinate lyase; OTC, ornithine transcarbamylase. The microarray data (Fig. 1a) were used to generate altered expression values of OTC, ARG1, ASS1, and ASL (fold change) in the cells treated with β-catenin (siβ-9 and siβ-10) or TCF7L2 (siTCF) siRNA compared to control siRNA. Unless specified otherwise, data are represented as the mean ± SD of three independent cultures. Statistical significance was determined by Dunnett’s test. *p < 0.05, **p < 0.01 vs siCtrl.

References

    1. Sanchez-Vega F, et al. Oncogenic signaling pathways in the Cancer Genome Atlas. Cell. 2018;173:321–337.e10. doi: 10.1016/j.cell.2018.03.035. - DOI - PMC - PubMed
    1. Muzny DM, et al. Comprehensive molecular characterization of human colon and rectal cancer. Nature. 2012;487:330–337. doi: 10.1038/nature11252. - DOI - PMC - PubMed
    1. Totoki Y, et al. Trans-ancestry mutational landscape of hepatocellular carcinoma genomes. Nat. Genetics. 2014;46:1267–1273. doi: 10.1038/ng.3126. - DOI - PubMed
    1. Sansom OJ, et al. Myc deletion rescues Apc deficiency in the small intestine. Nature. 2007;446:676–679. doi: 10.1038/nature05674. - DOI - PubMed
    1. Tetsu O, McCormick F. Beta-catenin regulates expression of cyclin D1 in colon carcinoma cells. Nature. 1999;398:422–426. doi: 10.1038/18884. - DOI - PubMed

Publication types

MeSH terms