. 2024 Jun;6(6):1053-1075.
doi: 10.1038/s42255-024-01033-8. Epub 2024 Apr 29.

Cold-induced expression of a truncated adenylyl cyclase 3 acts as rheostat to brown fat function

Affiliations

Cold-induced expression of a truncated adenylyl cyclase 3 acts as rheostat to brown fat function

Sajjad Khani et al. Nat Metab. 2024 Jun.

Erratum in

  • Publisher Correction: Cold-induced expression of a truncated adenylyl cyclase 3 acts as rheostat to brown fat function.
    Khani S, Topel H, Kardinal R, Tavanez AR, Josephrajan A, Larsen BDM, Gaudry MJ, Leyendecker P, Egedal NM, Güller AS, Stanic N, Ruppert PMM, Gaziano I, Hansmeier NR, Schmidt E, Klemm P, Vagliano LM, Stahl R, Duthie F, Krause JH, Bici A, Engelhard CA, Gohlke S, Frommolt P, Gnad T, Rada-Iglesias A, Pradas-Juni M, Schulz TJ, Wunderlich FT, Pfeifer A, Bartelt A, Jastroch M, Wachten D, Kornfeld JW. Khani S, et al. Nat Metab. 2025 Apr;7(4):855. doi: 10.1038/s42255-025-01292-z. Nat Metab. 2025. PMID: 40186076 Free PMC article. No abstract available.

Abstract

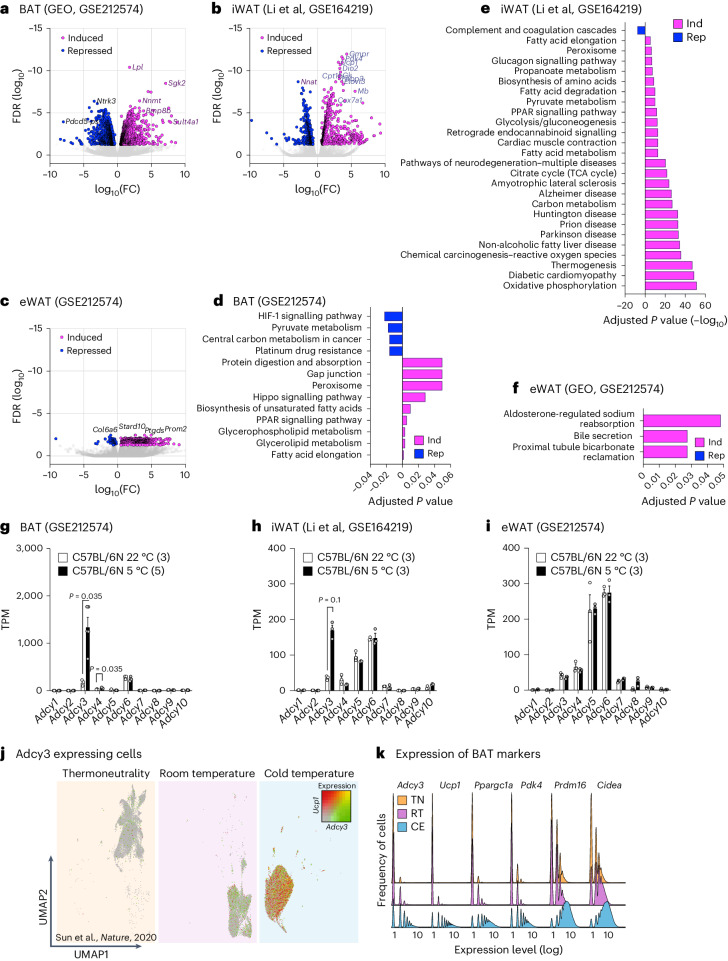
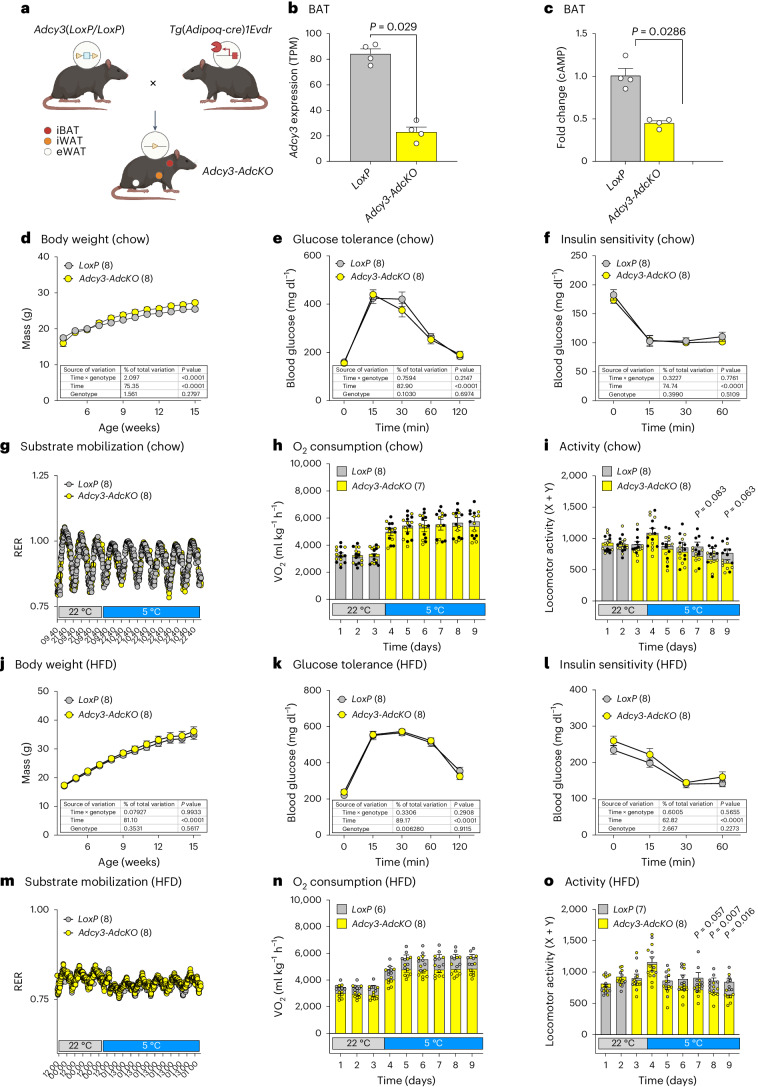
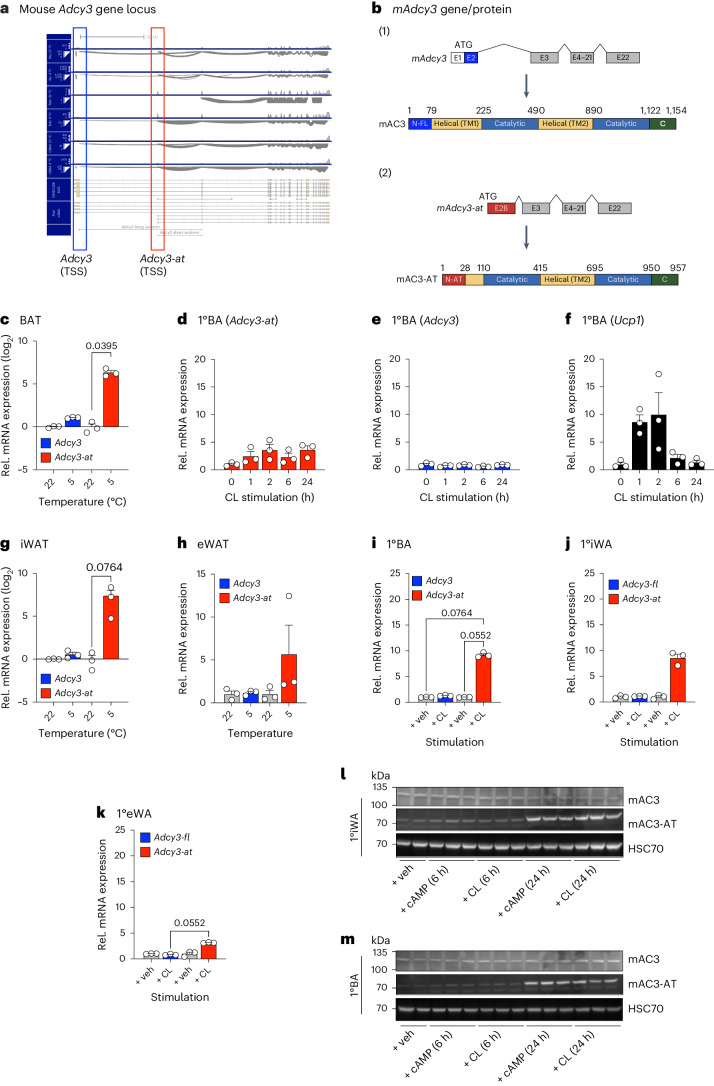
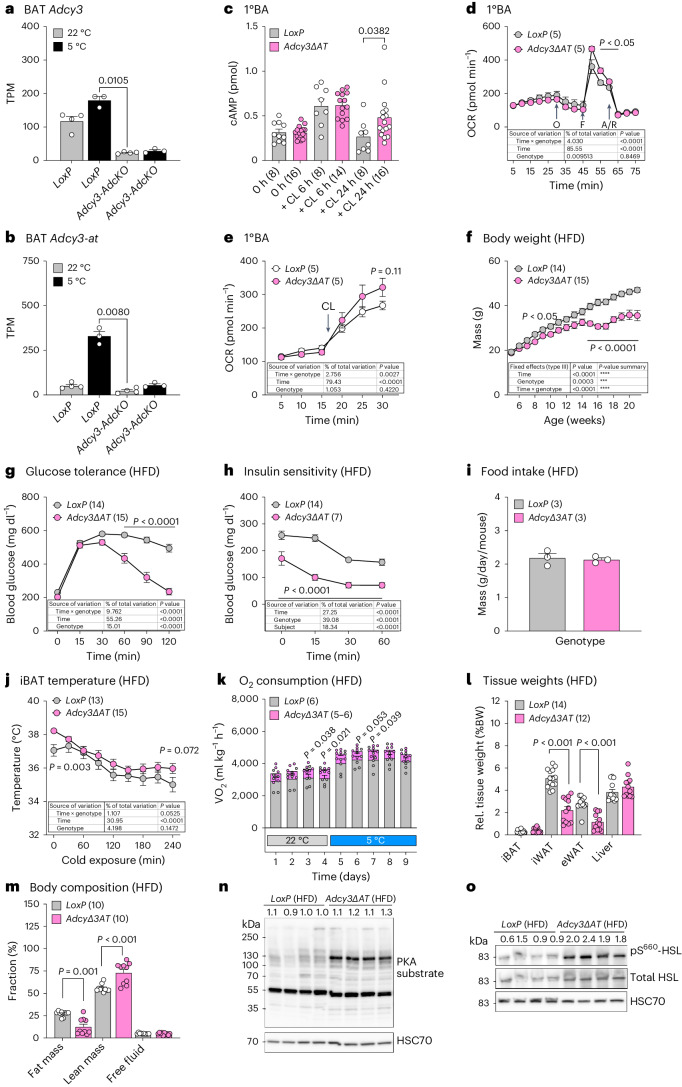
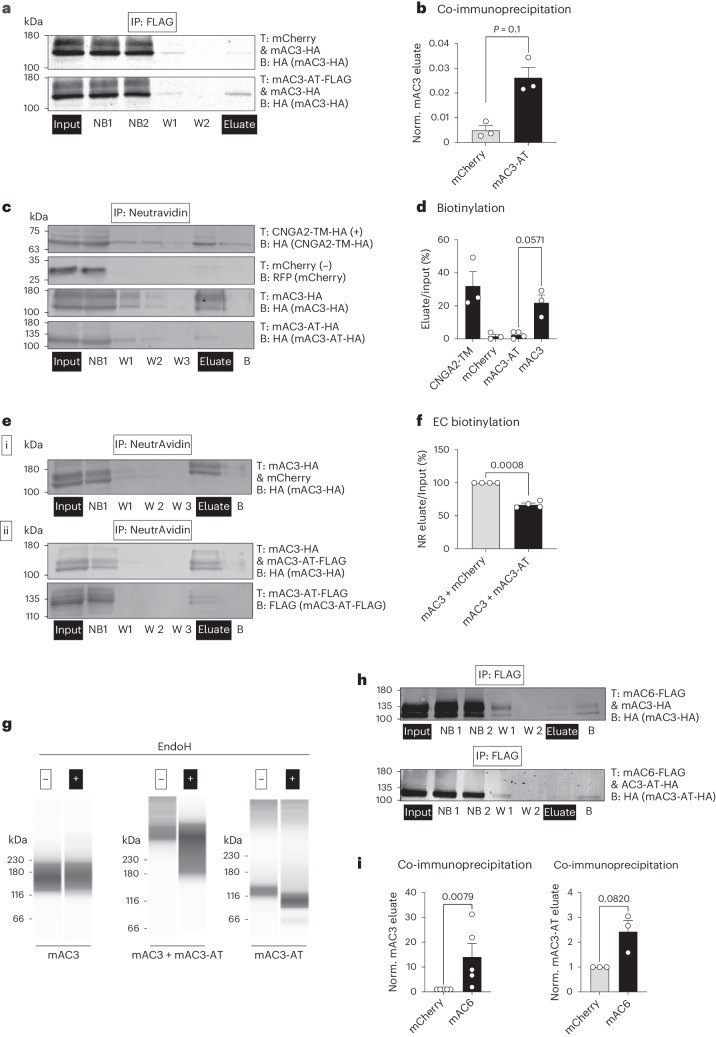
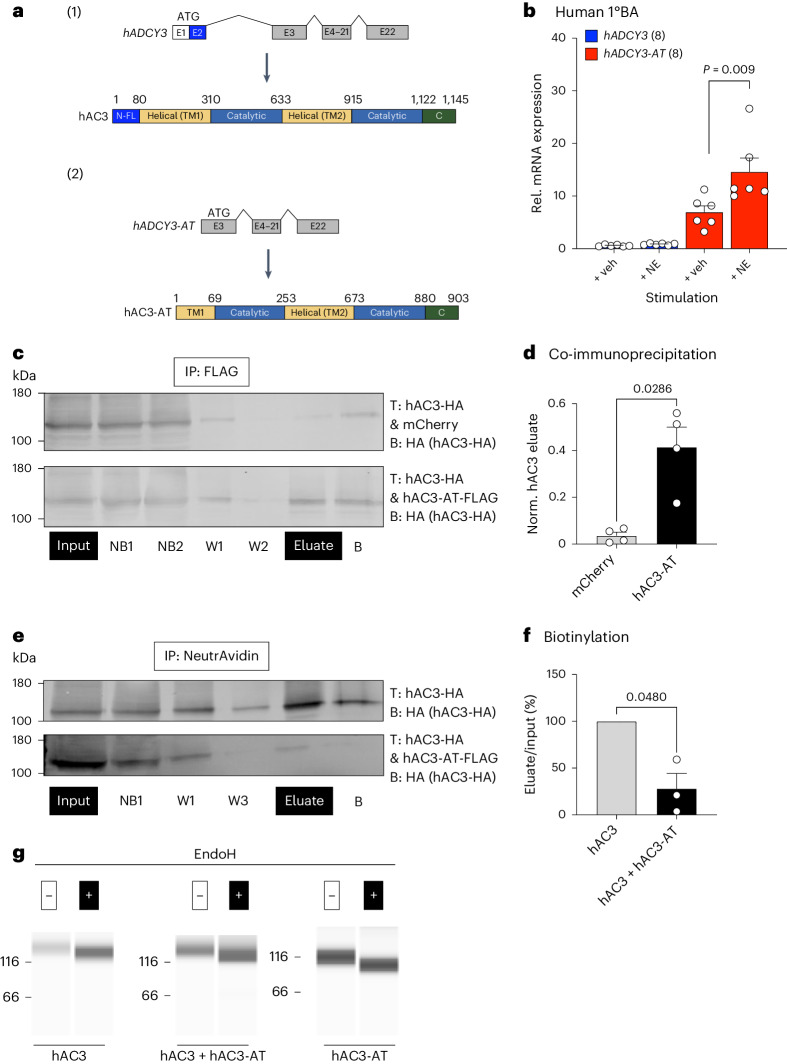
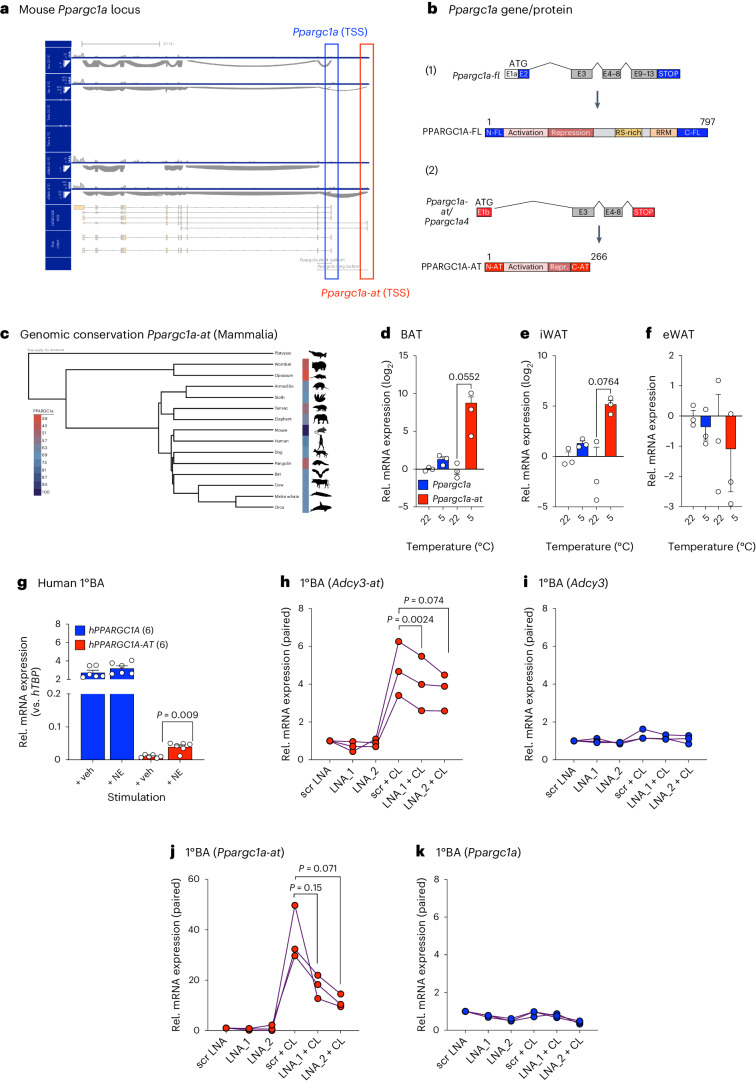
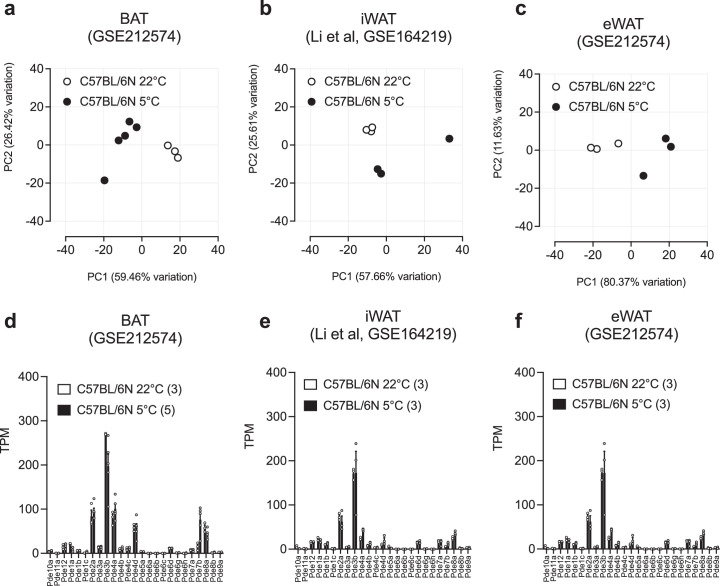
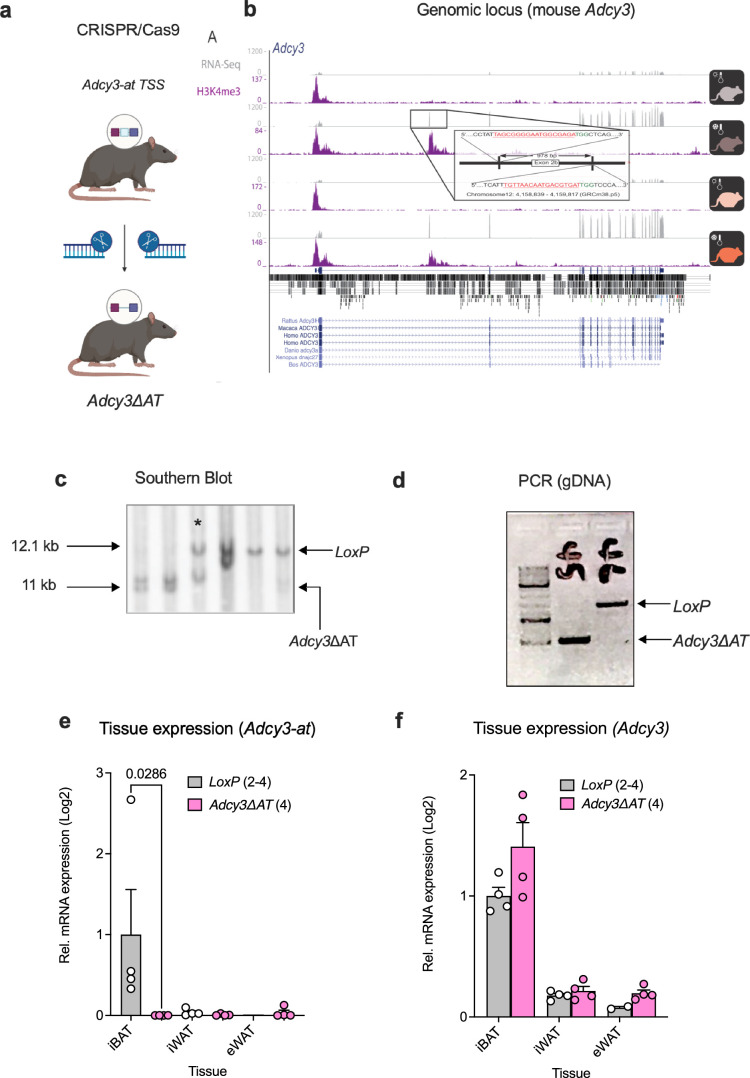
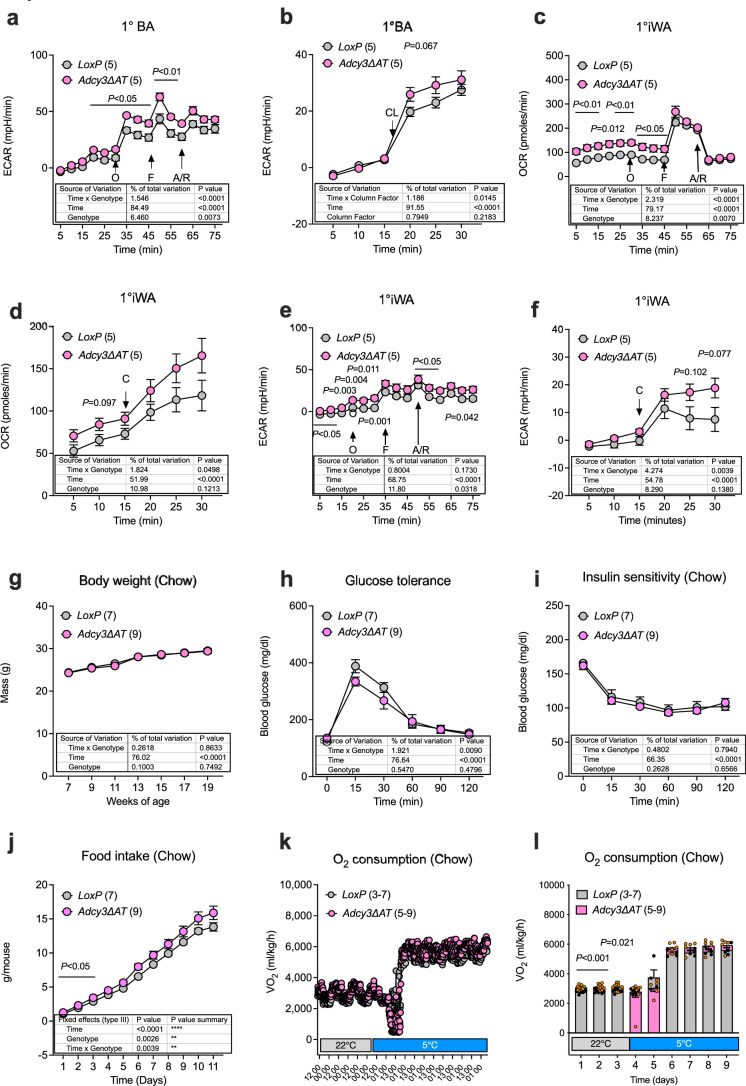
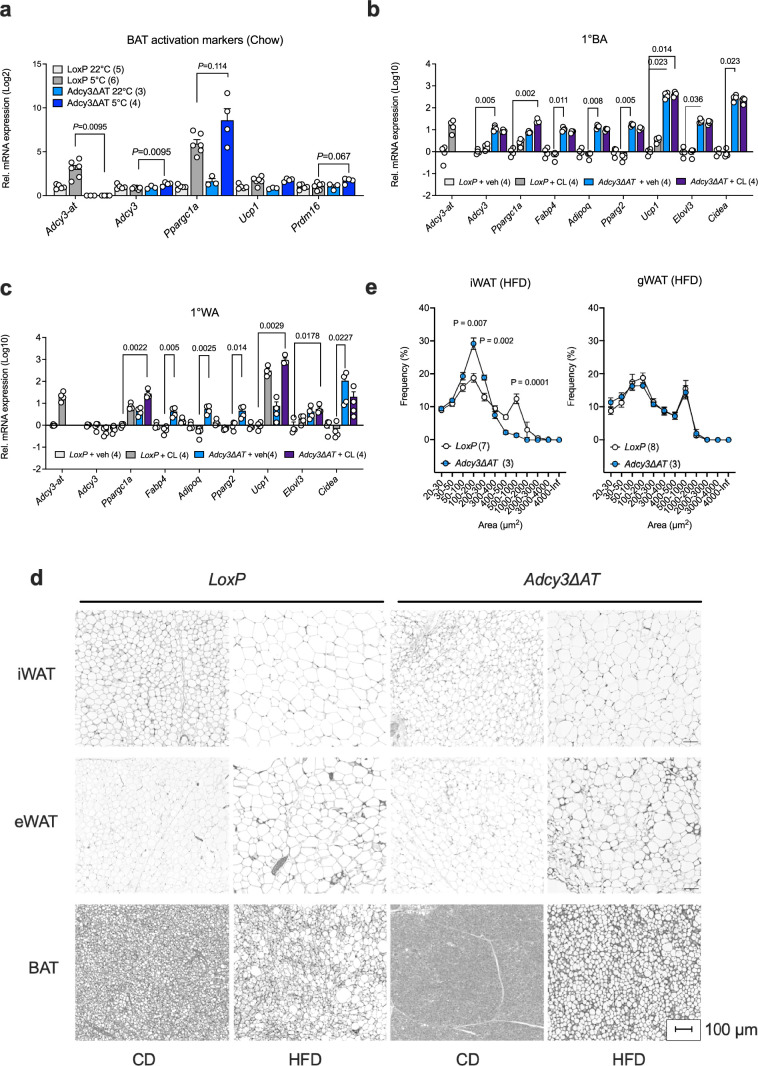
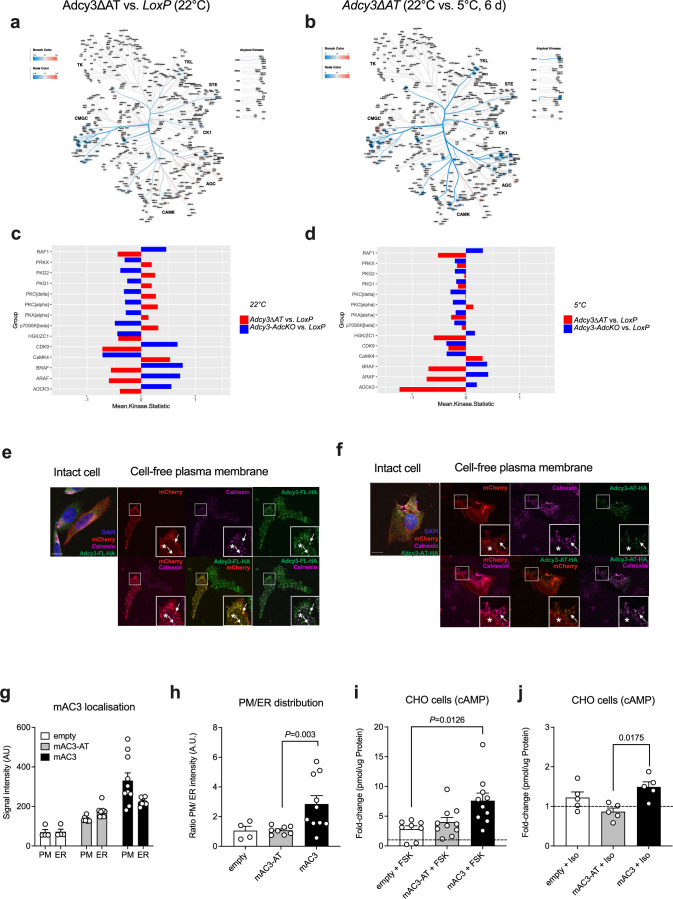
Promoting brown adipose tissue (BAT) activity innovatively targets obesity and metabolic disease. While thermogenic activation of BAT is well understood, the rheostatic regulation of BAT to avoid excessive energy dissipation remains ill-defined. Here, we demonstrate that adenylyl cyclase 3 (AC3) is key for BAT function. We identified a cold-inducible promoter that generates a 5' truncated AC3 mRNA isoform (Adcy3-at), whose expression is driven by a cold-induced, truncated isoform of PPARGC1A (PPARGC1A-AT). Male mice lacking Adcy3-at display increased energy expenditure and are resistant to obesity and ensuing metabolic imbalances. Mouse and human AC3-AT are retained in the endoplasmic reticulum, unable to translocate to the plasma membrane and lack enzymatic activity. AC3-AT interacts with AC3 and sequesters it in the endoplasmic reticulum, reducing the pool of adenylyl cyclases available for G-protein-mediated cAMP synthesis. Thus, AC3-AT acts as a cold-induced rheostat in BAT, limiting adverse consequences of cAMP activity during chronic BAT activation.


Conflict of interest statement

The authors declare no competing interests.

Figures

Fig. 1
Fig. 1. Transcriptional regulation of cAMP biosynthesis during cold adaptation of adipose tissue.
ac, Volcano plots of significantly upregulated (magenta) and downregulated (blue) genes in BAT (a; n = 2,290; 1,086/1,204 upregulated/downregulated differentially expressed genes (DEGs)), iWAT (b; n = 1,252; 804/448 upregulated/downregulated DEGs) and eWAT (c; n = 655 upregulated/downregulated DEGs) in 20-week-old C57BL/6N (a and c) or C57BL/6J (b) male mice at RT (22 °C) or after 24 h (a and c) and 72 h (b) of 5 °C CE, determined by mRNA-seq. Statistically significant DEGs were defined as false discovery rate (FDR) ≤ 0.05 and log transcripts per million (TPM) > 0. FC, fold change. N = 3–5 animals per temperature condition were analysed. df, KEGG pathway enrichments (Benjamini & Hochberg-corrected P value ≤ 0.05) for DEGs shown in ac. gi, mRNA expression of AC (Adcy) isoforms in BAT (g), iWAT (h) and eWAT (i), determined by mRNA-seq and depicted in TPM. N = 3–5 animals per temperature condition were analysed. Bar graphs represent the mean + s.e.m. with all data points plotted. Unpaired, two-tailed and non-parametric Mann–Whitney tests were performed to assess statistical significance. P values are indicated. j,k, Analysis of public snRNA-seq data (E-MTAB-8562) from Adipoq-tdTomato-positive adipocyte nuclei isolated from male mice housed at TN, RT and after CE at 8 °C for 4 days. The colours in j depict expression of Adcy3 (green), Ucp1 (red) or both (yellow). k, Ridgeline plots depicting frequency (in nuclei) of expression of BAT identity genes at indicated temperatures. Source data
Fig. 2
Fig. 2. mAC3 is required for cAMP biosynthesis in BAT and required for cold adaptation in obesity.
a, Breeding strategy to obtain pan-adipocyte-specific Adcy3 knockout mice (Adcy3-AdcKO) and LoxP controls. Created with BioRender.comb, Quantification of Adcy3 expression in BAT of chow diet-fed, male LoxP and Adcy3-AdcKO mice, determined by RNA-seq. c, Determination of cAMP levels in BAT of chow diet-fed, male LoxP and Adcy3-AdcKO mice at 22 °C, determined by ELISA and plotted as fold change. b,c, Bar graphs represent the mean + s.e.m. with all data points plotted. Unpaired, two-tailed, and non-parametric Mann–Whitney tests were performed to assess statistical significance. P values are indicated; n = 4. d, BW of chow diet-fed, male LoxP and Adcy3-AdcKO mice. e,f, Blood glucose levels during intraperitoneal glucose tolerance tests (e) and insulin tolerance tests (f) in chow diet-fed, male LoxP and Adcy3-AdcKO mice. df, Graphs represent the mean + s.e.m. Statistical significance was determined by performing two-way analysis of variance (ANOVA) with repeated measurements (mixed models). Post hoc P-value correction to account for multiple testing was performed using Bonferroni adjustment. The source of variation, percentage of the variation and exact P values are given in table insets; n = 8. Genotype P = 0.28 (d), P = 0.67 (e), P = 0.511 (f). g, Indirect calorimetry quantification of RERs in chow diet-fed, male LoxP and Adcy3-AdcKO mice (n = 8). h, Indirect calorimetry measurement of oxygen (O2) consumption in chow diet-fed, male LoxP (n = 8) and Adcy3-AdcKO (n = 7) mice. i, Quantification of mean daily locomotor activity in chow diet-fed, male LoxP (n = 8) and Adcy3-AdcKO (n = 8) mice. Bar graphs represent the mean + s.e.m. with all data points plotted. Parametric, unpaired, two-tailed Student’s t-tests were performed to assess statistical significance. P values are indicated. j, BW trajectories in HFD-fed, male LoxP and Adcy3-AdcKO mice. k,l, Blood glucose levels during intraperitoneal glucose tolerance tests (k) and insulin tolerance tests (l) in HFD-fed, male LoxP and Adcy3-AdcKO mice. jl, Graphs represent the mean + s.e.m. Statistical significance was determined by performing two-way ANOVA with repeated measurements for x values (mixed models). Post hoc P-value correction to account for multiple testing was performed using Bonferroni adjustment. The source of variation, percentage of the variation and exact P values are given in table insets; n = 8. Genotype P = 0.562 (j), P = 0.912 (k) and P = 0.223 (l). m, Indirect calorimetry quantification of RERs in HFD-fed, male LoxP and Adcy3-AdcKO mice; n = 8. n, Indirect calorimetry measurement of oxygen consumption in HFD-fed, male LoxP and Adcy3-AdcKO mice; n = 8. o, Indirect calorimetry determination of mean daily locomotor activity in HFD-fed, male LoxP (n = 7) and Adcy3-AdcKO (n = 8) mice. Bar graphs represent the mean + s.e.m. with all data points plotted. Parametric, unpaired, two-tailed Student’s t-tests were performed to assess statistical significance. P values are indicated. Source data
Fig. 3
Fig. 3. Activated thermogenic adipocytes express a truncated Adcy3 (Adcy-AT) transcript and protein isoform.
a, Sashimi plots visualizing splicing junctions from aligned RNA-seq data in BAT in Adcy3 from 20-week-old male C57BL/6N mice at 22 °C or after 24 h of 5 °C CE; n = 3–5. Illu, Illumina short-read RNA-seq; Telo, TeloPrime full-length cDNA-seq; cDNA, direct cDNA-seq. Reads were aligned against GENCODE M29 annotation and transcript reassembly using Illumina short-read and full-length RNA-seq using FLAIR75. b, Schematic of (1) canonical mouse Adcy3 mRNA and mAC3 protein structure and (2) Adcy3-at transcript and mAC3-AT protein structure. Created with BioRender.com. c, Relative expression of Adcy3 and Adcy3-at determined by qPCR analysis of BAT of male C57BL/6N mice housed at 22 °C or exposed to 5 °C for 24 h; n = 3. df, Relative expression of Adcy3-at (d), Adcy3 (e) and Ucp1 (f), determined by qPCR analysis, of 1°BAs stimulated for 1–24 h with 10 µM CL316,243 (CL, n = 3). g,h, Relative expression of Adcy3 and Adcy3-at determined by qPCR analysis of iWAT (g) and eWAT (h) of male C57BL/6N mice housed at 22 °C or exposed to 5 °C for 24 h; n = 3. ik, Relative expression of Adcy3 and Adcy3-at, determined by qPCR analysis, in differentiated primary adipocytes derived from SVF cells isolated from BAT (1°BAs) (i), iWAT (1°iWAs) (j) and eWAT (1°eWAs) (k), and stimulated for 6 h with 10 µM CL. Replicates represent primary adipocytes isolated from individual mice (n = 3 mice). ck, Bar graphs represent the mean + s.e.m. with all data points plotted. c,gk, To test for statistical significance, non-parametric, ranked Kruskal–Wallis one-way ANOVA tests with Dunn’s correction for multiple testing were performed. P values are indicated. l,m, Western blot analysis of 1°BAs and 1°iWAs stimulated for 6 h and 24 h with 1 mM dibutyryl cAMP or 10 µM CL and analysed using a pan-AC3 antibody. Bands corresponding to mAC3 and mAC3-AT are from the same membrane but represent different exposure times. Heat shock protein 70 (HSC70) antibody was used as the loading control. The blots shown are representative of two independent experiments. Source data
Fig. 4
Fig. 4. mAC3-AT inhibits oxidative metabolism in vitro and in vivo.
a,b, Expression of Adcy3 (a) and Adcy3-at (b) in BAT of chow diet-fed male mice housed at 22 °C (n = 4) and for 24 h at 5 °C (n = 3) as determined by RNA-seq. c, Quantification of intracellular cAMP levels in 1°BAs. 1°BAs, differentiated from the SVF of LoxP (n = 5) and Adcy3-atΔKO (n = 5) female and male mice, were stimulated with 10 μM CL for 6 or 24 h. Bar graphs represent the mean + s.e.m. with all data points plotted (n numbers indicated in parentheses). Statistical significance was determined using an unpaired, non-parametric and two-tailed Mann–Whitney test; P value is indicated. d,e, Oxygen consumption rate (OCR) in 1°BAs derived from the SVF of LoxP or Adcy3∆AT mice and stimulated with oligomycin (O), FCCP (F) and antimycin A plus rotenone (A/R) (d) or 1°BAs stimulated with 10 µM CL at the indicated time point (e); n = 5. Unpaired, two-tailed Student’s t-tests were performed to assess statistical significance. P values are indicated. f, BWs in HFD-fed, male LoxP (n = 14) and Adcy3∆AT (n = 15) mice. g, Blood glucose levels during intraperitoneal glucose tolerance tests in HFD-fed, male LoxP (n = 14) and Adcy3∆AT (n = 16) mice. h, Blood glucose levels during intraperitoneal insulin tolerance tests in HFD-fed, male LoxP (n = 14) and Adcy3∆AT (n = 7) mice. fh, Graphs represent the mean + s.e.m. Statistical significance was determined by performing two-way ANOVA with repeated measurements for x values (mixed models). Post hoc P-value correction to account for multiple testing was performed using Bonferroni adjustment. The source of variation, percentage of the variation and exact P values are given in the table insets. Genotype P = 0.85 (d), P = 0.422 (e), P = 0.0003 (f), P = 0.0001 (g) and P = 0.0001 (h). i, Daily mean food intake in HFD-fed, male LoxP (n = 3) and Adcy3∆AT (n = 3) mice as determined using custom-made food hoppers averaged over 4 days. Unpaired, two-tailed and non-parametric Mann–Whitney tests were performed to assess statistical significance. j, iBAT proximal temperature measurements in HFD-fed, male LoxP (n = 13) and Adcy3∆AT (n = 15) mice exposed to 5 °C. Temperatures were recorded using implanted subdermal probes and telemetry devices. Genotype P = 0.147. k, Indirect calorimetry measurement of oxygen consumption in HFD-fed, male LoxP (n = 6) and Adcy3∆AT (n = 6) mice. l, Relative (BW adjusted) tissue weights from indicated adipose tissue depots and liver of LoxP (n = 14) and Adcy3∆AT (n = 12) mice fed a HFD and housed at 22 °C. m, Fractional body composition of HFD-fed LoxP (n = 10) and Adcy3∆AT (n = 10) mice, determined by NMR. l,m, Bar graphs represent the mean + s.e.m. with all data points plotted. Unpaired, two-tailed, and non-parametric Mann–Whitney tests were performed to assess statistical significance between genotypes within each tissue. n,o, Western blot analyses of BAT from HFD-fed male LoxP and Adcy3 mice (n = 4) after 5 °C for 6 days. Anti-phospho-PKA substrate antibodies were used for detection of PKA phosphorylation substrates and anti-phospho-HS levels were normalized to total HSL protein. anti-HSC70 served as the loading control. Densitometric quantification was performed, and relative values are indicated above the blots. Source data
Fig. 5
Fig. 5. mAC3-AT alters mAC3 subcellular localization and, thereby, limits cAMP biosynthesis.
a, Co-immunoprecipitation of mAC3/mAC3-AT in CHO cells. CHO cells stably expressing AC3-HA were transiently transfected (T) with mCherry (upper row) or AC3-AT-FLAG (bottom row). Total protein lysates were incubated with anti-FLAG magnetic beads, purified, and the different fractions were analysed by western blot using an HA antibody (B) (input; NB, non-bound; W, wash; eluate). b, Quantification of immunoblots. The ratio of mAC3 protein density in the eluate compared to the total protein input for each condition (mCherry and mAC3-AT-FLAG, n = 3 per condition) was determined from a. Bar graphs represent the mean + s.e.m. with all data points plotted. An unpaired, two-tailed and non-parametric Mann–Whitney test was performed to assess statistical significance. The P value is indicated. c, Western blot analysis of biotinylation assay. Total protein lysates isolated from CHO cells transfected with CNGA2-TM, mCherry, mAC3-HA and mAC3-AT-HA. Cells were treated with the biotinylation reagent sulfo-NHS-SS-biotin, lysed (input) and purified using a NeutrAvidin-agarose-resin (NB; W; eluate; B, beads). Immunoblots were incubated with a CNGA2, HA or RFP (mCherry) antibody (B). d, Quantification biotinylation assay for single transfections shown in c using densitometric analysis of immunoblots. Values were normalized to the respective input sample. The ratio of eluate to input as a percentage is shown as the mean + s.e.m. with all data points plotted. An unpaired, two-tailed and non-parametric Mann–Whitney test was performed to assess statistical significance. The P value is indicated; n = 3. e, Western blot analysis of biotinylation assay for mAC3/mAC3-AT. Total protein lysates isolated from CHO cells transfected (T) with AC3-HA alone (i) or together with AC3-AT-FLAG (ii). Cells were treated with the biotinylation reagent Sulfo-NHS-SS-Biotin, lysed (input) and purified using a NeutrAvidin-agarose-resin (NB, W, eluate, B). Immunoblots were incubated with an HA or FLAG antibody (B). f, Quantification of biotinylation assay AC3-HA/AC3-AT using densitometric analysis of immunoblots shown in e. Values were normalized to the respective input sample and to the mAC3/mCherry control. Data are shown as a percentage as the mean + s.e.m. with all data points plotted. A paired, two-tailed Student’s t-test was performed. The P value is indicated; n = 4. g, EndoH digestion assay. CHO cells expressing mAC3 (HA), mAC3-AT (HA) or both (mAC3-HA/mAC3-AT-FLAG) were subjected to EndoH treatment and analysed by a capillary immunoassay system using an HA antibody, thereby detecting the individual proteins in the single transfections and mAC3-HA in the double transfection. h, Co-immunoprecipitation of mAC3 or mAC3-AT with mAC6 in CHO cells. CHO cells stably expressing mAC3-HA or mAC3-AT were transiently transfected (T) with mAC6. Total protein lysates were incubated with anti-FLAG magnetic beads, purified, and the different fractions were analysed by western blot using an HA antibody (B) (input, NB, W, eluate, B). i, Quantification of western blot analyses. The ratio of mAC3 or mAC3-AT protein density in the eluate compared to the total protein input for both conditions (mCherry and mAC6) was determined from h. Bar graphs represent the mean + s.e.m. with all data points plotted. A paired, two-tailed and non-parametric Mann–Whitney test was performed to assess statistical significance. The P values are indicated; n = 3–5. IP, immunoprecipitation. Source data
Fig. 6
Fig. 6. hAC3-AT expression, interaction with AC3 and sequestration in the ER are conserved in humans.
a, Schematic of full-length hADCY3 transcript and hAC3 protein structure (1) and hADCY3-AT transcript and hAC3-AT protein structure (2). Created with BioRender.com. b, Expression of hADCY3-AT in human 1°BAs derived from SVF precursors and stimulated with 1 μM NE for 16 h (n = 8 per condition). An unpaired, two-tailed and non-parametric Mann–Whitney test was performed to assess statistical significance. Data are shown as a percentage as the mean + s.e.m. with all data points plotted. The P value is indicated. c, Co-immunoprecipitation of hAC3/hAC3-AT in HEK293T cells: HEK293T cells were transiently transfected (T) with hAC3-HA and mCherry or hAC3-FLAG. Total protein lysates were incubated with anti-FLAG magnetic beads, purified, and the different fractions were analysed by western blot using an HA antibody (B) (input, NB, W, eluate, B). d, Quantification of immunoblot analyses. The ratio of hAC3 protein density in the eluate compared to total protein input for both conditions (mCherry and hAC3-AT-FLAG) was determined from c. Bar graphs represent the mean + s.e.m. with all data points plotted. An unpaired, two-tailed and non-parametric Mann–Whitney tests were performed to assess statistical significance; P value is indicated; n = 4. e, Western blot analysis of biotinylation assay for hAC3/hAC3-AT. Total protein lysates isolated from CHO cells transfected (T) with AC3-HA alone or together with AC3-AT-FLAG. Cells were treated with the biotinylation reagent Sulfo-NHS-SS-Biotin, lysed (input), and purified using a NeutrAvidin-agarose-resin (NB, W, eluate, B). Immunoblots were incubated with an HA or FLAG antibody (B). f, Quantification biotinylation assay hAC3-HA/hAC3-AT using densitometric analysis of immunoblots shown in e. Values were normalized to the respective input sample and to hAC3 only. Bar graphs represent the mean + s.e.m. with all data points plotted. A paired, two-tailed and parametric Student’s t-test was performed to assess statistical significance. The P value is indicated; n = 3. g, EndoH digestion assay. HEK293T cells expressing hAC3 (HA), hAC3-AT (FLAG) or both (hAC3-HA/hAC3-AT-FLAG) were subjected to EndoH treatment and analysed by a capillary immunoassay system using an HA antibody (double transfection) or the AC3 antibody (single transfections), detecting the individual proteins in the single transfections and hAC3-HA in the double transfection. Source data
Fig. 7
Fig. 7. Conserved and cold-inducible PPARGC1A-AT drives Adcy3-at expression in BAs.
a, Sashimi plots visualizing splicing junctions from aligned RNA-seq data in BAT in Ppargc1 from 20-week-old male C57BL/6N mice at 22 °C or after 24 h of 5 °C CE; n = 3–5. Illu, Illumina short-read RNA-seq; Telo, TeloPrime full-length cDNA-seq; cDNA, direct cDNA-seq. Reads were aligned against GENCODE M29 annotation and transcript reassembly using Illumina short-read and full-length RNA-seq using FLAIR. b, Schematic of the canonical Ppargc1a transcript and PPARGC1A protein structure (1) and Ppargc1a-at mRNA and PPARGC1A-AT protein structure (2). Created with BioRender.com. c, Genomic conservation of Ppargc1a-at among representative mammals. Colour gradient indicates the percentage of nucleotide identity of exon 1b relative to mouse. Phylogeny based on ref. . df, Relative expression of Ppargc1a (blue) and Ppargc1a-at (red) as determined by qPCR analysis of primary adipocytes derived from SVF cells from BAT (d), iWAT (e) and eWAT (f) depots. Replicates represent primary adipocytes isolated from individual mice (n = 3). Bar graphs represent the mean + s.e.m. with all data points plotted. To test for statistical significance, non-parametric (ranked) Kruskal–Wallis one-way ANOVA tests with Dunn’s correction for multiple testing were performed. P values are indicated. g, Expression of human PPARGC1A-AT in human 1°BAs derived from SVF precursors and stimulated with 1 µM NE for 16 h (n = 6 per condition), as described previously. An unpaired, two-tailed and non-parametric Mann–Whitney test was performed to assess statistical significance. Data are shown as a percentage as the mean + s.e.m. with all data points plotted. The P value is indicated. hk, Expression of Adcy3-at (h), Adcy3 (i), Ppargc1a-at (j) and Pparg1a (k) in mouse 1°BAs after transfection with 25 nM scrambled (scr) LNA inhibitors targeting both Ppargc1a (LNA_2) isoforms or exclusively Ppargc1a-at (LNA_1) and stimulated with 10 µM CL316,243 for 6 h. Data represent three to four independent experiments, each performed in three technical replicates. Paired samples are represented by individual lines and scr LNA set to unity. Line graphs represent the mean + s.e.m. with all data points plotted. Paired, two-tailed Student’s t-tests were performed to assess statistical significance. P values are indicated. Source data
Extended Data Fig. 1
Extended Data Fig. 1. cAMP biosynthesis in adipose tissue after cold.
Transcriptional regulation of cAMP biosynthesis in adipose tissue after cold exposure. ac, Principal component analysis (PCA) of transcriptomic changes in BAT (a), iWAT (b), and eWAT (c) after 24 h (a,c) or 72 h (b) of 5 °C cold exposure (n = 3–5 per condition). Dots represent individual, chow diet fed, male C57BL/6N animals with n = 3–5 animals per condition. df, mRNA expression of phosphodiesterases (Pde) in BAT (d), iWAT (e) and eWAT (f) as determined by mRNA-seq and depicted in transcripts per million (TPM). Bar graphs represent mean + SEM with all data points plotted. Unpaired, two-tailed, and non-parametric Mann-Whitney tests were performed to assess statistical significance. Source data
Extended Data Fig. 2
Extended Data Fig. 2. mAC3 is required for cAMP biosynthesis in BAT.
mAC3 is required for cAMP biosynthesis in BAT and required for cold adaptation in cold. a,b, mRNA expression of transcriptional BAT regulators (a) and BAT-specific genes (b) in BAT from LoxP and Adcy3-AdcKO mice (at 22 °C or after 24 h of 5 °C cold exposure). Expression has been determined by mRNA-seq and depicted in transcripts per million (TPM); n = 4. The upper/lower whiskers represent largest/smallest observation less/greater than upper/lower hinge+1.5 × interquartile range (IQR). Central median represents 50% quantile. c,d, qPCR analysis of indicated BAT mRNA markers measured in 1°BA derived from SVF of LoxP or Adcy3-AdcKO mice, injected with 100,00 multiplicity of infection (MOI) of AAV8-CMV-Cre (AAV8-Cre) or AAV8-CMV-GFP (AAV-GFP), and stimulated for 6 h with 10 µM CL316,243 (CL), n = 4. Bar graphs represent mean + SEM with all data points plotted. To test for statistical significance, non-parametric (ranked) Kruskal–Wallis one-way analysis of variance (ANOVA) tests with Dunn’s correction for multiple testing was performed. Source data
Extended Data Fig. 3
Extended Data Fig. 3. mAC3 is required for cAMP biosynthesis in BAT.
mAC3 is required for cAMP biosynthesis in BAT and required for cold adaptation in cold. ad, Relative (body-weight corrected) tissue weights from indicated adipose tissue depots and liver of LoxP (n = 4 for 22 °C, n = 8 for 5 °C) and Adcy3-AdcKO (n = 4 for 22 °C, n = 8 for 5 °C) mice either fed chow diet (a,b) or HFD (c,d) at 22 °C (a,c) or exposed for 24 h to 5 °C (b,d). Bar graphs represent mean + SEM with all data points plotted. Unpaired, two-tailed, and non-parametric Mann-Whitney tests were performed to assess statistical significance between both genotypes within each tissue. e, Western blot analysis of BAT from chow-diet fed, male LoxP (n = 3 for 22 °C, n = 4 for 5 °C) and Adcy3-AdcKO mice (n = 4 for 22 °C, n = 5 for 5 °C) at 22 °C or exposed to 5 °C for 6 days. Anti-phospho-PKA substrate antibodies were used for detection of PKA phosphorylation substrates. Anti-UCP1 antibodies probed for UCP1 protein levels. anti-HSC70 antibody served as loading control. fh, Analysis of STK signaling activity in mouse BAT. Kinome trees depict the mean kinase statistic of differentially activated STKs measured by Pam Gene Array technology in LoxP at 22 °C compared to 5 °C for 24 h (f), LoxP at 22 °C compared to 5 °C for 6 days (g) and Adcy3-AdcKO compared to LoxP at 22 °C (h). i, Inserts show zoom-ins of relevant areas of the kinome tree (blue box: down-regulated kinases; red box: up-regulated kinases). ii, Mean kinase statistic of 15 most significantly differentially activated kinases is represented in bar graphs. iii, Venn diagram depicting differences in differentially activated kinases of the respective comparison. Data represents the mean of n = 4 biological replicates for all conditions. Source data
Extended Data Fig. 4
Extended Data Fig. 4. Activated adipocytes express truncated Adcy3.
Activated thermogenic adipocytes express a truncated Adcy3 (Adcy-AT) transcript and protein isoform. a, UCSC genome browser tracks depicting changes in mRNA expression (grey) and H3K4me3 (magenta) in BAT from chow diet-fed, male C57BL/6N mice housed either at 22 °C or after 24 h of 5 °C cold exposure as determined by RNA-Seq (grey) and H3K4me3 ChiP-Seq (magenta). Red and blue transcripts depict contiguous Adcy3 and Adcy3-at transcripts, respectively, and Adcy3 isoform specific transcriptional start sites (TSS). b, ChIP-qPCR of H3K4me3 at the TSS of Adcy3 (blue), Adcy3-at (red) and exon 3, which is shared by Adcy3 and Adcy3-at (grey). Replicates represent H3K4me3 immunoprecipitations perform in individual animals (n = 3). Bar graphs represent mean + SEM with all data points plotted and unpaired, two-tailed, and non-parametric Mann-Whitney tests were performed to assess statistical significance. P values are indicated within the panel. c,d, Expression of Adcy3 (c) and Adcy3-at (d) in indicated tissues of chow diet fed, male C57BL/6N mice. Data points represent individual mice (n = 4 BAT, n = 2 iWAT, n = 3 eWAT, n = 3 pancreas, n = 3 kidneys, n = 2 skeletal muscle, n = 3 liver). e, Absolute expression (Cq value) of Adcy, Adcy3-at and housekeeping genes Hprt and Gapdh in hypothalamy of lean C57BL/6N male mice (n = 3 as determined by qPCR analysis. ND = Not detected. fh, Absolute mRNA expression (Ct threshold levels) of Adcy3-at (f), Adcy3 (g) and Ucp1 (h) in BAT-derived SVF at indicated stages of brown adipogenesis and after stimulation with 1 mM db-cAMP or 10 µM CL316,243 as determined by qPCR. Replicates depict experiments performed in SVF isolated from individual mice (n = 4). Bar graphs represent mean + SEM with all data points. i,j, Expression of indicated BAT marker mRNAs in BAT (i) or iWAT (j) of chow diet or HFD-fed male C57BL/6N mice, each housed either at 22 °C or exposed to 24 h for 5 °C cold exposure as determined by qPCR. k, Expression of Adcy3-at in BAT of chow diet fed male C57BL/6N mice at 2.5 months or 25 months of age (n = 8). Bar graphs represent mean + SEM with all data points plotted. ik, Bar graphs represent mean + SEM with all data points plotted. To test for statistical significance, non-parametric (ranked) Kruskal–Wallis one-way analysis of variance (ANOVA) tests with Dunn’s correction for multiple testing were performed. P values are indicated in the panel. Source data
Extended Data Fig. 5
Extended Data Fig. 5. Activated adipocytes express truncated Adcy3.
Activated thermogenic adipocytes express a truncated Adcy3 (Adcy-AT) transcript and protein isoform. ac, Relative expression of Adcy (blue) and Adcy3-at (red) as determined by qPCR analysis in BAT (a), iWAT (b) and eWAT (c) from chow diet fed, male C57BL/6N mice housed either at 28 °C (thermoneutrality) or exposed to 5 °C for 24 h and 7 days (n = 8). Bar graphs represent mean + SEM with all data points plotted. To test for statistical significance, non-parametric (ranked) Kruskal–Wallis one-way analysis of variance (ANOVA) tests with Dunn’s correction for multiple testing were performed. P values are indicated in the panel. Source data
Extended Data Fig. 6
Extended Data Fig. 6. Generation of mice deficient for Adcy3-at.
Generation of transgenic mice deficient for Adcy3-at at exon 1 and TSS using CRISPR/CAS9 gene. a, Illustration of CRISPR-Cas9 mediated excision of Adcy3-at specific Exon 2b, including Adcy3-at TSS (light blue), yielding Adcy3-at specific knockout (Adcy3∆AT) mice. b, USCS genome browser track depicting mRNA (grey) and H3K4me3 signals (magenta) in the murine Adcy3 locus from chow diet fed, male C57BL/6N mice either housed at 22 °C (light grey) and exposed to 5 °C for 24 h (dark grey) and from HFD-fed, male C57BL/6N mice housed at 22 °C (light orange) and exposed to 5 °C for 24 h (dark orange) as determined by RNA-Seq and H3 K4me3 ChiP-Seq. Location and sequence of sgRNAs used for CRISPR/Cas9 mediated 978-nt deletion of Adcy3-at TSS are indicated. c, Southern blot of a control (C57BL/6N wildtype) and from Adcy3∆AT embryonic stem cell (ESC) genomic DNA. The asterisk depicts a heterozygous Adcy3∆AT/wild-type ESC clone. d, PCR from genomic DNA isolated from wild-type and Adcy3∆AT ESC genomic DNA. e,f, Relative expression of Adcy3-at (e) and Adcy3 (f) as determined by qPCR analysis in BAT, iWAT, and eWAT from chow diet fed, male LoxP (n = 4 for BAT and iWAT, n = 2 for eWAT) and Adcy3∆AT mice (n = 4) housed at 22 °C. Bar graphs represent mean + SEM with all data points plotted. An unpaired, two-tailed, and non-parametric Mann-Whitney test was performed to assess statistical significance. P values are indicated within the panel. Created with BioRender.com. Source data
Extended Data Fig. 7
Extended Data Fig. 7. mAC3-AT inhibits oxidative metabolism and protects from obesity.
mAC3-AT inhibits oxidative metabolism in vitro and in vivo and protects from diet-induced obesity. a,b, Extracellular acidification rates in 1°iBA derived from SVF of LoxP (n=5) or Adcy3∆AT (n = 5) and stimulated with oligomycin (O), FCCP (F) and Antimycin A plus Rotenone (A/R) (a), or 10 µM CL316,243 (CL) (b) at the indicated time points. The numbers of measured wells are indicated in the panel. c,d, Oxygen consumption rates in 1°iWA derived from SVF of LoxP (n = 5) or Adcy3∆AT (n = 5) and stimulated with oligomycin (O), FCCP (F) and Antimycin A plus Rotenone (A/R) (c) or 10 µM CL316,243 (CL) (d) at the indicated time points. The numbers of measured wells are indicated in the panel. e,f, Extracellular acidification rates in 1°iWA derived from SVF of LoxP (n = 5) or Adcy3∆AT (n = 5) and stimulated with oligomycin (O), FCCP (F) and Antimycin A plus Rotenone (A/R) (e), or 10 µM CL316,243 (CL) (f) at the indicated time points. The numbers of measured wells are indicated in the panel. af, Bar graphs represent mean + SEM. Unpaired, two-tailed Student’s T-tests were performed to assess statistical significance. P values are indicated within the panel. Genotype P = 0.0072 (a), P = 0.218 (b), P = 0.007 (c), P = 0.1213 (d), P = 0.032 (e), P = 0.138 (f). g, Body weights in chow diet-fed, male LoxP (n = 7) and Adcy3∆AT (n = 9) mice. h, Blood glucose levels during intraperitoneal glucose tolerance tests in chow diet-fed, male LoxP (n = 7) and Adcy3∆AT (n = 9) mice. i, Blood glucose levels during intraperitoneal insulin tolerance tests in chow diet-fed, male LoxP (n = 7) and Adcy3∆AT (n = 9) mice. j, Indirect calorimetry mediated quantification of cumulative food intake in chow diet-fed, male LoxP (n = 7) and Adcy3∆AT (n = 9) mice. gj, Graphs represent mean + SEM. Statistical significance was determined by performing Two-Way ANOVA with repeated measurements for x values (mixed models). Post-hoc P value correction to account for multiple testing was performed using Bonferroni adjustment. The source of variation, % of the variation and exact P values are given in the table insets. Genotype P = 0.749 (g), P = 0.48 (h), P = 0.66 (i), P = 0.003 (j). k, Indirect calorimetry measurement of oxygen consumption in chow-diet fed, male LoxP (n = 7) and Adcy3∆AT (n = 9) mice. l, Indirect calorimetry determination of mean daily oxygen consumption in chow diet fed, male LoxP (n = 7) and Adcy3-AdcKO (n = 8) mice. Bar graphs represent mean + SEM with all data points plotted and parametric, unpaired, two-tailed Student’s t-tests were performed to assess statistical significance. P values are indicated within the panel. Source data
Extended Data Fig. 8
Extended Data Fig. 8. mAC3-AT inhibits oxidative metabolism and protects from obesity.
mAC3-AT inhibits oxidative metabolism in vitro and in vivo and protects from diet-induced obesity. a, relative expression of indicated thermogenic BAT marker mRNAs in chow diet-fed, male LoxP (n = 5 for 22 °C, n = 6 for 5 °C) and Adcy3∆AT (n = 3 for 22 °C, n = 4 for 5 °C) mice. Bar graphs represent mean + SEM with all data points plotted and unpaired, two-tailed, non-parametric Mann-Whitney tests were performed for indicated comparisons to assess statistical significance. P values are given within the panel. b,c, Relative expression of indicated thermogenic BAT marker mRNAs in 1°BA (b) and 1°iWA (c) from LoxP (n = 4 individual SVF preparations) and Adcy3∆AT (n = 4 individual SVF preparations). Primary adipocytes were stimulated with 10 μM CL316,243 for 6 h. Bar graphs represent mean + SEM with all data points plotted. To test for statistical significance, non-parametric, ranked Kruskal–Wallis one-way analysis of variance (ANOVA) tests with Dunn’s correction for multiple testing were performed. P values are indicated in the panel. d, Images of HE-stained adipose tisue, extracted from male LoxP and Adcy3ΔAT mice fed CD or HFD. Scale bars: 100 µm. e, Adipocyte size distribution quantified using images as shown in (d). iWAT adipocytes size distribution was analyzed for n = 7 LoxP and n = 3 Adcy3ΔAT animals. gWAT adipocyte size distribution was analyzed for n = 8 LoxP and n = 3 Adcy3ΔAT animals. Mean ± SD of the distributions from all mice per group; P values indicated for unpaired, two-sided t tests with Welch correction between LoxP and Adcy3ΔAT at the size range; *p ≤ 5 × 10⁻²; **p. Source data
Extended Data Fig. 9
Extended Data Fig. 9. mAC3-AT alters mAC3 localization and limits cAMP.
mAC3-AT alters mAC3 subcellular localization and, thereby, limits cAMP bio synthesis. a,b, analysis of STK activity in Adcy3∆AT BAT. Kinome trees depict the mean kinase statistic of differentially activated STKs in Adcy3 vAT versus LoxP (22 °C) (a) and Adcy3∆AT (22 °C) versus Adcy3∆AT (5 °C, 6 days) (b). c,d, Comparison of Adcy3∆AT versus LoxP at 22 °C (c) and Adcy3∆AT versus LoxP after 6 days at 5 °C (d). At 22 °C, a set of kinases is inversely regulated in BAT of Adcy3∆AT and Adcy3AdcKO mice compared to LoxP mice. The mean kinase statistic of these kinases is shown for 22 °C (c) and for 5 °C (d). Data includes n = 4 biological replicates for all conditions. e, CHO cells stably expressing AC3-HA and transiently transfected with mCherry-CAAX were sonicated and labeled with a Calnexin antibody (ER-marker, magenta) and an HA antibody (green). mCherryCAAX fluorescence is indicated in red. Single channels are shown at the top, merged images at the bottom row. White boxes are shown as magnified view at the bottom-right. Arrows point to endoplasmic reticulum-plasma membrane (ER-PM) contact sites, asterixis indicate contact-free parts within the membrane sheet. Scale bar: 10 μm. f, See (e) for CHO cells stably expressing AC3-AT-HA. The images represent at least four independent experiments, with 5-10 cells analysed per condition per experiment. g, Quantification of the average HA-signal intensity within the PM (co-localization with mCherry-CAAX) and the ER (co-localization with calnexin). Data shown as mean + SEM (empty vector: n = 4; AC3-AT: n = 8, AC3: n = 10). h, Ratio PM/ER distribution (empty vector: n = 4; mAC3-AT: n = 8, mAC3: n = 10). Bar graphs represent mean + SEM with all data points plotted. An unpaired, two-tailed, and non-parametric Mann-Whitney tests were performed to assess statistical significance; p-values are indicated within the panel. i,j, Quantification of intracellular cAMP levels. CHO cells stably expressing mAC3-AT or mAC3, or empty vector transfected CHO cells were stimulated with buffer or 2 μM Forskolin for 30 min (i) or buffer or 1 μM Isoproterenol for 15 min (j). Values were normalized to the respective buffer control and to the respective amount of total protein (empty vector: n = 4; AC3-AT: n = 5, AC3-FL: n = 5). gj, Data is shown as mean + SEM with all data points plotted. To test for statistical significance, non-parametric (ranked) Kruskal–Wallis one-way analysis of variance (ANOVA) tests with Dunn’s correction for multiple testing were performed; p-values are indicated in the panel. Source data
Extended Data Fig. 10
Extended Data Fig. 10. Conservation of Adcy3-at and Ppargc1a-at.
Evolutionary conservation of Adcy3-at and Ppargc1a-at isoforms. a, Mammalian phylogeny from Meredith et al. modified in iTOL, with silhouettes in black indicating representative species that were selected for comparative analyses of PPARGC1A-AT. b, Genomic conservation among representative rodent species (rodentia) of Adcy3-at identified in the mouse. Color gradient indicates percent nucleotide identity of the Adcy3-at relative to the mouse. Phylogeny based on Swanson et al.. c, Genomic conservation among representative primates (primates) of Adcy3-at identified in human. Color gradient indicates percent nucleotide identity of Adcy3-at relative to the human. Phylogeny based on Perelman et al.. d, Nucleotide sequence alignment of Ppargc1a-at (Exon 1b) from various mammalian species. e, Percent identity matrix of Ppargc1a-at among 14 representative mammals (exon 1b). Reproduced from ref. under a Creative Commons license CC BY 4.0.

Similar articles

Cited by

References

    1. Kusminski, C. M., Bickel, P. E. & Scherer, P. E. Targeting adipose tissue in the treatment of obesity-associated diabetes. Nat. Rev. Drug Discov.15, 639–660 (2016). - PubMed
    1. Cannon, B. & Nedergaard, J. Brown adipose tissue: function and physiological significance. Physiol. Rev.84, 277–359 (2004). - PubMed
    1. van Marken Lichtenbelt, W. D. et al. Cold-activated brown adipose tissue in healthy men. N. Engl. J. Med.360, 1500–1508 (2009). - PubMed
    1. Cypess, A. M. et al. Identification and importance of brown adipose tissue in adult humans. N. Engl. J. Med.360, 1509–1517 (2009). - PMC - PubMed
    1. Virtanen, K. A. et al. Functional brown adipose tissue in healthy adults. N. Engl. J. Med.360, 1518–1525 (2009). - PubMed

LinkOut - more resources