. 2024 Apr 29;24(1):450.
doi: 10.1186/s12879-024-09343-8.

Spatial spread of COVID-19 during the early pandemic phase in Italy

Affiliations

Spatial spread of COVID-19 during the early pandemic phase in Italy

Valeria d'Andrea et al. BMC Infect Dis. .

Abstract

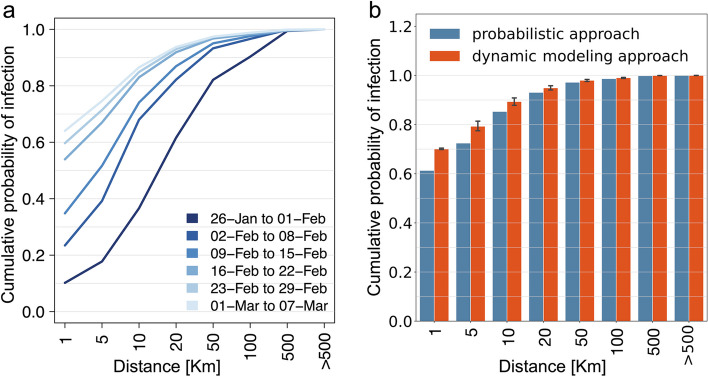
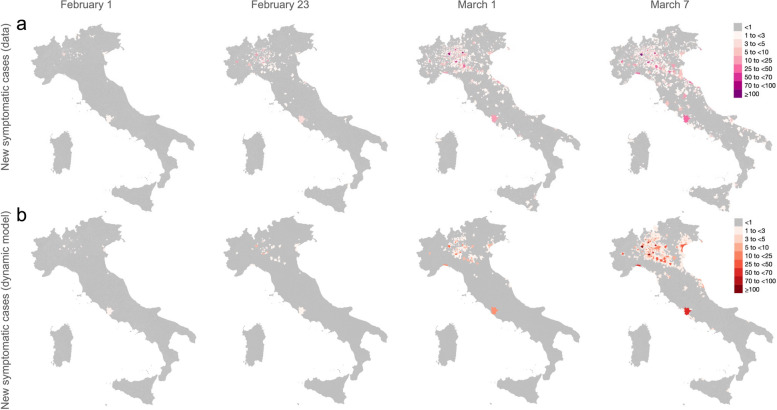
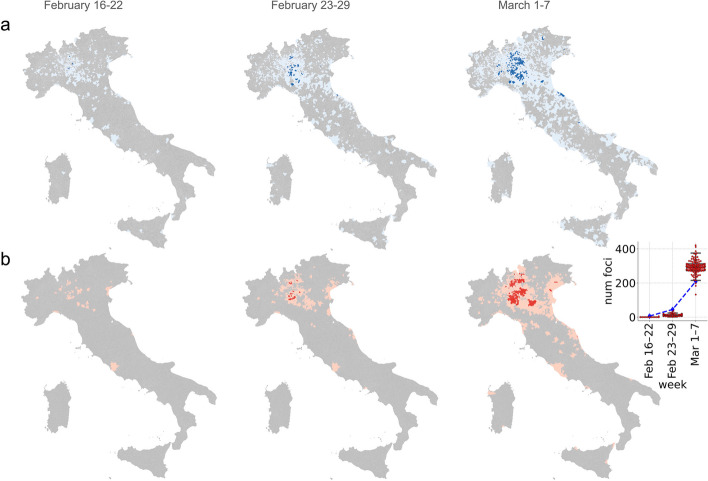
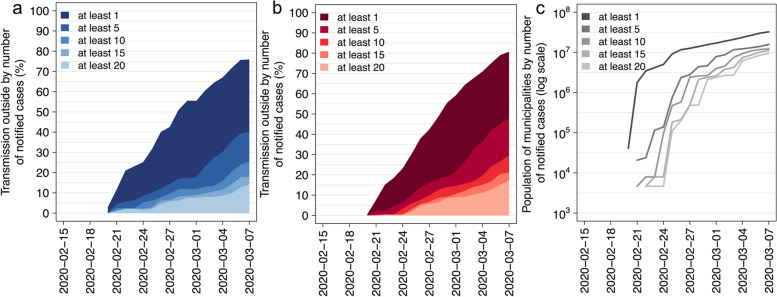
Quantifying the potential spatial spread of an infectious pathogen is key to defining effective containment and control strategies. The aim of this study is to estimate the risk of SARS-CoV-2 transmission at different distances in Italy before the first regional lockdown was imposed, identifying important sources of national spreading. To do this, we leverage on a probabilistic model applied to daily symptomatic cases retrospectively ascertained in each Italian municipality with symptom onset between January 28 and March 7, 2020. Results are validated using a multi-patch dynamic transmission model reproducing the spatiotemporal distribution of identified cases. Our results show that the contribution of short-distance ( 10 k m ) transmission increased from less than 40% in the last week of January to more than 80% in the first week of March 2020. On March 7, 2020, that is the day before the first regional lockdown was imposed, more than 200 local transmission foci were contributing to the spread of SARS-CoV-2 in Italy. At the time, isolation measures imposed only on municipalities with at least ten ascertained cases would have left uncontrolled more than 75% of spillover transmission from the already affected municipalities. In early March, national-wide restrictions were required to curb short-distance transmission of SARS-CoV-2 in Italy.

Keywords: COVID-19; Infection spread; SARS-CoV-2; Spatial diffusion; Spatial model; Transmission distance.


Conflict of interest statement

MA has received research funding from Seqirus. The funding is not related to COVID-19. All other authors declare no competing interest.

Figures

Fig. 1
Fig. 1
a Cumulative distribution of the probability that a COVID-19 case was infected at a distance D from their residence, as estimated with the probabilistic approach, for 6 consecutive weeks between January 26 and March 7, 2020. b Cumulative distribution of the probability that a COVID-19 case was infected at distance D from their residence, as estimated with the probabilistic approach (blue) and the dynamic SIR model (red), considering the entire time interval between January 26 and March 7, 2020. Vertical lines show the range from 2.5 to 97.5 percentiles associated with 100 simulation runs
Fig. 2
Fig. 2
a Spatial spread of COVID-19 cases with date of symptom onset from February 1 to March 7, 2020, across different municipalities of Italy as observed in the data [2]. b As a, but as obtained by simulating a SIR dynamic transmission model, under the assumption that 3% of infected individuals were ascertained by public health authorities. Panel b shows results for the SIR simulation that minimize the root mean square error with respect to the time series of cases retrospectively identified at the regional level. Mean estimates across all different model simulations are shown in Figure S6
Fig. 3
Fig. 3
a Spatial distributions of potential transmission foci (dark blue) as estimated with the probabilistic approach over 3 different weeks, namely February 16 – 22, February 23 – 29, and March 1 – 7, 2020. Municipalities with at least one individual developing symptoms in the corresponding week are shown in light blue. b As a, but as obtained by simulating a SIR dynamic transmission model: foci in red, municipalities with at least one notified case in pink. The inset shows the number of epidemic foci as estimated with the probabilistic approach (blue line) and as estimated with 100 simulation runs of the dynamic transmission model (red boxplots)
Fig. 4
Fig. 4
a Percentage of transmission ascribable to infected individuals residing in municipalities with at least 1, 5, 15, 20 cumulative notified cases in the data, as estimated with the probabilistic approach at different times. b As a, but as obtained by simulating a SIR dynamic transmission model. c Total number of individuals residing in municipalities with at least 1, 5, 15, 20 cumulative notified cases in the data

References

    1. Li Q, Guan X, Wu P, Wang X, Zhou L, Tong Y, et al. Early transmission dynamics in Wuhan, China, of novel coronavirus-infected pneumonia. N Engl J Med. 2020;382(13):1199–1207. doi: 10.1056/NEJMoa2001316. - DOI - PMC - PubMed
    1. Cereda D, Manica M, Tirani M, Rovida F, Demicheli V, Ajelli M, et al. The early phase of the COVID-19 epidemic in Lombardy. Italy Epidemics. 2021;37:100528. doi: 10.1016/j.epidem.2021.100528. - DOI - PMC - PubMed
    1. World Health Organization. WHO Coronavirus Disease (COVID-19) Dashboard. Available from: https://covid19.who.int/WHO-COVID-19-global-data.csv. Accessed 29 Jan 2024.
    1. Trentini F, Marziano V, Guzzetta G, Tirani M, Cereda D, Poletti P, et al. Pressure on the health-care system and intensive care utilization during the COVID-19 outbreak in the Lombardy region of Italy: a retrospective observational study in 43,538 hospitalized patients. Am J Epidemiol. 2022;191(1):137–146. doi: 10.1093/aje/kwab252. - DOI - PMC - PubMed
    1. Hao X, Cheng S, Wu D, Wu T, Lin X, Wang C. Reconstruction of the full transmission dynamics of COVID-19 in Wuhan. Nature. 2020;584(7821):420–424. doi: 10.1038/s41586-020-2554-8. - DOI - PubMed

Publication types