. 2024 Apr 29;22(1):182.
doi: 10.1186/s12916-024-03323-0.

Colon impairments and inflammation driven by an altered gut microbiota leads to social behavior deficits rescued by hyaluronic acid and celecoxib

Affiliations

Colon impairments and inflammation driven by an altered gut microbiota leads to social behavior deficits rescued by hyaluronic acid and celecoxib

Oryan Agranyoni et al. BMC Med. .

Abstract

Background: The exact mechanisms linking the gut microbiota and social behavior are still under investigation. We aimed to explore the role of the gut microbiota in shaping social behavior deficits using selectively bred mice possessing dominant (Dom) or submissive (Sub) behavior features. Sub mice exhibit asocial, depressive- and anxiety-like behaviors, as well as systemic inflammation, all of which are shaped by their impaired gut microbiota composition.

Methods: An age-dependent comparative analysis of the gut microbiota composition of Dom and Sub mice was performed using 16S rRNA sequencing, from early infancy to adulthood. Dom and Sub gastrointestinal (GI) tract anatomy, function, and immune profiling analyses were performed using histology, RT-PCR, flow cytometry, cytokine array, and dextran-FITC permeability assays. Short chain fatty acids (SCFA) levels in the colons of Dom and Sub mice were quantified using targeted metabolomics. To support our findings, adult Sub mice were orally treated with hyaluronic acid (HA) (30 mg/kg) or with the non-steroidal anti-inflammatory agent celecoxib (16 mg/kg).

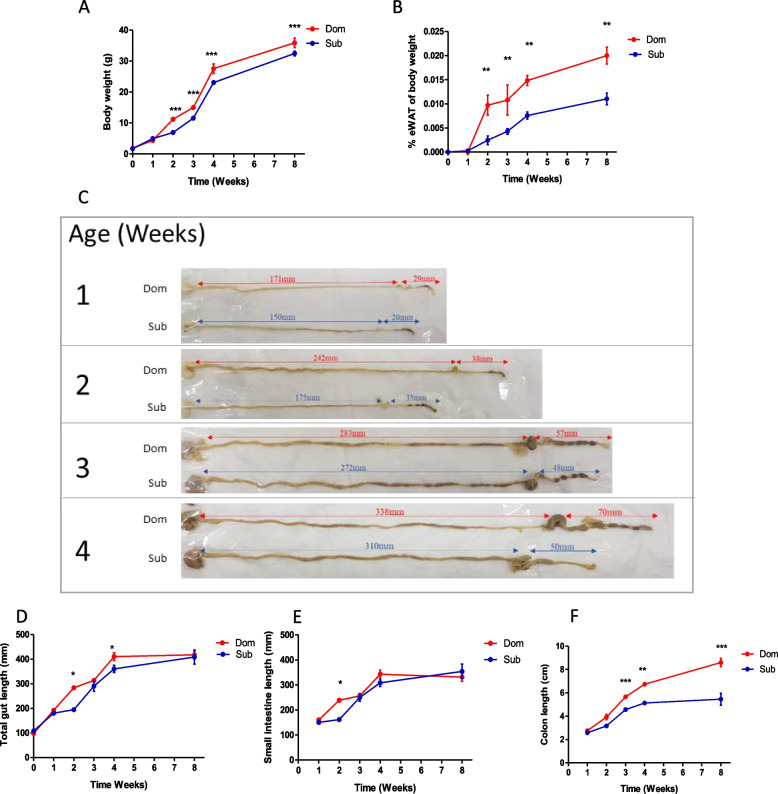
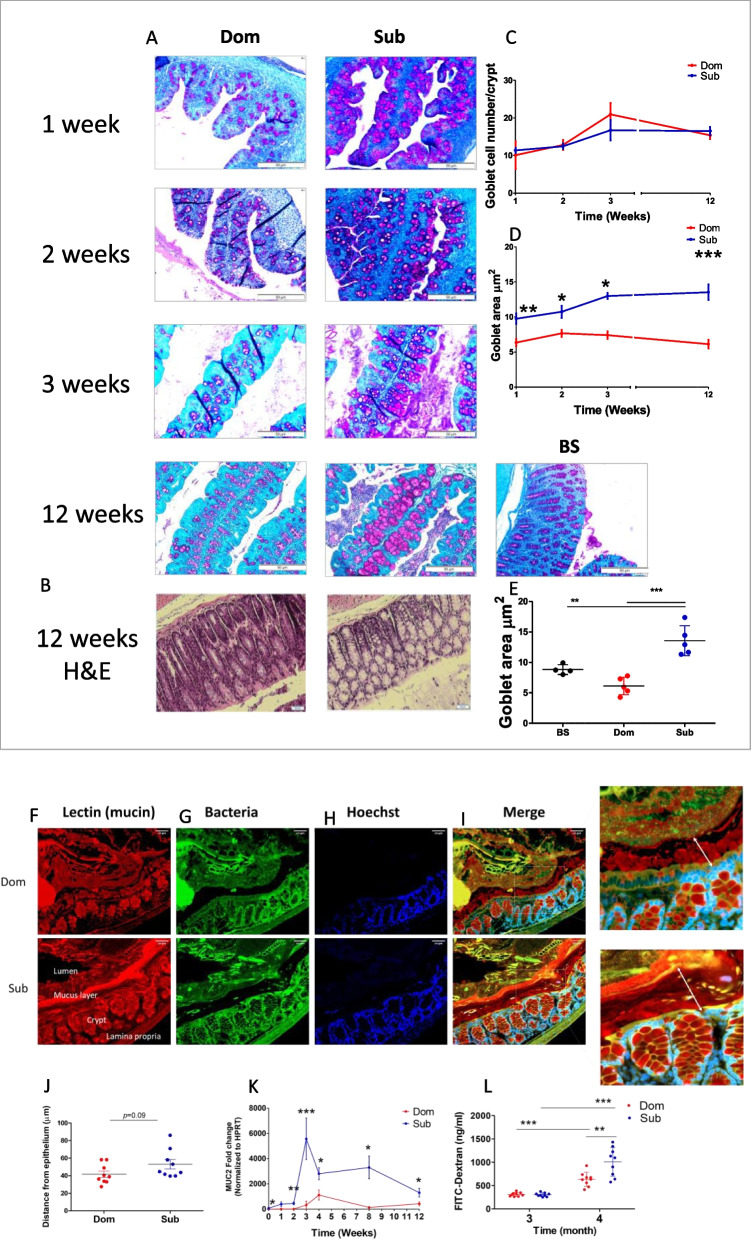
Results: We demonstrate that from early infancy the Sub mouse gut microbiota lacks essential bacteria for immune maturation, including Lactobacillus and Bifidobacterium genera. Furthermore, from birth, Sub mice possess a thicker colon mucin layer, and from early adulthood, they exhibit shorter colonic length, altered colon integrity with increased gut permeability, reduced SCFA levels and decreased regulatory T-cells, compared to Dom mice. Therapeutic intervention in adult Sub mice treated with HA, celecoxib, or both agents, rescued Sub mice phenotypes. HA treatment reduced Sub mouse gut permeability, increased colon length, and improved mouse social behavior deficits. Treatment with celecoxib increased sociability, reduced depressive- and anxiety-like behaviors, and increased colon length, and a combined treatment resulted in similar effects as celecoxib administered as a single agent.

Conclusions: Overall, our data suggest that treating colon inflammation and decreasing gut permeability can restore gut physiology and prevent social deficits later in life. These findings provide critical insights into the importance of early life gut microbiota in shaping gut immunity, functionality, and social behavior, and may be beneficial for the development of future therapeutic strategies.

Keywords: Celecoxib; Colon inflammation; Colon mucin; Depressive-like behavior; Gut microbiota; Gut permeability; Hyaluronic acid; SCFAs; Social behavior; Tregs.


Conflict of interest statement

The authors declare that they have no competing interests.

Figures

Fig. 1
Fig. 1
Dom and Sub gut microbiota compositions differ from early infancy to adulthood. A Alpha diversity of the gut microbiotas of Dom and Sub mice at different ages, from first week (Dom 1 or Sub 1) to eight-weeks (Dom 8 or Sub 8), n = 6 (3 males and 3 females) in each group. B PCoA of Dom and Sub mice at different ages. C PCoA of Dom vs. Sub mice at different ages. D Abundance histograms of Clostridiales, Coprobacillaceae, Bacteroides, and Lactobacillus generated using LEfSe with collapsed features. E Differential abundance analysis of ASVs that had a significantly altered abundance in Dom and Sub at the first week using DESeq2 analysis. F The relative abundance of the genus Bifidobacterium of Dom and Sub gut microbiotas in mice aged one to eight- weeks. (**) p < 0.01 (***), p < 0.001. Error bars show standard deviation
Fig. 2
Fig. 2
Dom and Sub mice differ in body weight, eWAT content, and colon development from early infancy to adulthood. A Body-weight follow-up of Dom (n = 90; 45 males) and Sub (n = 92; 42 males) mice. B eWAT mass (normalized to body weight) follow-up of Dom and Sub male mice. C Visualization of eight representative mouse intestines removed from Dom and Sub male mice. Colon length (in millimeters, mm) of Dom vs. Sub at one to four-weeks of age; means are 29 vs. 20, 38 vs. 35, 57 vs. 48, and 70 vs. 50 mm, respectively. D Complete intestine length follow-up. E Small intestine length follow-up. F Colon length follow-up. eWAT and colon tissue follow-up was performed on the same mice (Dom, n = 53; Sub, n = 51). Statistical significance was determined using a student’s t-test, (*) p < 0.05, (**) p < 0.01, (***) p < 0.001. Error bars show standard deviation
Fig. 3
Fig. 3
Sub mice compared to Dom mice possess age-dependent higher mucin expression and increased gut permeability. A PAS staining of Dom (n = 32 males) and Sub mice (n = 29 males) at ages one, two, three, and 12-week-old and 12-week-old BS mice (n = 4 males). B H&E staining of 12-week-old Dom (n = 10 males) and Sub mice (n = 10 males). C Quantification of the goblet cell number according to the mucin droplets per crypt from 10 fields of each mouse at ages 1, 2, 3, 4, and 12 weeks old. D Quantification of the goblet cell area (μm2) according to the mucin droplets from 10 fields of each mouse at ages 1, 2, 3, 4, and 12 weeks old. E Quantification of the goblet cell area (μm2) according to the mucin droplets from ten fields of Dom, Sub, and BS mice at the age of 12 weeks. F Dom and Sub mouse colon mucin staining using lectin labeling. G Dom and Sub mouse colon bacteria staining using FISH probes. H Dom and Sub mouse colon nuclei staining using Hoechst labeling. I Merged staining. J Quantification of the distance between the lumen bacteria and the colon epithelium based on the FISH staining (panels FI), using the Zen 3.4 software. White arrows define the distance measured. K MUC2 gene expression normalized to HPRT in Dom (n = 30 males) and Sub mice (n = 34 males), at the ages of 0, 1, 2, 3, 4, 8, and 12 weeks old. L Gut permeability of Dom and Sub mice (n = 9 males in each group, in ng/ml), at the ages of three and four months old, based on the detection of serum FITC-dextran levels, 5–6 h post FITC-dextran oral gavage administration. Statistical significance was determined using a student’s t-test; (*) p < 0.05, (**) p < 0.01, (***) p < 0.001. Error bars show standard deviation
Fig. 4
Fig. 4
Adult Sub mice demonstrate lower colon and spleen Treg cell levels compared to Dom mice. Frequencies of Foxp3+/Rorγ+ Tregs among total Tregs in colon and spleen tissues of Dom and Sub mice were determined by flow cytometry. A Representative FACS plots depict Helios/Rorγ+ expression by Tregs from Dom and Sub mice (n = 6). B Tregs were analyzed for frequencies of CD19-/CD4+/Foxp3+/Rorγ+ Tregs among CD45+ cells. C Tregs were analyzed for frequencies of Foxp3+/Helios+ Tregs among CD4+ cells. D Tregs were analyzed for frequencies of Foxp3+/Rorγ+ Treg among CD4+ cells. E Representative FACS plots depicting CD8+/CD4+ expression by T cells from the spleens of Dom and Sub mice. F Representative FACS plots depicting Foxp3+/Rorγ+ expression by CD4+ T cells from the spleens of Dom and Sub mice. G Representative FACS plots depicting Helios+/Rorγ+ expression by Treg from the spleen of Dom and Sub mice. H T cells were analyzed for frequencies of CD19-/CD4+ T cells among CD45+ cells. I T cells were analyzed for frequencies of CD19-/CD4+/Foxp3+ Treg cells among CD45+ cells. J Treg cells were analyzed for frequencies of CD19-/CD4+/Foxp3+/Helios+ Treg cells among CD45+ cells. K Treg cells were analyzed for CD19-/CD4+/Foxp3+/Rorγ+ Treg cells frequencies among CD45+ cells. L Treg cells were analyzed for frequencies of Foxp3+/Helios+ Treg cells among CD4+ cells. M Treg cells were analyzed for frequencies of Foxp3+/Rorγ+ Treg cells among CD4+ cells. (*) p < 0.05 (**) p < 0.01, and (***) p < 0.001, analyzed by Student’s t-test. Error bars show standard deviation. ns nonsignificant
Fig. 5
Fig. 5
Adult Sub mice possess microbiota-induced lower fecal SCFA levels compared to Dom mice. A Propionate, B acetate, and C butyrate concentrations (nmol/mg feces) in Dom (n = 8) and Sub (n = 7) stools. D Propionate, E acetate, and F butyrate concentrations (nmol/mg feces) in 2.5 months transplanted GF mice. Transplants were of PBS (n = 3) or stools from Dom (n = 6) or Sub (n = 7) mice resuspended in PBS. Statistical significance was determined using a student’s t-test and one-way ANOVA, (*) p < 0.05. Error bars show standard deviation
Fig. 6
Fig. 6
Anti-inflammatory and gut permeability reduction treatments modulated Sub mouse behavior, colon length and inflammation, and gut permeability. A The study design of the treatment experiment performed on 40 mice (4 groups of 10 mice each—control (water-treated), HA-treated, AI-treated, and HA + AI-treated). B EPM test of Sub (n = 40 males, 10 in each group) controls and mice treated with HA, AI, and HA + AI agents. Y-axis shows the frequency of entering the open arms normalized to the frequency of entering the open and close arms. C FST of Sub mice treated with HA, AI, and HA + AI agents and controls. Y-axis shows the time mice were immobile in the water. D TCST of Sub mice treated with HA, AI, and HA + AI agents and controls. Y-axis shows the nose-point frequency to enter the area around the stranger mouse. E Colon length of Sub mice treated with HA, AI, and HA + AI agents and Controls. F FITC-dextran assay of gut permeability, Y-axis shows FITC-dextran concentration in the mouse serum (ng/ml) 5 h after oral gavage at 4.5 months old. GI A cytokine array comparison of pooled proteins extracted from the colons of Sub mice: controls (n = 3) and those treated with G HA (n = 3), H AI, and I HA + AI. Panels G, H, and I present only the colon cytokines with significantly different expression per treatment, compared to the Sub control group. Each bar represents the average duplicate cytokine expression normalized to the positive control. Control Sub mice demonstrated a significantly higher cytokine level than AI-treated Sub mice. Statistical significance was determined using a Student’s t-test, (*) p < 0.05, (**) p < 0.01, and (***) p < 0.001. Error bars show standard deviation. AI anti-inflammatory, HA hyaluronic acid, EPM elevated plus maze, TCT three chambers test, FST forced swim test
Fig. 7
Fig. 7
A model of the Sub mouse altered gut–brain–axis crosstalk that shapes anti-social behavior. Sub mice are born with lower gut microbiota diversity and lack Lactobacillus and Clostridiales that are critical bacteria essential for tissue development and function. The altered microbiota is, in part, characterized by reduced abundance of SCFA-producing bacteria which leads to increased mucin secretion reflected by dramatic elevation in MUC2 gene expression, and altered immunity, reflected by lower Treg cells, leading to imbalanced inflammation. The exacerbated colon inflammation causes increased gut permeability and systemic inflammation primarily due to the unregulated transfer of bacterial substances to the circulating blood. The systemic inflammation may affect the eWAT metabolic and inflammatory profile, induce neuroinflammation, and affect Sub mice behavior

Similar articles

Cited by

References

    1. Barak B, Feng G. Neurobiology of social behavior abnormalities in autism and Williams syndrome. Nat Neurosci. 2016;19:647–655. doi: 10.1038/nn.4276. - DOI - PMC - PubMed
    1. Kaidanovich-Beilin O, Lipina T, Vukobradovic I, Roder J, Woodgett JR. Assessment of social interaction behaviors. J Vis Exp. 2011;25(48):e2473. - PMC - PubMed
    1. Hawkley LC, Cacioppo JT. Loneliness matters: a theoretical and empirical review of consequences and mechanisms. Ann Behav Med. 2010;40:218–227. doi: 10.1007/s12160-010-9210-8. - DOI - PMC - PubMed
    1. Baumeister RF, Leary MR. The need to belong: desire for interpersonal attachments as a fundamental human motivation. Psychol Bull. 1995;117:497–529. doi: 10.1037/0033-2909.117.3.497. - DOI - PubMed
    1. Berkman LF, Glass T, Brissette I, Seeman TE. From social integration to health: Durkheim in the new millennium. Soc Sci Med. 2000;51:843–857. doi: 10.1016/S0277-9536(00)00065-4. - DOI - PubMed

Publication types

LinkOut - more resources