. 2024 Apr 29;31(1):44.
doi: 10.1186/s12929-024-01031-8.

Membrane lipid remodeling eradicates Helicobacter pylori by manipulating the cholesteryl 6'-acylglucoside biosynthesis

Affiliations

Membrane lipid remodeling eradicates Helicobacter pylori by manipulating the cholesteryl 6'-acylglucoside biosynthesis

Lih-Lih Ong et al. J Biomed Sci. .

Abstract

Background: Helicobacter pylori, the main cause of various gastric diseases, infects approximately half of the human population. This pathogen is auxotrophic for cholesterol which it converts to various cholesteryl α-glucoside derivatives, including cholesteryl 6'-acyl α-glucoside (CAG). Since the related biosynthetic enzymes can be translocated to the host cells, the acyl chain of CAG likely comes from its precursor phosphatidylethanolamine (PE) in the host membranes. This work aims at examining how the acyl chain of CAG and PE inhibits the membrane functions, especially bacterial adhesion.

Methods: Eleven CAGs that differ in acyl chains were used to study the membrane properties of human gastric adenocarcinoma cells (AGS cells), including lipid rafts clustering (monitored by immunofluorescence with confocal microscopy) and lateral membrane fluidity (by the fluorescence recovery after photobleaching). Cell-based and mouse models were employed to study the degree of bacterial adhesion, the analyses of which were conducted by using flow cytometry and immunofluorescence staining, respectively. The lipidomes of H. pylori, AGS cells and H. pylori-AGS co-cultures were analyzed by Ultraperformance Liquid Chromatography-Tandem Mass Spectroscopy (UPLC-MS/MS) to examine the effect of PE(10:0)2, PE(18:0)2, PE(18:3)2, or PE(22:6)2 treatments.

Results: CAG10:0, CAG18:3 and CAG22:6 were found to cause the most adverse effect on the bacterial adhesion. Further LC-MS analysis indicated that the treatment of PE(10:0)2 resulted in dual effects to inhibit the bacterial adhesion, including the generation of CAG10:0 and significant changes in the membrane compositions. The initial (1 h) lipidome changes involved in the incorporation of 10:0 acyl chains into dihydro- and phytosphingosine derivatives and ceramides. In contrast, after 16 h, glycerophospholipids displayed obvious increase in their very long chain fatty acids, monounsaturated and polyunsaturated fatty acids that are considered to enhance membrane fluidity.

Conclusions: The PE(10:0)2 treatment significantly reduced bacterial adhesion in both AGS cells and mouse models. Our approach of membrane remodeling has thus shown great promise as a new anti-H. pylori therapy.

Keywords: Helicobacter pylori; Adhesion; Biosynthesis; Cholesterol; Membrane; Phospholipids.


Conflict of interest statement

The authors declare that they have no competing interests.

Figures

Fig. 1
Fig. 1
Treatment of AGS cells with CAGs and CG resulted in a different degree of lipids rafts clustering. A Structures of CAGs and CG in which R(C = O) denotes an acyl chain. B and C Confocal images of lipid rafts clustering in the presence of CAGs and CG in a single (B) or multiple AGS cells (C). After AGS cells were treated with CAGs or CG (as indicated) for I h, lipid rafts (GM1-containing) were labeled with Alexa Fluor 594-conjugated cholera toxin subunit b (CT-b; red fluorescence). Confocal images were collected under a Leica SP5 X inverted confocal microscope. Scale bar: 5 μm. Please note that colon-containing numbers are designated as CAGs that contain corresponding acyl chains. D The fluorescent intensities in (C) were quantified. At least 40 GM1-positive AGS cells from each experiment were scored for quantitative analysis by using ImageJ software. Statistical analysis was performed using Student's t test, and the asterisks represent statistical significance (P < 0.05) compared with the DMSO control group. (*p < 0.05, **p < 0.01, ***p < 0.001, ****p < 0.0001)
Fig. 2
Fig. 2
Acyl chains of CAGs affected membrane fluidity in AGS cells. A Representative images were collected from the fluorescence recovery after photobleaching (FRAP). AGS cells were treated with different CAGs or DMSO (control) and labeled with Alexa Fluor 594-conjugated CT-b (red fluorescence). A region of interest with a 3.0 μm diameter (arrow) was photobleached with intense lesser pulses at 595 nm and the recovery of fluorescence was recorded at 20 s intervals. Scale Bar: 5 mm. B Comparisons of the mobile fractions (Mf) for CAGs and CG. Mf is calculated by [(Fμ-F0)/(FPre-F0)]. Fμ,F0andFPre are designated as post-bleach steady state, initial post-bleach, and pre-bleach fluorescent intensities, respectively. The values are means and standard deviations of five independent experiments. Statistical analysis employed the Student's t-test compared to the DMSO control group, and only groups showing significance were identified. Statistically significant levels are indicated by asterisks, with *p < 0.05
Fig. 3
Fig. 3
Treatments of AGS cells with CG and CAGs displayed a different degree of bacterial adhesion. AGS cells were first treated with CG and CAGs (as indicated) for 1 h, infected with H. pylori 26695 for another 1 h, and then subjected to flow cytometry analysis. Adherence was measured as the proportion of adhered AGS cells with H. pylori. One-way ANOVA with Dunnett's multiple comparisons test, comparing the control (DMSO and CG), and each treatment to the CAG18:0. Data represent mean ± SEM of biologically independent samples (*p < 0.05, **p < 0.01, ***p < 0.001, ****p < 0.0001)
Fig. 4
Fig. 4
Treatment of with H. pylori cells with PE(10:0)2, PE(18:3)2 or PE(22:6)2 reduced their adhesion to AGS cells. A AGS cells were treated with PE(10:0)2, PE(18:3)2 or PE(22:6)2 for 1 h, followed by staining with Alexa Fluor 594-conjugated CT-b to measure the degree of lipid rafts clustering. Approximately 100 cells were measured in each experiment. H. pylori was initially treated with PE containing specific acyl chains (as indicated) for 1 h and then cocultured with AGS cells for another 1 h. Lipid rafts clustering and nuclei of AGS cells were stained with CT-b (red fluorescence) and DAPI (blue), respectively. H. pylori was labeled by specific antibodies (green). Colocalization of H. pylori and lipid rafts clustering was indicated by white arrows (yellow). Scale bars: 10 (upper) and 5 (lower) μm. C Relative level of colocalization was quantified with ImageJ, calculated by co-localized signals per cell, and normalized according to that of the control (no PE-treated). Data represent the mean percentage of colocalization ± SEM (n ≥ 50 cells) and all statistically significant differences are indicated with asterisks; *p < 0.05 vs. the control group. H. pylori was first treated with PE (as indicated) for 1 h and then cocultured with AGS cells for another 1 h. A degree of bacterial adhesion was then measured by flow cytometric analysis in accordance with the aforementioned procedure in Fig. 3
Fig. 5
Fig. 5
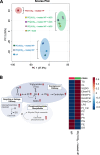
Lipidomics analysis of membrane lipids was performed in H. pylori treated with PE for 16 h. A Principal component analysis (PCA) was performed on the PE-treated H. pylori cultures and the bacterial cocultures with AGS cells. The resulting PCA score plot obtained from the data detected in positive mode MS analysis. Apparently there are two obvious clusters when comparing between the first principal component and the second. B The heat map displayed highly changed lipids in the H. pylori cells that were treated with or without PE(10:0)2. Changes in the lipid species were shown by colors ranging from positive correlation (red) to absence of correlation (white) and negative correlation (blue). A cutoff at FDR < 0.01 indicated 1% of all detected lipids resulted in false positives. Schematic diagram depicts up- or down-regulated lipids in PE(10:0)2-treated H. pylori. Abbreviations: PS (Phosphatidylserine), PE (Phosphatidylethanolamine), PI (Phosphatidylinositol), PC (Phosphatidylcholine), EtherPE (Ether-linked phosphatidylethanolamine), EtherPC (Ether-linked phosphatidylcholine), LPS (Lyso-PS), SQDG (Sulfoquinovosyl diacylglycerol), SHexCer (Sulfatide), and PI_Cer (ceramide phosphoinositol)
Fig. 6
Fig. 6
Feeding mice with the PE(10:0)2-containing diet abolished the bacterial adhesion. A A flowchart to explain the experimental procedure. B6 mice were starved for a day before they were treated with PE(10:0)2 and H. pylori infection for two phases. At day 1 of the first and second phases, mice were treated with 1000 mg/kg per mouse of PE(10:0)2 via oral gavage. At days 2, 3 and 4 of the two phases, these mice were co-treated via oral gavage with H. pylori (1 × 1010 cells) and 1000 mg/kg per mouse of PE(10:0)2. Mice were sacrificed at day 43 after the treatment procedure and the dissected gastric tissues were subjected to further analysis. B Degree of bacterial colonization was measured by colony-forming unit, i.e., identified bacterial colonies per mini-gram stomach tissue. Data are shown as mean ± SD (standard error) and all statistically significant differences are indicated with asterisks; ***p < 0.001, **p < 0.01, *p < 0.05 vs. the control group (n = 4). C The cells of H. pylori were detected by immunofluorescent staining in cryo-sections. After 4% formaldehyde fixation, the nuclei of murine gastric epithelial cells were shown in blue (by using Hoechst 33342 dye). The bacteria were labeled in green (by using H. pylori-specific monoclonal antibody and 488-conjugated secondary antibody). All images were acquired by confocal laser microscopy. The results shown are representative of four independent experiments. Scale bar: 20 μm

Similar articles

Cited by

References

    1. Marshall B, Warren JR. Unidentified curved bacilli in the stomach of patients with gastritis and peptic ulceration. The Lancet. 1984;323(8390):1311–1315. doi: 10.1016/S0140-6736(84)91816-6. - DOI - PubMed
    1. Blaser MJ. Helicobacter pylori and the pathogenesis of gastroduodenal inflammation. J Infect Dis. 1990;161(4):626–633. doi: 10.1093/infdis/161.4.626. - DOI - PubMed
    1. Vogiatzi P, Cassone M, Luzzi I, Lucchetti C, Otvos L, Jr, Giordano A. Helicobacter pylori as a class I carcinogen: physiopathology and management strategies. J Cell Biochem. 2007;102(2):264–273. doi: 10.1002/jcb.21375. - DOI - PubMed
    1. Clyne M, Dolan B, Reeves EP. Bacterial factors that mediate colonization of the stomach and virulence of Helicobacter pylori. FEMS Microbiol Lett. 2007;268(2):135–143. doi: 10.1111/j.1574-6968.2007.00648.x. - DOI - PubMed
    1. Mysore JV, Wigginton T, Simon PM, Zopf D, Heman-Ackah LM, Dubois A. Treatment of Helicobacter pylori infection in rhesus monkeys using a novel antiadhesion compound. Gastroenterology. 1999;117(6):1316–1325. doi: 10.1016/S0016-5085(99)70282-9. - DOI - PubMed