. 2024 Apr 29;17(1):92.
doi: 10.1186/s13048-024-01419-y.

A novel defined programmed cell death related gene signature for predicting the prognosis of serous ovarian cancer

Affiliations

A novel defined programmed cell death related gene signature for predicting the prognosis of serous ovarian cancer

Feng Zhan et al. J Ovarian Res. .

Abstract

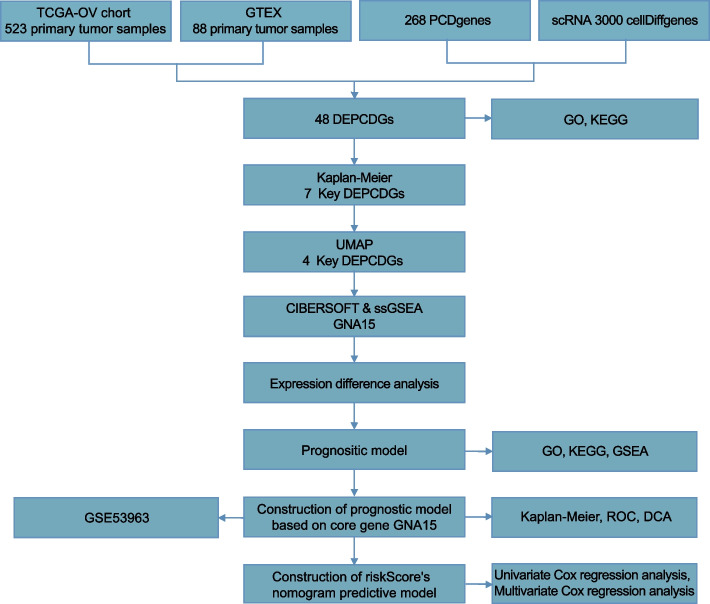
Purpose: This study aims to explore the contribution of differentially expressed programmed cell death genes (DEPCDGs) to the heterogeneity of serous ovarian cancer (SOC) through single-cell RNA sequencing (scRNA-seq) and assess their potential as predictors for clinical prognosis.

Methods: SOC scRNA-seq data were extracted from the Gene Expression Omnibus database, and the principal component analysis was used for cell clustering. Bulk RNA-seq data were employed to analyze SOC-associated immune cell subsets key genes. CIBERSORT and single-sample gene set enrichment analysis (ssGSEA) were utilized to calculate immune cell scores. Prognostic models and nomograms were developed through univariate and multivariate Cox analyses.

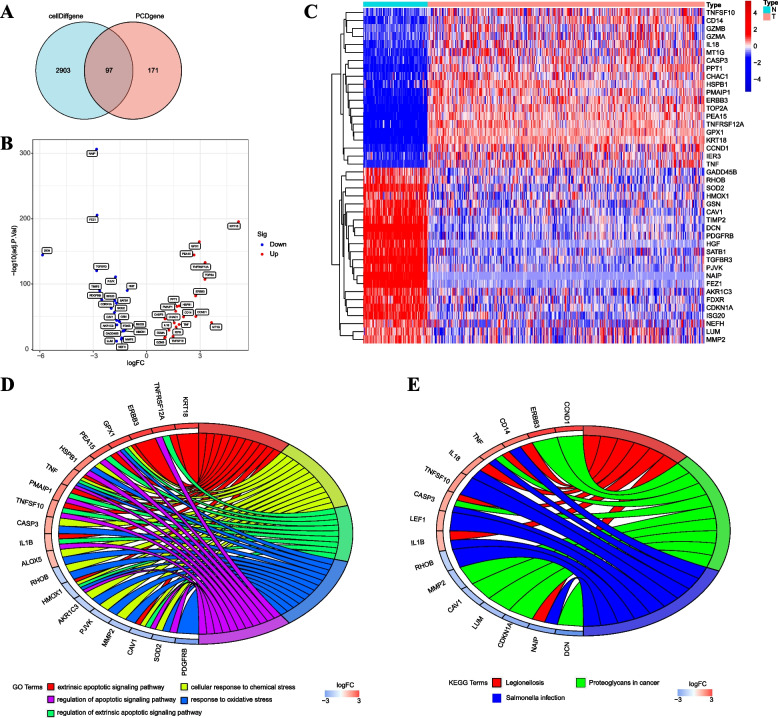
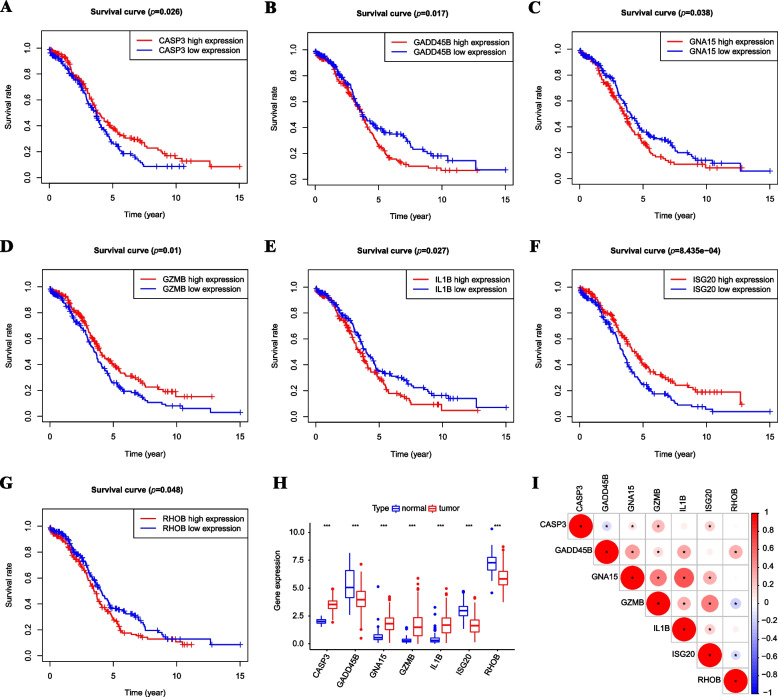
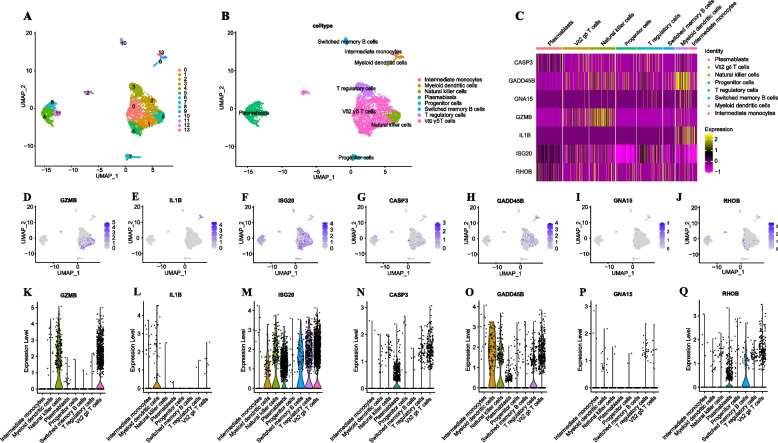
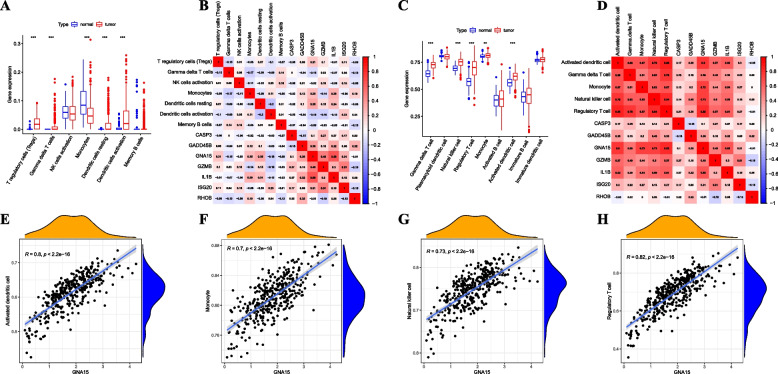
Results: Our analysis revealed that 48 DEPCDGs are significantly correlated with apoptotic signaling and oxidative stress pathways and identified seven key DEPCDGs (CASP3, GADD45B, GNA15, GZMB, IL1B, ISG20, and RHOB) through survival analysis. Furthermore, eight distinct cell subtypes were characterized using scRNA-seq. It was found that G protein subunit alpha 15 (GNA15) exhibited low expression across these subtypes and a strong association with immune cells. Based on the DEGs identified by the GNA15 high- and low-expression groups, a prognostic model comprising eight genes with significant prognostic value was constructed, effectively predicting patient overall survival. Additionally, a nomogram incorporating the RS signature, age, grade, and stage was developed and validated using two large SOC datasets.

Conclusion: GNA15 emerged as an independent and excellent prognostic marker for SOC patients. This study provides valuable insights into the prognostic potential of DEPCDGs in SOC, presenting new avenues for personalized treatment strategies.

Keywords: Clinical prediction; Ovarian cancer; Overall survival; Precision medicine; Serous ovarian cancer; Single-cell RNA sequencing.


Conflict of interest statement

The authors declare no competing interests.

Figures

Fig. 1
Fig. 1
Flow chart for the comprehensive analysis of DEPCDGs. DEPCDGs, differentially expressed programmed cell death genes
Fig. 2
Fig. 2
Identification and pathway enrichment analysis of DEPCDGs. A Venn diagram displaying the overlap genes between cell Diff genes and PCD genes (3,000 PCD genes shown in red, 268 cellDiffgenes shown in blue, and 97 PCD-related cellDiffgenes overlap between both sets). B The volcano plot of DEPCDGs in combined datasets. C Clustered heatmap of DEPCDGs in combined datasets. D GO enrichment analysis of DEPCDGs (FDR < 0.05). E KEGG enrichment analysis of DEPCDGs (FDR < 0.05). Blue represents the normal group; orange represents the tumor group. DEPCDGs, differentially expressed programmed cell death genes; PCD, programmed cell death; GO, Gene Ontology; KEGG, Kyoto Encyclopedia of Genes and Genomes; FDR, false discovery rate
Fig. 3
Fig. 3
Identification of key DEPCDGs based on survival analysis. A-G Kaplan–Meier survival curves of seven key DEPCDGs in TCGA-OV: CASP3 (A), GADD45B (B), GNA15 (C), GZMB (D), IL1B (E), ISG20 (F), RHOB (G). H Group comparison boxplot of seven key DEPCDGs. I Correlational analysis of seven key DEPCDGs. Red represents positive correlation, blue represents negative correlation. *, p < 0.05; **, p < 0.01; ***, p < 0.001; DEPCDGs, differentially expressed programmed cell death genes; TCGA-OV, The Cancer Genome Atlas—Ovarian Cancer; CASP3, the third comparative assessment of techniques of protein structure prediction; GADD45B, growth arrest and DNA-damage-inducible protein 45 beta; GNA15, G protein subunit alpha 15; GZMB, Granzyme B, IL1B, cytokine interleukin-1β; ISG20, Interferon-stimulated gene 20; RHOB, RhoB
Fig. 4
Fig. 4
Expression of key DEPCDGs on scRNA-seq data. A UMAP plot of 13 cell clusters with similar gene expression profiles. B UMAP plot of eight cell subtypes. C Heatmap of key DEPCDGs’ expression level in eight cell subtypes. D-J UMAP plots of key DEPCDGs’ expression level in eight cell subtypes. GZMB (D), IL1B (E), ISG20 (F), CASP3 (G), GADD45B (H), GNA15 (I), RHOB (J). K-Q Violin diagrams of key DEPCDGs’ expression level in eight cell subtypes. GZMB (K), IL1B (L), ISG20 (M), CASP3 (N), GADD45B (O), GNA15 (P), RHOB (Q). Red represents low expression; yellow represents high expression. DEPCDGs, differentially expressed programmed cell death genes; UMAP, uniform manifold approximation and projection; CASP3, the third comparative assessment of techniques of protein structure prediction; GADD45B, growth arrest and DNA-damage-inducible protein 45 beta; GNA15, G protein subunit alpha 15; GZMB, Granzyme B, IL1B, cytokine interleukin-1β; ISG20, Interferon-stimulated gene 20; RHOB, RhoB
Fig. 5
Fig. 5
Immune infiltration analysis in combined datasets. A Group comparison chart of immune cell infiltration analysis in combined datasets by the CIBERSOFT method. B Heatmap of the relationship between key DEPCDGs and specific immune cell subtypes calculated by the CIBERSOFT method. C Group comparison chart of immune cell infiltration analysis in combined datasets by the ssGSEA method. D Heatmap of the relationship between key DEPCDGs and specific immune cell subtypes by the ssGSEA method. E–H Correlation analysis between GNA15 and specific immune cell subtypes (activated dendritic cell (E), monocyte (F), NK cell (G), Tregs (H)). Red represents the tumor group; blue represents the normal group. *, p < 0.05; **, p < 0.01; ***, p < 0.001; DEPCDGs, differentially expressed programmed cell death genes; ssGSEA, single-sample gene set enrichment analysis; GNA15, G protein subunit alpha 15
Fig. 6
Fig. 6
Single-gene bioinformatic analysis of GNA15. A Volcano plot of DEGs in high and low GNA15 expression groups in TCGA-OV. B GO enrichment analysis of DEGs n high and low GNA15 expression groups in TCGA-OV. c KEGG enrichment analysis of DEGs n high and low GNA15 expression groups in TCGA-OV. D-F GSEA analysis of high GNA15 expression group. B cell receptor signal transduction (D), T cell receptor signaling pathway (E), TOLL-like receptor signaling pathway (F). G-I GSEA analysis of low GNA15 expression group. RNA polymerase (G), spliceosome (H), ribosome (I). GNA15, G protein subunit alpha 15; DEGs, differentially expressed genes; TCGA-OV, The Cancer Genome Atlas—Ovarian Cancer; KEGG, Kyoto Encyclopedia of Genes and Genomes; GSEA, gene set enrichment analysis
Fig. 7
Fig. 7
Construction evaluation of a predictive model based on GNA15. A Univariate Cox regression analysis of DEGs in the TCGA-OV dataset. B Multivariate Cox regression analysis of DEGs in the TCGA-OV dataset. C The K-M survival curve analysis of prognostic models in the TCGA-OV dataset (p < 0.001). D Distribution of SOC patients with different RS in the TCGA-OV dataset. E Survival status analysis of SOC patients with different RS in TCGA-OV dataset. F timeROC analysis of 1-, 3- and 5-year in the TCGA-OV dataset. G The K-M survival curve analysis of the prognostic model in the GSE63885 dataset (p < 0.05). H Distribution of patients with various RS in the GSE63885 dataset. I Survival status analysis of patients with various RS in the GSE63885 dataset. J DCA curve of the RS’ prediction power in the TCGA-OV dataset. Red represents the high-risk group; blue represents the low-risk group. GNA15, G protein subunit alpha 15; DEGs, differentially expressed genes; TCGA-OV, The Cancer Genome Atlas—Ovarian Cancer; SOC, serous ovarian cancer; K-M, Kaplan–Meier; ROC, receiver operator characteristic; DCA, decision curve analysis
Fig. 8
Fig. 8
Construction of a nomogram prediction model based on RS. A Univariate Cox regression analysis of RS and clinical features in the TCGA-OV dataset. B Multivariate Cox regression analysis of RS and clinical features in the TCGA-OV dataset. C Nomogram prediction model included stage, grade, age, and RS. D Calibration curve of the nomogram’s prognostic prediction. E ROC curve of the nomogram’s prognostic prediction. RS, risk score; TCGA-OV, The Cancer Genome Atlas—Ovarian Cancer; ROC, receiver operator characteristic

Similar articles

Cited by

References

    1. Siegel RL, Miller KD, Fuchs HE, Jemal A. Cancer statistics, 2022. CA Cancer J Clin. 2022;72(1):7–33. doi: 10.3322/caac.21708. - DOI - PubMed
    1. Siegel RL, Miller KD, Wagle NS, Jemal A. Cancer statistics, 2023. CA Cancer J Clin. 2023;73(1):17–48. doi: 10.3322/caac.21763. - DOI - PubMed
    1. Kobayashi Y, Banno K, Aoki D. Current status and future directions of ovarian cancer prognostic models. J Gynecol Oncol. 2021;32(2):e34. doi: 10.3802/jgo.2021.32.e34. - DOI - PMC - PubMed
    1. Peng F, Liao M, Qin R, Zhu S, Peng C, Fu L, et al. Regulated cell death (RCD) in cancer: key pathways and targeted therapies. Signal Transduct Target Ther. 2022;7(1):286. doi: 10.1038/s41392-022-01110-y. - DOI - PMC - PubMed
    1. Su Z, Yang Z, Xu Y, Chen Y, Yu Q. Apoptosis, autophagy, necroptosis, and cancer metastasis. Mol Cancer. 2015;14:1–14. doi: 10.1186/s12943-015-0321-5. - DOI - PMC - PubMed

Substances