. 2024 Apr 29;43(1):127.
doi: 10.1186/s13046-024-03045-4.

The TP53-activated E3 ligase RNF144B is a tumour suppressor that prevents genomic instability

Affiliations

The TP53-activated E3 ligase RNF144B is a tumour suppressor that prevents genomic instability

Etna Abad et al. J Exp Clin Cancer Res. .

Abstract

Background: TP53, the most frequently mutated gene in human cancers, orchestrates a complex transcriptional program crucial for cancer prevention. While certain TP53-dependent genes have been extensively studied, others, like the recently identified RNF144B, remained poorly understood. This E3 ubiquitin ligase has shown potent tumor suppressor activity in murine Eμ Myc-driven lymphoma, emphasizing its significance in the TP53 network. However, little is known about its targets and its role in cancer development, requiring further exploration. In this work, we investigate RNF144B's impact on tumor suppression beyond the hematopoietic compartment in human cancers.

Methods: Employing TP53 wild-type cells, we generated models lacking RNF144B in both non-transformed and cancerous cells of human and mouse origin. By using proteomics, transcriptomics, and functional analysis, we assessed RNF144B's impact in cellular proliferation and transformation. Through in vitro and in vivo experiments, we explored proliferation, DNA repair, cell cycle control, mitotic progression, and treatment resistance. Findings were contrasted with clinical datasets and bioinformatics analysis.

Results: Our research underscores RNF144B's pivotal role as a tumor suppressor, particularly in lung adenocarcinoma. In both human and mouse oncogene-expressing cells, RNF144B deficiency heightened cellular proliferation and transformation. Proteomic and transcriptomic analysis revealed RNF144B's novel function in mediating protein degradation associated with cell cycle progression, DNA damage response and genomic stability. RNF144B deficiency induced chromosomal instability, mitotic defects, and correlated with elevated aneuploidy and worse prognosis in human tumors. Furthermore, RNF144B-deficient lung adenocarcinoma cells exhibited resistance to cell cycle inhibitors that induce chromosomal instability.

Conclusions: Supported by clinical data, our study suggests that RNF144B plays a pivotal role in maintaining genomic stability during tumor suppression.

Keywords: Aneuploidy; Cancer; Genomic instability; Tumor suppressor.


Conflict of interest statement

The authors declare that they have no conflict of interest.

Figures
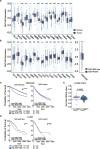
Fig. 1
Fig. 1
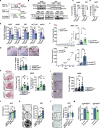
RNF144B is regulated by TP53 in different contexts. A Normalised RNF144B mRNA expression in healthy (light blue) and primary tumour (dark blue) samples across 15 different cancer types from GTEx and TCGA datasets. In bold, tumour types where RNF144B expression is significantly reduced in tumour compared to normal tissue: colon (COAD), head and neck (HNSC), kidney (KICH), brain (LGG), liver (LIHC), lung (LUAD and LUSC) and soft tissue (SARC) cancers. ****P ≤ 0.0001; **P ≤ 0.01; *P ≤ 0.05, p -values, two-tailed t-test. B Normalised RNF144B expression in TP53-proficient (light blue) and TP53-deficient (dark blue) tumour samples across 15 different cancer types and Pancancer analysis from GDC-TCGA Pancancer dataset. ****P ≤ 0.0001, ***P ≤ 0.01, p-values, two-tailed t-test. C and D Probability of ten-year overall survival of cancer patients in human TCGA (C) Pan-Cancer or (D) LUAD samples with TP53 wild-type or TP53 mutant status and RNF144B low (below the median) or high expression (above the median). ****P ≤ 0.0001; **P ≤ 0.01; *P ≤ 0.05, p-values, log-rank test. E Project Achilles lung cancer cell lines from CCLE dataset were segregated by TP53 status (wild-type or mutant) and plotted by CERES effect upon RNF144B depletion. P-value, two-tailed t-test
Fig. 2
Fig. 2
RNF144B suppresses oncogene expressing cell proliferation and transformation. A Schematic representation showing the generation of non-transformed (immortalised) MEFs and human bronchial epithelial cells (3KT), and tumour derived human A549 LUAD cells with three different variants: TP53 WT, TP53 deficient and RNF144B deficient. B Western blot analysis of A549, 3KT and MEFs cell line derivatives showing TP53 expression upon 6 h of treatment with MDM2 inhibitor, nutlin-3a (10 μM) or after 6h and 24h of treatment with doxorubicin (0.2 μg/ml), activators of TP53. Note that TP53 is expressed at low levels in non-treated TP53WT control and treated TP53KO or TP53KD cell line derivatives, respectively. Probing for β-ACTIN was used as a loading control. C Human GFP-NLS tagged A549 and 3KT cell lines derivatives with two different TP53 states, wild type or deficient, were treated with Nutlin-3a (10 μM) for 72 h. Cell viability was measured by measuring nuclear GFP signal of images acquired with the Operetta High Content Screening System in confocal mode. GFP quantification was normalised to the respective untreated control. Data are presented as Mean ± SEM. for a minimum of 1300 cells. N = 3 or 4 independent experiments. P-values, ***P < 0.001; two-tailed student’s t-test. D The TP53 WT or deficient MEFs were treated with Nutlin-3a (10 μM) for 24 h. Cell viability was measured by staining cells with Annexin V plus DAPI followed by flow cytometric analysis. Annexin V- DAPI- cells were regarded as live cells. Data are presented as Mean ± SEM. N = 3 independent experiments P-value *P ≤ 0.05, two-tailed t-test. E qRT-PCR analysis of RNF144B mRNA expression in TP53 proficient and TP53 deficient MEFs, A549, 3KT, HCT116 and mKLC cells upon 6 h treatment with Nutlin-3a relative to untreated cells of the same genotype. N = 3–4 independent experiments for each cell line and cell variant, in duplicates. Data are presented as Mean ± SEM, P-values ***P ≤ 0.001; *P ≤ 0.05, two-tailed unpaired t-test. F MEF 1.04 cell line that has been transduced with indicated shRNAs were injected subcutaneously into nude mice and tumor volume was measured over 20 days. (Left) Tumour volume (mm3) of the same genotype (Right) Tumour weight at ethical endpoint. N = 9–10 tumours/shRNA from one MEFs cell line (1.04). Data are presented as Mean ± SEM. ****P ≤ 0.0001; ***P ≤ 0.001; *P ≤ 0.05. p-values, two-way or one-way ANOVA, respectively. G H&E staining and immunohistochemistry of pH3 at ethical endpoint, in particular at 15 days for shTRP53 and 24 days for shCTRL and shRNF144B MEF tumours. (Above) Representative images. Scale bar = 50 μm. (Below) Quantification of pH3 + cells. N = 5–6 tumours/shRNA. Total of 40 fields/shRNA were quantified. Data are presented as Mean ± SEM, **P ≤ 0.01, one-way ANOVA. H H&E-stained lung sections from mice 6 weeks after inoculation with A549 LUAD cells that have been transduced with indicated sgRNAs. (Left) Representative images. Scale bar = 800 μm. (Middle) Quantification of tumour area. (Right) Quantification of tumour area (%) relative to lung area. N = 7–8 tumours/sgRNA. Data are presented as Mean ± SEM. **P ≤ 0.01; *P ≤ 0.05; one-way ANOVA. I H&E staining and immunohistochemistry of Ki67 detected in mice 6 weeks after intrapulmonary injection with A549 LUAD cells that have been transduced with indicated sgRNAs. (Left) Representative images. Scale bar 130 μm. (Right) Quantification of Ki67 + cells. Total of 20–55 fields/sgRNA were quantified. N = 7–8 tumours/sgRNA. Data are presented as Mean ± SEM. **P ≤ 0.001, one-way ANOVA. J Cellular proliferation assay in 3KT cells transduced with indicated sgRNAs over 6 days. N = 5 independent experiments for each cell variant, in triplicates. Data are presented as Mean ± SEM, P-value **P ≤ 0.01; *P ≤ 0.05, one-way ANOVA. K Low-density plating assay in 3KT cells transduced with indicated sgRNAs over 8 days after seeding. (Left) Representative images after crystal violet staining. (Right) Quantification of the crystal violet intensity. N = 4 independent experiments for each cell variant, in triplicates. Mean ± SEM, P-value **P ≤ 0.01, one-way ANOVA. L Matrigel-embedded spheroids derived from 3KT cells transduced with indicated sgRNAs over 7 days. (Left) Representative images. (Right) Quantification of spheroid diameter. 400–700 spheroids/sgRNA were quantified, N = 2 independent experiments for each cell variant, in triplicates. Mean ± SEM. ****P ≤ 0.0001, *P ≤ 0.05, one-way ANOVA. M Cellular proliferation assay in TP53 deficient A549 or 3KT cells transduced with overexpression (OE) vectors, empty (CTRL) or expressing full-length Rnf144b. Bar graph represents the cell number relative to the CTRL, respectively. N = 3 independent experiments for each cell variant, in triplicates. Mean ± SEM. **P ≤ 0.01, two-tailed unpaired t-test
Fig. 3
Fig. 3
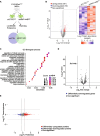
Cellular proteome is altered upon RNF144B knockdown. A Schematic representation of LC–MS/MS proteomics and RNA-Seq experiment. B (Left) Volcano plot of shRNF144BMEF compared to shCTRLMEF proteins. Red proteins are significantly increased in abundance, and blue are significantly reduced. In gray, not significant. (Right) Heatmap of differentially abundant proteins in shRNF144BMEF and shCTRLMEF.C GO biological processes associated with significantly altered proteins in shRNF144BMEF versus shCTRLMEF. D Volcano plot of RNA-Seq transcriptomics analysis of shRNF144BMEF compared to shCTRLMEF. In blue, Rnf144b transcript was significantly reduced as expected. In gray, not significant transcripts. E Integrative representation of transcriptomics and proteomics analysis of shRNF144BMEF versus shCTRLMEF. Red proteins are enriched in the proteomic datasets, blue are depleted in the proteomic dataset and not significantly altered at the transcriptome level. In gray, non-significant changes at proteomics or transcriptomic level. N = 3 replicas/shRNA
Fig. 4
Fig. 4
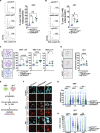
RNF144B deficiency leads to aneuploidy and increased DNA damage susceptibility. DNA content measured by propidium iodide flow cytometry analysis in (A) MEF 1.04 and (B) 3KT cell lines transduced with indicated shRNAs or sgRNAs, respectively. (Left) Representative histogram profiles. (Right) DNA content quantification for profiling more than 4N (aneuploid) cells (> G2). N = 3 independent biological replicates per cell line derivative. C (Left) Representative metaphase spreads from MEFs transduced with indicated shRNAs. (Right) Quantification of chromosome number per cell from metaphase spreads. N = 3 cell lines/shRNAs. Minimum of 25 cells were analyzed per cell line/shRNA. D Metaphase spreads from 3KT transduced with indicated sgRNAs. (Left) Representative pictures. (Right) Quantification of chromosomes per cell. Minimum of 45 cells were analyzed per cell line/sgRNA. E Schematic representation of MEFs and 3KT cells irradiated, fixed at different timepoints (0 h, 1 h and 24 h) and images taken at 40X magnification. F Representative pictures of γH2AX foci in MEF 1.04 cell line transduced with different shRNAs, in different timepoints after IR. DAPI marks nuclei. Scale bar: 20 μm (G) Quantification of γH2AX foci per cell in MEF 1.04 cell line with N = 570–1300 cells analysed per shRNA/timepoint in two independent experiments. H Quantification of γH2AX foci per cell in 3KT cell line with N = 2274–5105 cells analysed per shRNA/timepoint in two independent experiments. Data are presented as Mean ± SEM. ****P ≤ 0.0001; **P ≤ 0.01, *P ≤ 0.05, one-way ANOVA
Fig. 5
Fig. 5
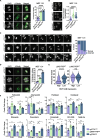
RNF144B deficiency triggers chromosomal instability during mitosis. A Mitotic analysis. (Left) Representative anaphase images of α-tubulin and DAPI staining in MEF 1.01 cell line transduced with indicated shRNAs. Arrows show lagging chromosomes. Scale bar: 10 μm. (Right) Quantification of aberrant mitosis containing lagging chromosomes or DNA bridges. At least 800 mitoses (the same proportion of the different phases of mitosis) per cell line were analyzed in two independent experiments; in duplicates, each dot represents a replicate. Data presented as mean ± SEM ****P ≤ 0.0001, one-way ANOVA. B Micronucleus count by DAPI staining in MEF 1.01 cell line transduced with indicated shRNAs. (Left) Representative images of micronuclei. Arrows show micronuclei. Scale bar: 10 μm. (Right) Quantification of micronuclei. At least 45 fields were analyzed per condition in two independent experiments, each dot represents a field. Data presented as mean ± SEM ****P ≤ 0.0001, one-way ANOVA. C (Right) Live-cell time-lapse representative pictures of MEF 1.01 cell line after release from 15 μM RO-3306-induced G2 arrest. transduced with indicated shRNAs, stained with siR-Hoechst (not all pictures are represented here). White arrows show mitotic aberrations, like lagging chromosomes or micronuclei appearing post mitosis. (Left) Quantification of aberrant mitosis. N = 17–38 mitosis/shRNA were quantified for analysis. D Mitotic pole analysis of MEF 1.01 cell line transduced with indicated shRNAs, uponrelease from 15 μM RO-3306-induced G2 arrest. (Left) Representative images of α-tubulin and DAPI staining. Scale bar: 10 μm (Right) Quantification of multipolar mitosis. At least 400 mitoses/shRNA were analyzed in two independent experiments, in duplicates, each dot represents a replicate. Data presented as mean ± SEM ****P ≤ 0.0001; ***P ≤ 0.001, one-way ANOVA. E Violin plot of the tumour aneuploidy scores in high versus low RNF144B mRNA expression in LUAD cohort, separated by TP53 status. ****P ≤ 0.0001, two-tailed t-test. F In vitro growth of GFP-NLS tagged A549 LUAD cells transduced with indicated sgRNAs and treated for 72 h with a panel of cytotoxic drugs: Palbociclib (1 μM, 3 μM), Abemaciclib (0,5 μM, 3 μM), Paclitaxel (10 nM, 20 nM), Docetaxel (5 nM, 20 nM), Etoposide (10 μM, 20 μM), Doxorubicin (0,05 μg/ml, 0,2 μg/ml), Carboplatin (50 μM, 100 μM), RO-3306 (5 μM) and Nutlin-3a (20 μM). Cell growth was measured by measuring nuclear GFP signal of images acquired with the Operetta High Content Screening System in confocal mode. Cell growth was normalized to day 0 of the same well/genotype. At least 1000 cells/well were analysed in 3–5 independent experiments, in duplicates. **P ≤ 0.01; *P ≤ 0.05, paired t-test student

References

    1. Cheok CF, Verma CS, Baselga J, Lane DP. Translating p53 into the clinic. Nat Rev Clin Oncol. 2011;8. 10.1038/nrclinonc.2010.174. - PubMed
    1. Kandoth C, McLellan MD, Vandin F, Ye K, Niu B, Lu C, et al. Mutational landscape and significance across 12 major cancer types. Nature. 2013;502(7471):333–9. doi: 10.1038/nature12634. - DOI - PMC - PubMed
    1. McBride KA, Ballinger ML, Killick E, Kirk J, Tattersall MHN, Eeles RA, et al. Li-Fraumeni syndrome: Cancer risk assessment and clinical management. Nat Rev Clin Oncol. 2014;11. 10.1038/nrclinonc.2014.41. - PubMed
    1. Schneider K, Zelley K, Nichols KE, Garber J. Li-Fraumeni Syndrome. 1999. 2019. - PubMed
    1. Donehower LA, Harvey M, Slagle BL, McArthur MJ, Montgomery CA, Butel JS, et al. Mice deficient for p53 are developmentally normal but susceptible to spontaneous tumours. Nature. 1992;356:215–221. doi: 10.1038/356215a0. - DOI - PubMed