

Comprehensive multi-omics analysis of resectable locally advanced gastric cancer: Assessing response to neoadjuvant camrelizumab and chemotherapy in a single-center, open-label, single-arm phase II trial
- PMID: 38685486
- PMCID: PMC11058238
- DOI: 10.1002/ctm2.1674
Comprehensive multi-omics analysis of resectable locally advanced gastric cancer: Assessing response to neoadjuvant camrelizumab and chemotherapy in a single-center, open-label, single-arm phase II trial
Abstract
Background: The current standard of care for locally advanced gastric cancer (GC) involves neoadjuvant chemotherapy followed by radical surgery. Recently, neoadjuvant treatment for this condition has involved the exploration of immunotherapy plus chemotherapy as a potential approach. However, the efficacy remains uncertain.
Methods: A single-arm, phase 2 study was conducted to evaluate the efficacy and tolerability of neoadjuvant camrelizumab combined with mFOLFOX6 and identify potential biomarkers of response through multi-omics analysis in patients with resectable locally advanced GC. The primary endpoint was the pathological complete response (pCR) rate. Secondary endpoints included the R0 rate, near pCR rate, progression-free survival (PFS), disease-free survival (DFS), and overall survival (OS). Multi-omics analysis was assessed by whole-exome sequencing, transcriptome sequencing, and multiplex immunofluorescence (mIF) using biopsies pre- and post-neoadjuvant therapy.
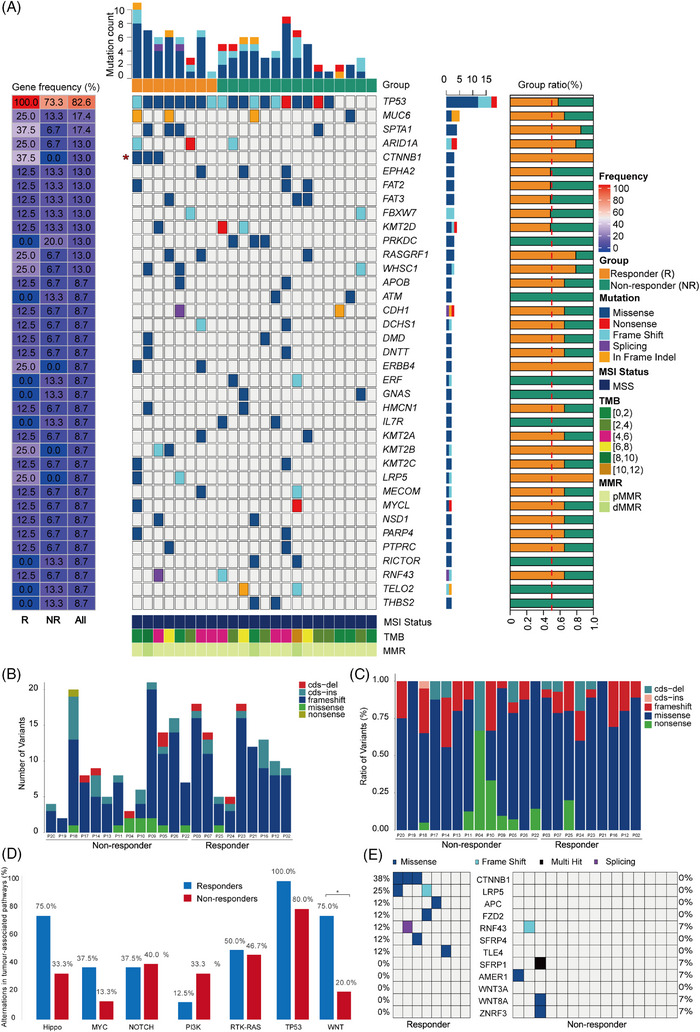
Results: This study involved 60 patients, of which 55 underwent gastrectomy. Among these, five (9.1%) attained a pathological complete response (pCR), and 11 (20.0%) reached near pCR. No unexpected treatment-emergent adverse events or perioperative mortality were observed, and the regimen presented a manageable safety profile. Molecular changes identified through multi-omics analysis correlated with treatment response, highlighting associations between HER2-positive and CTNNB1 mutations with treatment sensitivity and a favourable prognosis. This finding was further supported by immune cell infiltration analysis and mIF. Expression data uncovered a risk model with four genes (RALYL, SCGN, CCKBR, NTS) linked to poor response. Additionally, post-treatment infiltration of CD8+ T lymphocytes positively correlates with pathological response.
Conclusion: The findings suggest the combination of PD-1-inhibitor and mFOLFOX6 showed efficacy and acceptable toxicity for locally advanced GC. Extended follow-up is required to determine the duration of the response. This study lays essential groundwork for developing precise neoadjuvant regimens.
Trial registration: ClinicalTrials.gov NCT03939962.
Keywords: PD‐1 inhibitor; chemotherapy; gastric cancer; molecular markers; neoadjuvant therapies.
© 2024 The Authors. Clinical and Translational Medicine published by John Wiley & Sons Australia, Ltd on behalf of Shanghai Institute of Clinical Bioinformatics.
Conflict of interest statement
Zhentian Liu and Xuan Gao were employees of Geneplus. Jinwang Wei was an employee of GenomiCare Biotechnology LA Co., Ltd.(Shanghai). Zhiguo Hou, Chenxuan Liu, Rongrong Zheng and Du Wang were employees of Jiangsu Hengrui Pharmaceuticals. The remaining authors declare no conflict of interest.
Figures


References
-
- Sung H, Ferlay J, Siegel RL, et al. Global cancer statistics 2020: gLOBOCAN estimates of incidence and mortality worldwide for 36 cancers in 185 countries. CA Cancer J Clin. 2021;71(3):209‐249. - PubMed
-
- Cunningham D, Allum WH, Stenning SP, et al. Perioperative chemotherapy versus surgery alone for resectable gastroesophageal cancer. N Engl J Med. 2006;355(1):11‐20. - PubMed
-
- Ychou M, Boige V, Pignon J‐P, et al. Perioperative chemotherapy compared with surgery alone for resectable gastroesophageal adenocarcinoma: an FNCLCC and FFCD multicenter phase III trial. J Clin Oncol. 2011;29(13):1715‐1721. - PubMed
-
- Zhang X, Liang H, Li Z, et al. Perioperative or postoperative adjuvant oxaliplatin with S‐1 versus adjuvant oxaliplatin with capecitabine in patients with locally advanced gastric or gastro‐oesophageal junction adenocarcinoma undergoing D2 gastrectomy (RESOLVE): an open‐label, superiority and non‐inferiority, phase 3 randomised controlled trial. Lancet Oncol. 2021;22(8):1081‐1092. - PubMed
-
- Al‐Batran S‐E, Homann N, Pauligk C, et al. Perioperative chemotherapy with fluorouracil plus leucovorin, oxaliplatin, and docetaxel versus fluorouracil or capecitabine plus cisplatin and epirubicin for locally advanced, resectable gastric or gastro‐oesophageal junction adenocarcinoma (FLOT4): a randomised, phase 2/3 trial. Lancet North Am Ed. 2019;393(10184):1948‐1957. - PubMed
Publication types
MeSH terms
Substances
Supplementary concepts
Associated data
Grants and funding
LinkOut - more resources
Full Text Sources
Medical
Research Materials
Miscellaneous