

Comparison of assay methods for quantifying sex hormone concentrations across the menstrual cycle in rhesus macaques†
- PMID: 38685627
- PMCID: PMC11327312
- DOI: 10.1093/biolre/ioae063
Comparison of assay methods for quantifying sex hormone concentrations across the menstrual cycle in rhesus macaques†
Abstract
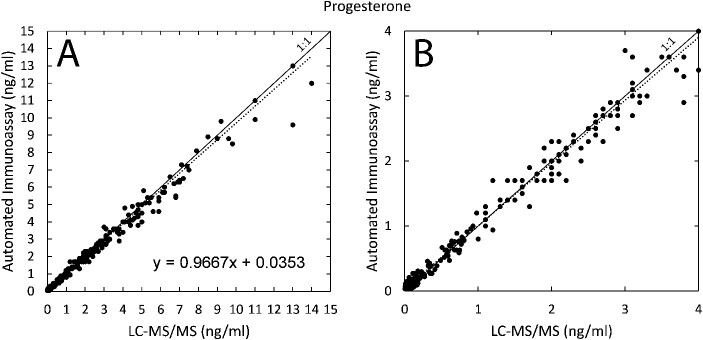
Immunoassays have been the preferred method for steroid hormone analysis for more than 50 years. Automated immunoassays (AIAs) offer high throughput, rapid data turnaround, and low cost for measuring steroid hormone concentrations. The application of liquid chromatography-tandem mass spectrometry (LC-MS/MS) for steroid quantification provides greater specificity and selectivity for individual steroids, the ability to simultaneously analyze multiple steroids, and high throughput and automation. We compared AIA and LC-MS/MS for analysis of 17beta-estradiol (E2) and progesterone (P4) over the course of several menstrual cycles in 12 rhesus macaques (Macaca mulatta). Serum samples were collected every 4 days across four menstrual cycles from each monkey. AIAs were performed on a Roche cobas e411 analyzer. LC-MS/MS analysis was performed on a Shimadzu-Nexera-LCMS-8060 instrument. Scatter plots with Passing-Bablok regression showed excellent agreement between AIA and LC-MS/MS for both E2 and P4. Bland-Altman plots revealed no bias for either method; however, AIA overestimated E2 at concentrations >140 pg/ml and underestimated P4 at concentrations >4 ng/ml compared to LC-MS/MS. A comparison of testosterone concentrations measured by AIA and LC-MS/MS in the same samples was also performed. In contrast to E2 and P4, AIA and LC-MS/MS yielded significantly different results for testosterone concentrations, with AIA consistently underestimating concentrations relative to those obtained by LC-MS/MS. Well-characterized automated immunoassays are an excellent tool for daily monitoring of monkey menstrual cycles or providing single data points requiring fast turnaround. In certain situations where AIAs may provide inaccurate estimations of E2 and P4 concentrations, LC-MS/MS assays are preferable.
Keywords: LC-MS/MS; immunoassay; menstrual cycle; nonhuman primate; steroid hormone.
© The Author(s) 2024. Published by Oxford University Press on behalf of Society for the Study of Reproduction. All rights reserved. For permissions, please e-mail: journals.permissions@oup.com.
Figures


References
-
- Resko JA, Ellinwood WE, Pasztor LM, Huhl AE. Sex steroids in the umbilical circulation of fetal rhesus monkeys from the time of gonadal differentiation. J Clin Endocrinol Metab 1980; 50:900–905. - PubMed
-
- Resko JA, Pleom JG, Stadelman HL. Estrogens in fetal and maternal plasma of the rhesus monkey. Endocrinology 1975; 97:425–430. - PubMed
-
- Rasmussen LE, Buss IO, Hess DL, Schmidt MJ. Testosterone and dihydrotestosterone concentrations in elephant serum and temporal gland secretions. Biol Reprod 1984; 30:352–362. - PubMed
-
- Handelsman DJ, Wartofsky L. Requirement for mass spectrometry sex steroid assays in the journal of clinical endocrinology and metabolism. J Clin Endocrinol Metab 2013; 98:3971–3973. - PubMed
Publication types
MeSH terms
Substances
Grants and funding
LinkOut - more resources
Full Text Sources
