

The Spartina alterniflora genome sequence provides insights into the salt-tolerance mechanisms of exo-recretohalophytes
- PMID: 38685729
- PMCID: PMC11331799
- DOI: 10.1111/pbi.14368
The Spartina alterniflora genome sequence provides insights into the salt-tolerance mechanisms of exo-recretohalophytes
Abstract
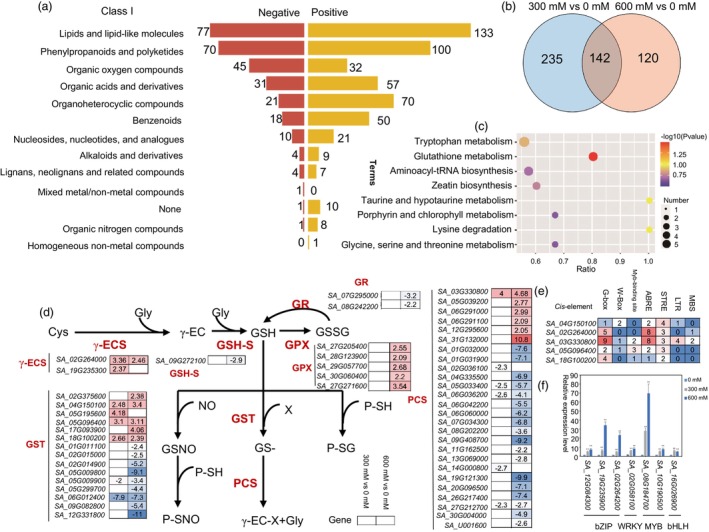
Spartina alterniflora is an exo-recretohalophyte Poaceae species that is able to grow well in seashore, but the genomic basis underlying its adaptation to salt tolerance remains unknown. Here, we report a high-quality, chromosome-level genome assembly of S. alterniflora constructed through PacBio HiFi sequencing, combined with high-throughput chromosome conformation capture (Hi-C) technology and Illumina-based transcriptomic analyses. The final 1.58 Gb genome assembly has a contig N50 size of 46.74 Mb. Phylogenetic analysis suggests that S. alterniflora diverged from Zoysia japonica approximately 21.72 million years ago (MYA). Moreover, whole-genome duplication (WGD) events in S. alterniflora appear to have expanded gene families and transcription factors relevant to salt tolerance and adaptation to saline environments. Comparative genomics analyses identified numerous species-specific genes, significantly expanded genes and positively selected genes that are enriched for 'ion transport' and 'response to salt stress'. RNA-seq analysis identified several ion transporter genes including the high-affinity K+ transporters (HKTs), SaHKT1;2, SaHKT1;3 and SaHKT1;8, and high copy number of Salt Overly Sensitive (SOS) up-regulated under high salt conditions, and the overexpression of SaHKT2;4 in Arabidopsis thaliana conferred salt tolerance to the plant, suggesting specialized roles for S. alterniflora to adapt to saline environments. Integrated metabolomics and transcriptomics analyses revealed that salt stress activate glutathione metabolism, with differential expressions of several genes such as γ-ECS, GSH-S, GPX, GST and PCS in the glutathione metabolism. This study suggests several adaptive mechanisms that could contribute our understanding of evolutional basis of the halophyte.
Keywords: Spartina alterniflora; evolution; genome; glutathione metabolism; salinity adaptation.
© 2024 The Authors. Plant Biotechnology Journal published by Society for Experimental Biology and The Association of Applied Biologists and John Wiley & Sons Ltd.
Conflict of interest statement
The authors declare no competing interests.
Figures


Similar articles
-
Deep learning-enabled discovery and characterization of HKT genes in Spartina alterniflora.Plant J. 2023 Nov;116(3):690-705. doi: 10.1111/tpj.16397. Epub 2023 Jul 26. Plant J. 2023. PMID: 37494542
-
The Full-Length Transcriptome of Spartina alterniflora Reveals the Complexity of High Salt Tolerance in Monocotyledonous Halophyte.Plant Cell Physiol. 2020 May 1;61(5):882-896. doi: 10.1093/pcp/pcaa013. Plant Cell Physiol. 2020. PMID: 32044993
-
Transcriptome analysis of smooth cordgrass (Spartina alterniflora Loisel), a monocot halophyte, reveals candidate genes involved in its adaptation to salinity.BMC Genomics. 2016 Aug 19;17(1):657. doi: 10.1186/s12864-016-3017-3. BMC Genomics. 2016. PMID: 27542721 Free PMC article.
-
Insights into the Transcriptomics of Crop Wild Relatives to Unravel the Salinity Stress Adaptive Mechanisms.Int J Mol Sci. 2023 Jun 6;24(12):9813. doi: 10.3390/ijms24129813. Int J Mol Sci. 2023. PMID: 37372961 Free PMC article. Review.
-
Engineering salinity tolerance in plants: progress and prospects.Planta. 2020 Mar 9;251(4):76. doi: 10.1007/s00425-020-03366-6. Planta. 2020. PMID: 32152761 Review.
Cited by
-
Hordeum I genome unlocks adaptive evolution and genetic potential for crop improvement.Nat Plants. 2025 Mar;11(3):438-452. doi: 10.1038/s41477-025-01942-w. Epub 2025 Mar 14. Nat Plants. 2025. PMID: 40087544 Free PMC article.
-
Fast-forwarding plant breeding with deep learning-based genomic prediction.J Integr Plant Biol. 2025 Jul;67(7):1700-1705. doi: 10.1111/jipb.13914. Epub 2025 Apr 14. J Integr Plant Biol. 2025. PMID: 40226955 Free PMC article. Review.
-
Unveiling Salt Tolerance Mechanisms in Plants: Integrating the KANMB Machine Learning Model With Metabolomic and Transcriptomic Analysis.Adv Sci (Weinh). 2025 Jun;12(23):e2417560. doi: 10.1002/advs.202417560. Epub 2025 Apr 26. Adv Sci (Weinh). 2025. PMID: 40285579 Free PMC article.
-
De novo, high-quality assembly and annotation of the halophyte grass Aeluropus littoralis draft genome and identification of A20/AN1 zinc finger protein family.BMC Plant Biol. 2025 Apr 29;25(1):556. doi: 10.1186/s12870-025-06610-x. BMC Plant Biol. 2025. PMID: 40295936 Free PMC article.
-
Chromosome-level genome of Zoysia sinica in the intertidal zone reveals genomic insights into waterlogging stress adaptation.Plant Genome. 2025 Sep;18(3):e70070. doi: 10.1002/tpg2.70070. Plant Genome. 2025. PMID: 40629672 Free PMC article.
References
-
- Albaqami, M. , Laluk, K. and Reddy, A.S.N. (2019) The Arabidopsis splicing regulator SR45 confers salt tolerance in a splice isoform‐dependent manner. Plant Mol. Biol. 100, 379–390. - PubMed
-
- Amin, I. , Rasool, S. , Mir, M.A. , Wani, W. , Masoodi, K.Z. and Ahmad, P. (2021) Ion homeostasis for salinity tolerance in plants: a molecular approach. Physiol. Plant. 171, 578–594. - PubMed
-
- Baisakh, N. , RamanaRao, M.V. , Rajasekaran, K. , Subudhi, P. , Janda, J. , Galbraith, D. , Vanier, C. et al. (2012) Enhanced salt stress tolerance of rice plants expressing a vacuolar H+‐ATPase subunit c1 (SaVHAc1) gene from the halophyte grass Spartina alterniflora Löisel. Plant Biotechnol. J. 10, 453–464. - PubMed
MeSH terms
Grants and funding
LinkOut - more resources
Full Text Sources
Research Materials
Miscellaneous
