

Hyperpolarized Carbon-13 Magnetic Resonance Imaging: Technical Considerations and Clinical Applications
- PMID: 38685736
- PMCID: PMC11058429
- DOI: 10.3348/kjr.2024.0069
Hyperpolarized Carbon-13 Magnetic Resonance Imaging: Technical Considerations and Clinical Applications
Abstract
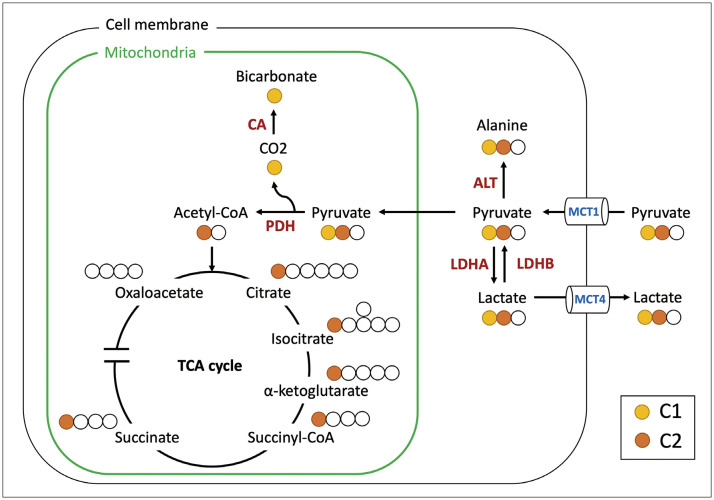
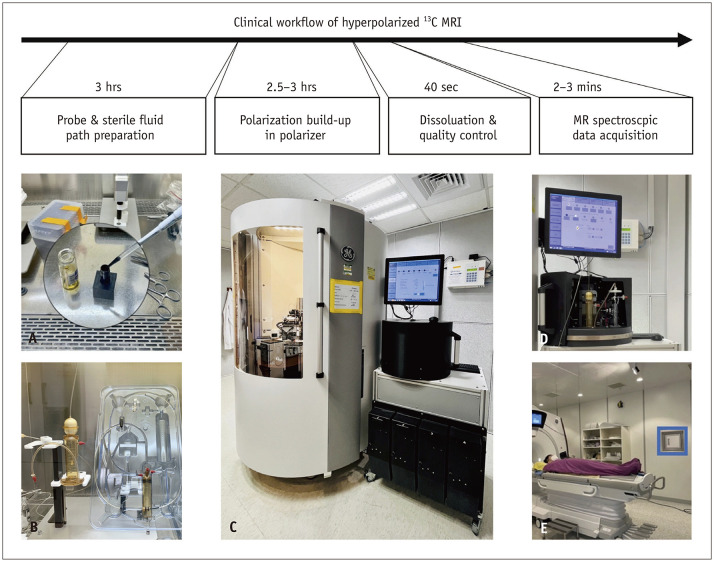
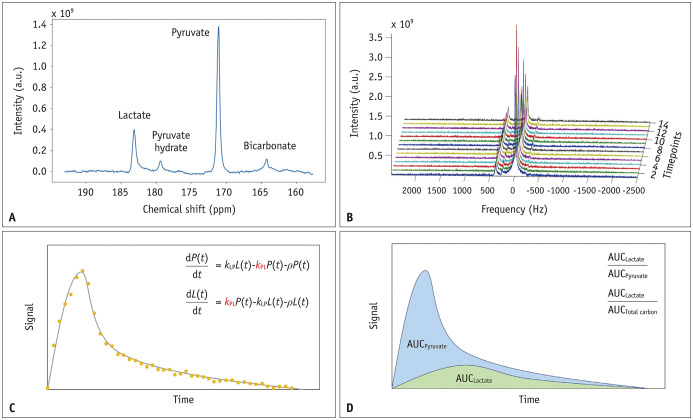
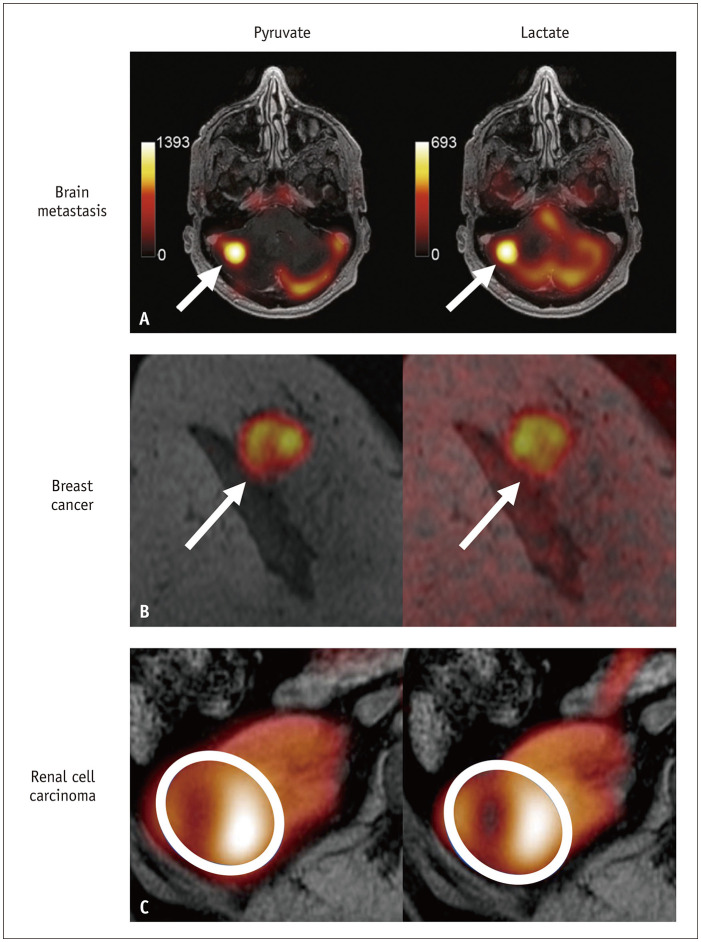
Hyperpolarized (HP) carbon-13 (13C) MRI represents an innovative approach for noninvasive, real-time assessment of dynamic metabolic flux, with potential integration into routine clinical MRI. The use of [1-13C]pyruvate as a probe and its conversion to [1-13C]lactate constitute an extensively explored metabolic pathway. This review comprehensively outlines the establishment of HP 13C-MRI, covering multidisciplinary team collaboration, hardware prerequisites, probe preparation, hyperpolarization techniques, imaging acquisition, and data analysis. This article discusses the clinical applications of HP 13C-MRI across various anatomical domains, including the brain, heart, skeletal muscle, breast, liver, kidney, pancreas, and prostate. Each section highlights the specific applications and findings pertinent to these regions, emphasizing the potential versatility of HP 13C-MRI in diverse clinical contexts. This review serves as a comprehensive update, bridging technical aspects with clinical applications and offering insights into the ongoing advancements in HP 13C-MRI.
Keywords: Carbon 13; Hyperpolarized; Lactate; Magnetic resonance imaging; Pyruvate.
Copyright © 2024 The Korean Society of Radiology.
Conflict of interest statement
The authors have no potential conflicts of interest to disclose.
Figures
Similar articles
-
Hyperpolarized 13C-pyruvate MRI detects real-time metabolic flux in prostate cancer metastases to bone and liver: a clinical feasibility study.Prostate Cancer Prostatic Dis. 2020 Jun;23(2):269-276. doi: 10.1038/s41391-019-0180-z. Epub 2019 Nov 4. Prostate Cancer Prostatic Dis. 2020. PMID: 31685983 Free PMC article.
-
Quantifying normal human brain metabolism using hyperpolarized [1-13C]pyruvate and magnetic resonance imaging.Neuroimage. 2019 Apr 1;189:171-179. doi: 10.1016/j.neuroimage.2019.01.027. Epub 2019 Jan 11. Neuroimage. 2019. PMID: 30639333 Free PMC article.
-
Metabolic Imaging of the Human Brain with Hyperpolarized 13C Pyruvate Demonstrates 13C Lactate Production in Brain Tumor Patients.Cancer Res. 2018 Jul 15;78(14):3755-3760. doi: 10.1158/0008-5472.CAN-18-0221. Epub 2018 May 16. Cancer Res. 2018. PMID: 29769199 Free PMC article.
-
Hyperpolarized MRI - An Update and Future Perspectives.Semin Nucl Med. 2022 May;52(3):374-381. doi: 10.1053/j.semnuclmed.2021.09.001. Epub 2021 Nov 14. Semin Nucl Med. 2022. PMID: 34785033 Review.
-
Current human brain applications and challenges of dynamic hyperpolarized carbon-13 labeled pyruvate MR metabolic imaging.Eur J Nucl Med Mol Imaging. 2021 Dec;48(13):4225-4235. doi: 10.1007/s00259-021-05508-8. Epub 2021 Aug 25. Eur J Nucl Med Mol Imaging. 2021. PMID: 34432118 Free PMC article. Review.
Cited by
-
[Research Progress in Applying Hyperpolarized 13C Labeling Technology in Neurological Metabolic Diagnostics].Sichuan Da Xue Xue Bao Yi Xue Ban. 2024 Nov 20;55(6):1343-1349. doi: 10.12182/20241160101. Sichuan Da Xue Xue Bao Yi Xue Ban. 2024. PMID: 39990827 Free PMC article. Review. Chinese.
References
-
- Gallagher FA, Bohndiek SE, Kettunen MI, Lewis DY, Soloviev D, Brindle KM. Hyperpolarized 13C MRI and PET: in vivo tumor biochemistry. J Nucl Med. 2011;52:1333–1336. - PubMed
Publication types
MeSH terms
Substances
Grants and funding
LinkOut - more resources
Full Text Sources
Medical
Research Materials
Miscellaneous
