. 2024 Apr 15:18:1265966.
doi: 10.3389/fnins.2024.1265966. eCollection 2024.

Monocular reconstruction of shapes of natural objects from orthographic and perspective images

Affiliations

Monocular reconstruction of shapes of natural objects from orthographic and perspective images

Mark Beers et al. Front Neurosci. .

Abstract

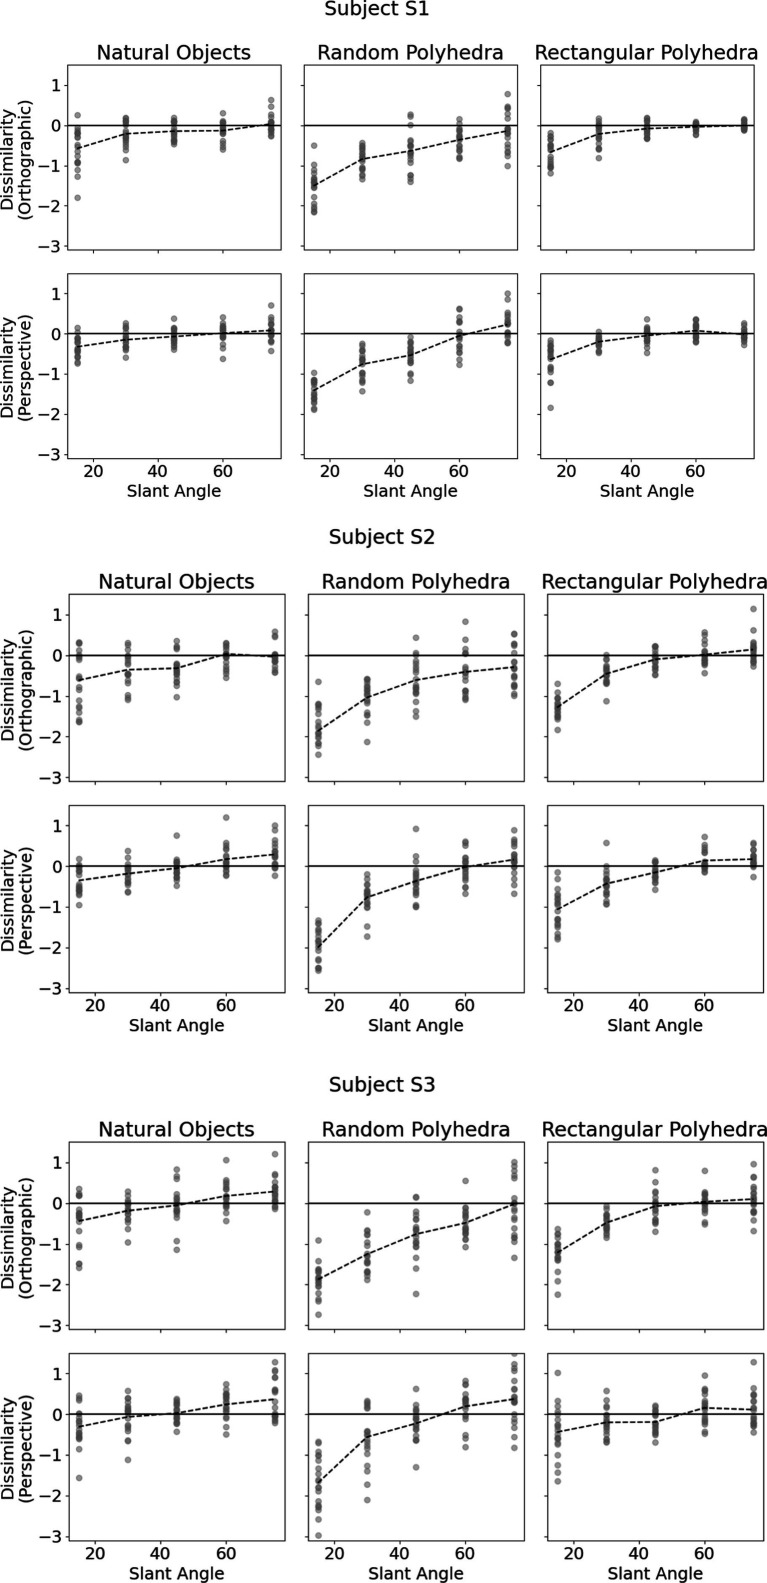
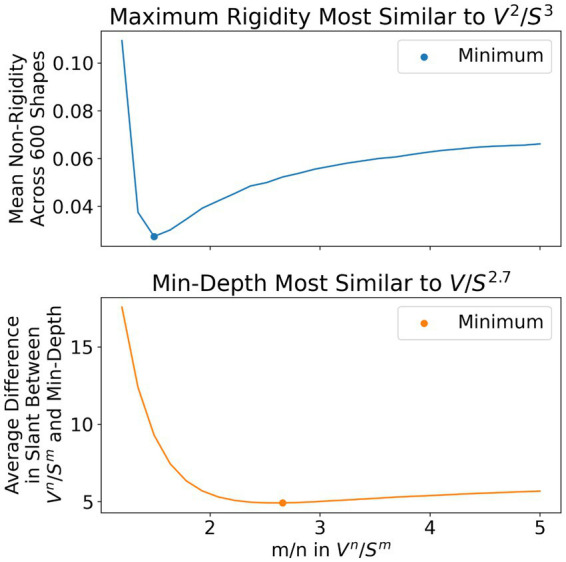
Human subjects were tested in perception of shapes of 3D objects. The subjects reconstructed 3D shapes by viewing orthographic and perspective images. Perception of natural shapes was very close to veridical and was clearly better than perception of random symmetrical polyhedra. Viewing perspective images led to only slightly better performance than viewing orthographic images. In order to account for subjects' performance, we elaborated the previous computational models of 3D shape reconstruction. The previous models used as constraints mirror-symmetry and 3D compactness. The critical additional constraint was the use of a secondary mirror-symmetry that exists in most natural shapes. It is known that two planes of mirror symmetry are sufficient for a unique and veridical shape reconstruction. We also generalized the model so that it applies to both orthographic and perspective images. The results of our experiment suggest that the human visual system uses two planes of symmetry in addition to two forms of 3D compactness. Performance of the new model was highly correlated with subjects' performance with both orthographic and perspective images, which supports the claim that the most important 3D shape constraints that are used by the human visual system have been identified.

Keywords: compactness; inverse problems; monocular 3D vision; shape reconstruction; symmetry.


Conflict of interest statement

The authors declare that the research was conducted in the absence of any commercial or financial relationships that could be construed as a potential conflict of interest.

Figures

Figure 1
Figure 1
Perspective images of natural objects, random symmetrical polyhedra, and rectangular symmetrical polyhedra.
Figure 2
Figure 2
The black rectangle represents the boundary of the computer canvas, while the circles represent average image sizes and positions during the experiment with perspective and orthographic projection. Images were placed at ±4.5 degrees of visual angle from the center in the orthographic case and ±14 degrees of visual angle from the center in the perspective case. On average, the perspective image of the reference object occupied 22.8 degrees of visual angle, while the perspective image of the adjustable object occupied 18.5 degrees of visual angle. On average, the orthographic image of the reference object occupied 7.2 degrees of visual angle, while the orthographic image of the adjustable object occupied 5.8 degrees of visual angle.
Figure 3
Figure 3
(Left) A perspective Image of an object under the viewing conditions in our experiment. Specifically, your viewing distance should be 2.4 times the diameter of this image. (Center) A perspective image of the same object at distance three times greater. We enlarged the size of this image to make the comparison of images easier. Your viewing distance should now be 7.2 times the diameter of this image, (Right) an orthographic image of the same object. All three images used the same slant and tilt of the 3D shape.
Figure 4
Figure 4
Subjects’ performance as a function of slant of the symmetry plane of the reference shape for each of the 6 conditions. The vertical axis denotes shape dissimilarity, while the horizontal axis denotes slant angle of the symmetry plane of the reference shape. Shape dissimilarity is the measure of how far the subject’s percept was from the reference shape. The data points represent the individual trials. The dashed line indicates average dissimilarity.
Figure 5
Figure 5
Cumulative distributions of absolute value of shape dissimilarity, by subject (rows) and object type (columns). The numbers inside the graphs are 50th percentiles.
Figure 6
Figure 6
The leftmost column contains images of two reference shapes used in the experiment. The middle and right columns show images of shapes which have dissimilarities of 0.15 or 0.3 relative to the reference shape. A shape difference of 0.15 corresponds to a difference in aspect ratio of 11% while a shape difference of 0.3 corresponds to a difference in aspect ratio of 23%. The object in the top row has been stretched horizontally and compressed vertically. The object in the bottom row has been stretched vertically and compressed horizontally.
Figure 7
Figure 7
(A) and (B) each show two partial symmetry planes detected in 3D models. Both models are globally mirror symmetrical about the green plane and both have parts symmetrical about both green and purple planes. For example, the wheels of the car are symmetrical about both green and purple planes. Plot (C) shows the cost surface defined in Equation 3 for the car shown in (A). Dark blue corresponds to points close to the minimum and the red dot is the global minimum.
Figure 8
Figure 8
(A) Shows a set of rectangles of equal height in a plane parallel to the image plane. If we treat the vertical sides of the rectangles as symmetry lines in 3D, then the slant of the symmetry plane is 90 deg. – the symmetry plan is orthogonal to the image. (B) Shows the perspective images of those rectangles (solid lines) after rotating the rectangles by 75 deg. away from the frontoparallel plane. In this case, the slant of the symmetry plane is 15 deg. Note that the angular width of the perspective image is related to the angle between symmetry line segments in the image. The angular size of orthographic images in our experiment was around 7 degrees, corresponding to −3.5 to 3.5 on the plot. The angular size of perspective images in our experiment was around 20 degrees, corresponding to −10 to 10 on the plot. Perspective images in our experiment had strong perspective information.
Figure 9
Figure 9
Cumulative distributions of dissimilarity between model reconstruction and true shape, by subject and condition. The numbers inside the graphs are 50th percentiles.
Figure 10
Figure 10
Dissimilarities between true shape and model shape, for all three subjects. Note that in some panels there is less variability in the model than in subject’s responses which are plotted in Figure 4.
Figure 11
Figure 11
Cumulative distributions of dissimilarity between subject reconstruction and model reconstruction, by subject and condition. For all object types and subjects, the curves for perspective and orthographic images are similar, indicating that the model captured subject percept on perspective and orthographic images equally well. The median shape differences tend to be around 0.3, corresponding to the model predicting an aspect ratio that was 23% different from the aspect ratio selected by the subject.
Figure 12
Figure 12
We used a range of cost functions of the type VOn/SOm. This plot shows that VO2/SO3 produces the most rigid (consistent) reconstructions, while VO/SO3 produces reconstructions that are closest to the minimum range in depth. The specific distance measures used on the vertical axes of the plots are described in the main body of text.

Similar articles

References

    1. Attneave F., Frost R. (1969). The determination of perceived tridimensional orientation by minimum criteria. Percept. Psychophys. 6, 391–396. doi: 10.3758/BF03212797 - DOI
    1. Biederman I., Gerhardstein P. C. (1993). Recognizing depth-rotated objects: evidence and conditions for three-dimensional viewpoint invariance. J. Exp. Psychol. Hum. Percept. Perform. 19, 1162–1182. doi: 10.1037/0096-1523.19.6.1162, PMID: - DOI - PubMed
    1. Fischler M. A., Bolles R. C. (1981). Random sample consensus: a paradigm for model fitting with applications to image analysis and automated cartography. Commun. ACM 24, 381–395. doi: 10.1145/358669.358692 - DOI
    1. Hochberg J., McAlister E. (1953). A quantitative approach to figural goodness. J. Exp. Psychol. 46, 361–364. doi: 10.1037/h0049954, PMID: - DOI - PubMed
    1. Jayadevan V., Sawada T., Delp E., Pizlo Z. (2018). Perception of 3D symmetrical and nearly symmetrical shapes. Symmetry 10, 1–24. doi: 10.3390/sym10080344 - DOI

LinkOut - more resources