
Abstract

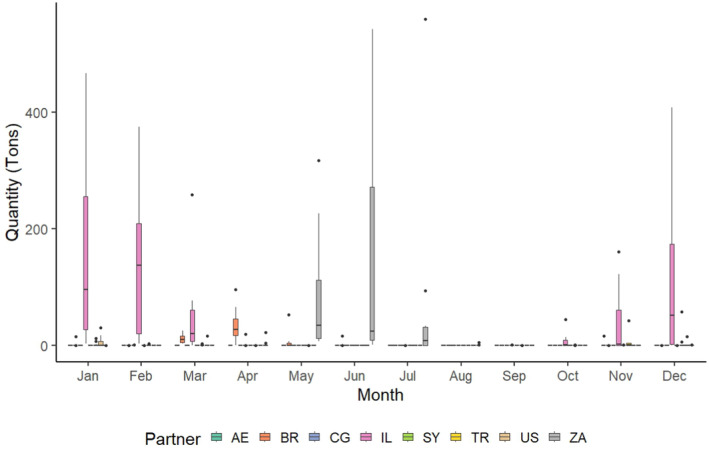
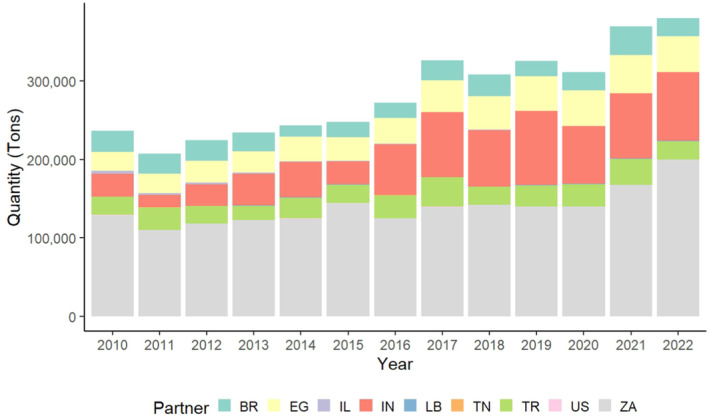
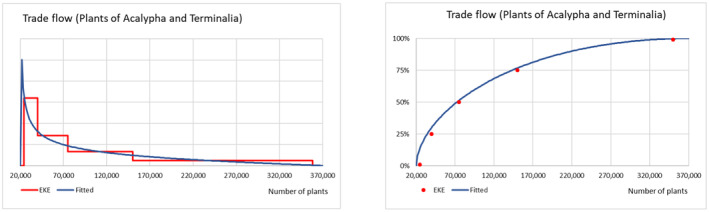
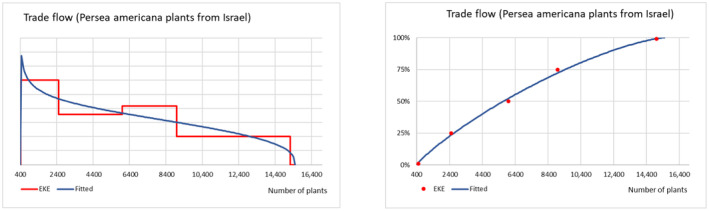
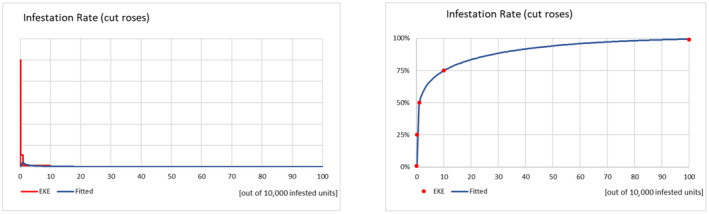
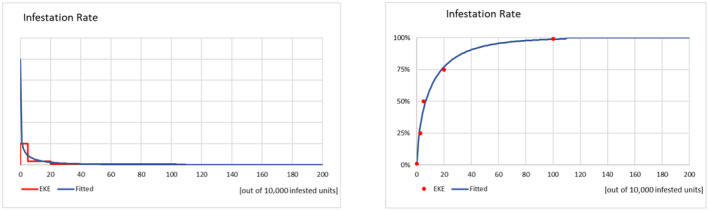
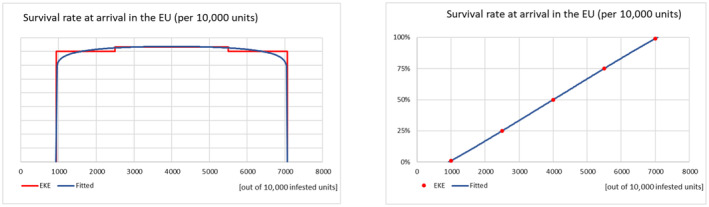
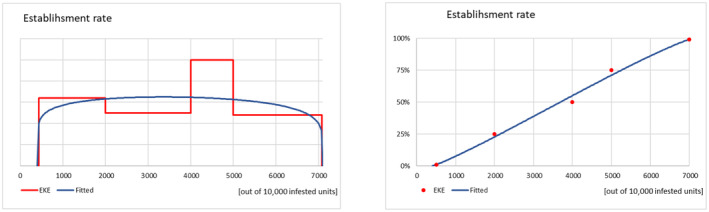
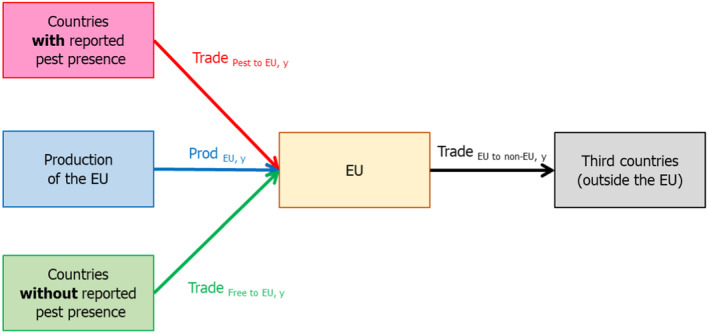
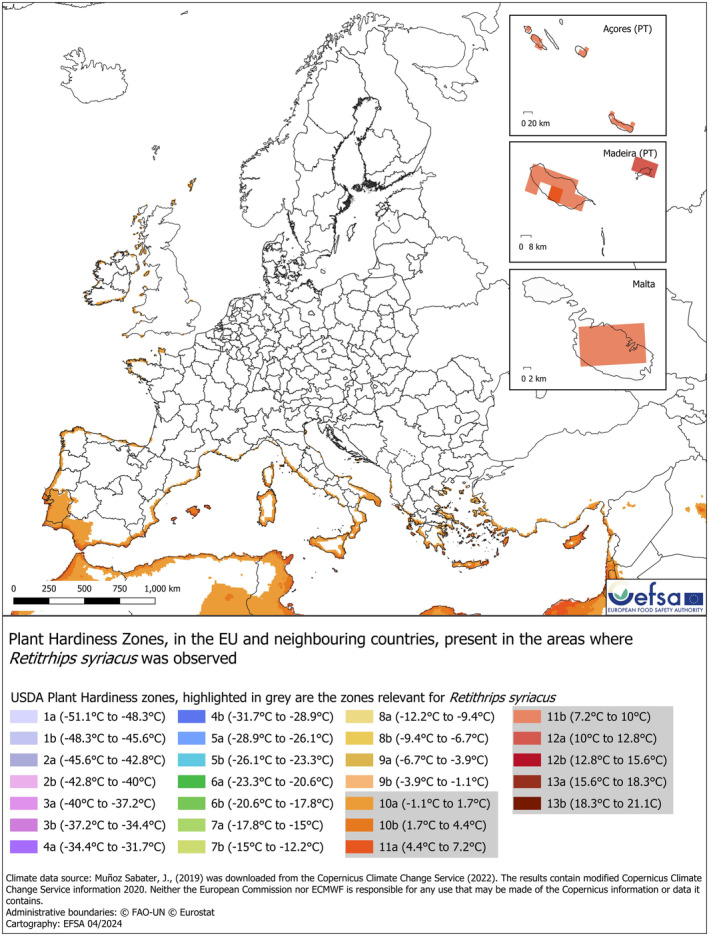
Following a request from the European Commission, the EFSA Panel on Plant Health performed a quantitative risk assessment for the EU of Retithrips syriacus (Mayet) (Thysanoptera: Thripidae), a polyphagous thrips, regarded as a tropical/subtropical pest occurring in several countries of Africa, South America, Asia and in the EU in Cyprus. The current risk assessment focused on potential pathways for entry, the climatic conditions allowing establishment, the expected spread capacity and the impact considering a time horizon of 10 years (2023-2032). The Panel identified the import of cut roses, persimmons, table grapes, as well as plants for planting of the genera Acalypha and Terminalia from third countries and those of Persea americana (avocado) from Israel as the most relevant entry pathways to consider. Over the next 10 years, an annual median estimate of 95 (90% Certainty Range, CR, ranging from 13 to 1832) potential R. syriacus founder populations per year are expected to successfully transfer to a suitable host in the EU NUTS2 regions where the climatic conditions are predicted as suitable for establishment; this value drops to a median of 4.6 founder populations per year (90% CR: 1 every 1.9 years - 85.6 per year) after considering the actual probability of establishment of a potential founder population. The estimated number of founder population per year is mostly driven by the import of cut roses and plants for planting. If such founder populations were to establish, R. syriacus is estimated to spread at a median rate of 0.05 km/year (90% CR 0.02-2.30 km/year) after a median lag phase of 1.1 years (90% CR 0.3-3.3 years). The overall impact on yield (expressed as % of the total agricultural production) directly attributable to R. syriacus when considering: (i) the main R. syriacus hosts in the EU, (ii) the areas of the EU where establishment is possible, (iii) the current agricultural practices and (iv) the evidence of impact from the countries where the pest is established for a long time, was estimated at 0.065% as the median value of the uncertainty distribution (90% CR 0.001%-0.571%). Options for risk reduction are discussed, but the effectiveness was not quantified.

Keywords: Vitis vinifera; black vine thrips; pathway model; pest prevalence; phytosanitary measures; risk assessment; uncertainty.


Conflict of interest statement

If you wish to access the declaration of interests of any expert contributing to an EFSA scientific assessment, please contact interestmanagement@efsa.europa.eu.

Figures

FIGURE 1
FIGURE 1
Trend analysis, based on 2010–2022 Eurostat data, of the import of table grapes (tons) into the EU from countries where Retithrips syriacus is reported. The fitted trend was projected over the 10 years of the PRA time horizon (2023–2032). Dashed and dotted lines indicate the 95% confidence and prediction intervals, respectively.
FIGURE 2
FIGURE 2
Trend analysis, based on 2010–2022 Dutch NPPO data, of the import of Acalypha and Terminalia into the EU from countries where the pest is reported. The fitted trend was projected over the 10 years of the PRA time horizon (2023–2032). Dashed lines indicate the 95% confidence intervals for both the linear (red) and quadratic (blue) fits, both significant at p < 0.01.
FIGURE 3
FIGURE 3
Percentage of product (cut roses, table grapes and persimmons) imported into the EU (from the countries where the pest is reported) that arrives in the Member States (median values of the redistribution model are reported).
FIGURE 4
FIGURE 4
Graphical representation of the median number of potential founder populations per NUTS2 (NPFPNUTS2ji) as a result of the redistribution model and probability of successful transfer to a suitable host.
FIGURE 5
FIGURE 5
Map showing the location points (red) where precise coordinates for the presence of Retithrips syriacus could be obtained overlayed to the areas (grey background) where the presence of the pest was only reported at a FAO.GAUL Administrative 0, 1 or 2.
FIGURE 6
FIGURE 6
Map of the EU showing the result of overlapping Köppen–Geiger climate type, hardiness zone and average maximum number of consecutive days below the LDT. In white areas where the probability of establishment was assumed to be negligible. In light green (‘Union’), the areas of the EU where at least one of the considered climate indicators coincide with those where Retithrips syriacus was observed in the countries of origin. In dark green (‘Intersection’), the areas of the EU where all the considered climate indicators coincide with those where the pest was observed in the countries of origin.
FIGURE 7
FIGURE 7
Graphical representation of the median number of founder populations of R. syriacus per NUTS2 (FPNUTS2ji) as a result of the redistribution model and probability of establishment.
FIGURE 8
FIGURE 8
Correlations between the output variable (FPEU) and the parameters of the entry pathway model. Only the 10 highest correlations are shown.
FIGURE A.1
FIGURE A.1
Retithrips syriacus adult female (A), slide‐mounted female (B), prepupa (left) and second instar larva (right) (C), prepupae (D). Photos © Dr. Élison Fabrício Bezerra Lima.
FIGURE D.1
FIGURE D.1
Total quantity (2010–2022) imported from the countries collectively accounting for 99.99% of the total cut roses imported into the EU from countries where Retithrips syriacus is recorded. IN, India; KE, Kenya; TR, Türkiye; TZ, United Republic of Tanzania; UG, Uganda; ZA, South Africa.
FIGURE D.2
FIGURE D.2
Share of the cut roses market from countries collectively accounting for 99.99% of the cut roses imports from where Retithrips syriacus is recorded (India, Kenya, Türkiye, United Republic of Tanzania, Uganda and South Africa) as compared to other third countries where R. syriacus is not known to occur.
FIGURE D.3
FIGURE D.3
Monthly import data of cut roses into the EU from commercial partners collectively accounting for 99.99% of the total cut roses imports from where Retithrips syriacus is recorded. IN, India; KE, Kenya; TR, Türkiye; TZ, United Republic of Tanzania; UG, Uganda; ZA, South Africa.
FIGURE D.4
FIGURE D.4
Trend analysis based on 2010–2022 EUROSTAT data of cut roses import (tons) into the EU from countries where Retithrips syriacus was reported, and projection over the 10 years of the PRA time horizon (2023–2032). Dashed and dotted lines indicate the 95% confidence and prediction intervals, respectively.
FIGURE D.5
FIGURE D.5
Distribution of the estimated trade flow (T v ) for cut roses as tons per year fitted to EKE estimates.
FIGURE D.6
FIGURE D.6
Total import quantity (2012–2022) of the commercial partners collectively accounting for 99.99% of the total persimmons imports into the EU from where Retithrips syriacus is recorded (AE, United Arab Emirates; BR, Brazil; CG, Congo; IL, Israel; SY, Syrian Arab Republic, TR, Türkiye, US, United States, ZA, South Africa).
FIGURE D.7
FIGURE D.7
Share of the persimmons market from countries collectively accounting for 99.99% of the imports of persimmons from where Retithrips syriacus is present (United Arab Emirates, Brazil, Congo, Israel, Syrian Arab Republic, Türkiye, United States, South Africa) as compared to other third countries where R. syriacus is not known to occur.
FIGURE D.8
FIGURE D.8
Monthly persimmons import data into the EU from the commercial partners collectively accounting for 99.99% of the total persimmons imports from where Retithrips syriacus is present (AE, United Arab Emirates; BR, Brazil; CG, Congo; IL, Israel; SY, Syrian Arab Republic; TR, Türkiye; US, United States; ZA, South Africa).
FIGURE D.9
FIGURE D.9
Trend analysis based on 2012–2022 EUROSTAT data on the persimmons import (tons) into the EU from countries where Retithrips syriacus was reported, and projection over the 10 years of the PRA time horizon (2023–2032). Dashed and dotted lines indicate the 95% confidence and prediction intervals, respectively.
FIGURE D.10
FIGURE D.10
Distribution of the estimated trade flow (Tv) for persimmons as tons per year fitted to EKE estimates.
FIGURE D.11
FIGURE D.11
Total import (2010–2022) of the commercial partners collectively accounting for 99.99% of the total table grapes imports into the EU from where Retithrips syriacus is present. BR, Brazil; EG, Egypt; IL, Israel; IN, India; LB, Lebanon; TN, Tunisia; TR, Türkiye; US, United States; ZA, South Africa.
FIGURE D.12
FIGURE D.12
Share of the table grapes market from countries collectively accounting for 99.99% of the table grapes imports from where Retithrips syriacus is present (Brazil, Egypt, Israel, India, Lebanon, Tunisia, Türkiye, United States and South Africa) as compared to other third countries where R. syriacus is not known to occur.
FIGURE D.13
FIGURE D.13
Monthly table grapes import data into the EU from commercial partners collectively accounting for 99.99% of the total table grapes imports from where Retithrips syriacus is present (BR, Brazil; EG, Egypt; IL, Israel; IN, India; LB, Lebanon; TN, Tunisia; TR, Türkiye; US, United States; ZA, South Africa).
FIGURE D.14
FIGURE D.14
Distribution of the estimated trade flow (Tv) for table grapes as tons per year fitted to EKE estimates.
FIGURE D.15
FIGURE D.15
Distribution of the estimated trade flow (Tv) plants for planting of the genera Acalypha and Terminalia as number of pieces per year fitted to EKE estimates.
FIGURE D.16
FIGURE D.16
Distribution of the estimated Persea americana plants trade flow (Tv) from Israel as number of pieces per year fitted to EKE estimates.
FIGURE D.17
FIGURE D.17
Distribution of the estimated infestation rate of Retithrips syriacus in cut roses (per 10,000 units) when leaving the packing house fitted to EKE estimates.
FIGURE D.18
FIGURE D.18
Distribution of the estimated infestation rate of Retithrips syriacus in table grapes bunches (per 10,000 units) when leaving the packing house fitted to EKE estimates.
FIGURE D.19
FIGURE D.19
Distribution of the estimated infestation rate of Retithrips syriacus in plants of the genera Acalypha and Terminalia (per 10,000 units) when arriving in the EU fitted to EKE estimates.
FIGURE D.20
FIGURE D.20
Distribution of the estimated infestation rate of Retithrips syriacus in P. americana plants from Israel (per 10,000 units) when arriving in the EU fitted to EKE estimates.
FIGURE D.21
FIGURE D.21
Distribution of the estimated survival rate of Retithrips syriacus in cut roses (per 10,000 units) when transported to the EU via air cargo fitted to EKE estimates.
FIGURE D.22
FIGURE D.22
Distribution of the estimated survival rate of Retithrips syriacus in table grapes and persimmons (per 10,000 units) when transported to the EU via air cargo fitted to EKE estimates.
FIGURE D.23
FIGURE D.23
Distribution of the estimated survival rate of Retithrips syriacus in table grapes and persimmons (per 10,000 units) when transported to the EU via ocean cargo fitted to EKE estimates.
FIGURE D.24
FIGURE D.24
Distribution of the estimated transfer rate of Retithrips syriacus fitted to EKE estimates.
None
FIGURE D. 25 Distribution fitted to EKE estimates of Retithrips syriacus establishment rate in the areas of the EU where ALL the climate indicators are consistent with those where the pest was observed in the countries of origin.
None
FIGURE D. 26 Distribution fitted to EKE estimates of Retithrips syriacus establishment rate in the areas of the EU where AT LEAST ONE of the climate indicators is consistent with those where the pest was observed in the countries of origin.
FIGURE D.27
FIGURE D.27
Distribution fitted to EKE estimates of Retithrips syriacus lag phase (in years).
FIGURE D.28
FIGURE D.28
Distribution fitted to EKE estimates of Retithrips syriacus spread rate (in km/years).
None
FIGURE D. 29 Distribution fitted to EKE estimates of the expected yield loss directly attributed to Retithrips syriacus in the areas of the EU where establishment is possible (% plant products).
FIGURE E.1
FIGURE E.1
Structure of the redistribution model (with 2 EU Member States).
FIGURE E.2
FIGURE E.2
Structure of the annual commodity balance on EU level.
FIGURE F.1
FIGURE F.1
Monthly average temperature for the EU.
FIGURE F.2
FIGURE F.2
Köppen–Geiger climate types occurring in places where Retithrips syriacus has been reported and in the EU.
FIGURE F.3
FIGURE F.3
Hardiness zone map based on the average annual minimum temperature for the period 1993–2022. The map highlights the hardiness zones (highlighted in grey in the legend) in the EU where the average minimum temperature is higher or equal to the minimum value sampled using Retithrips syriacus occurrences. The Hardiness zone map is based on the recent implementation of the USDA Plant Hardiness Zones (2023).
FIGURE F.4
FIGURE F.4
Areas in EU where the average maximum number of consecutive days with temperature below lower development threshold (14.9°C) is equal or below the maximum value (114.8 days in Tunisia) derived from the Retithrips syriacus distribution occurrences.

References

    1. Agricultural Research Service USDA . (2023). USDA Plant Hardiness Zones Map. https://planthardiness.ars.usda.gov/
    1. AGDA (Australian Government Department of Agriculture) . (2016). Final report for the non‐regulated analysis of existing policy for table grapes from India . Australian Government Department of Agriculture CC BY 3.0.
    1. Al‐Zyoud, F. , & Elmosa, H. (2007). Population dynamics of arthropod pests on grapevine and chemical control of the grape berry moth Lobesia botrana Schiff.(Lep., Tortricidae) in Jerash area, Jordan. The Jordan Journal of Agricultural Science, 3, 136–147.
    1. Ananthakrishnan, T. (1985). Host relationship and damage potential of thrips infesting cashew. Proceedings of the International Cashew Symposium, 108, 131–134.
    1. Ananthakrishnan, T. N. (1955). Host preferences in Retithrips syriacus (Mayet). Agra University of Journal Research Science, 4, 283–288.

LinkOut - more resources