

Development of automated neural network prediction for echocardiographic left ventricular ejection fraction
- PMID: 38686369
- PMCID: PMC11057494
- DOI: 10.3389/fmed.2024.1354070
Development of automated neural network prediction for echocardiographic left ventricular ejection fraction
Abstract
Introduction: The echocardiographic measurement of left ventricular ejection fraction (LVEF) is fundamental to the diagnosis and classification of patients with heart failure (HF).
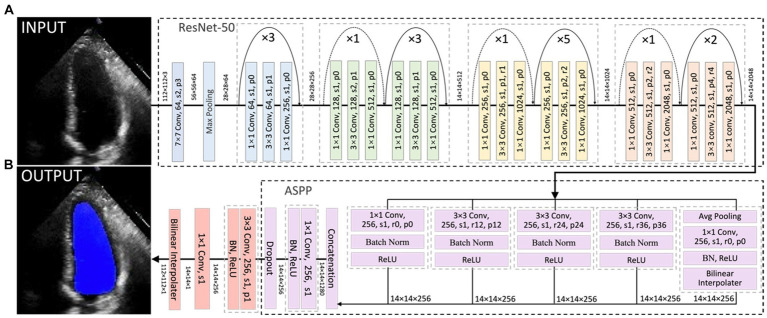
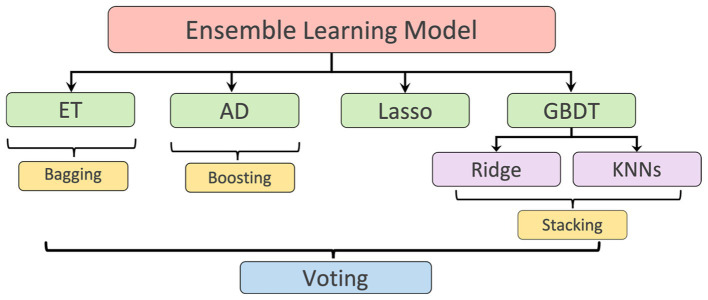
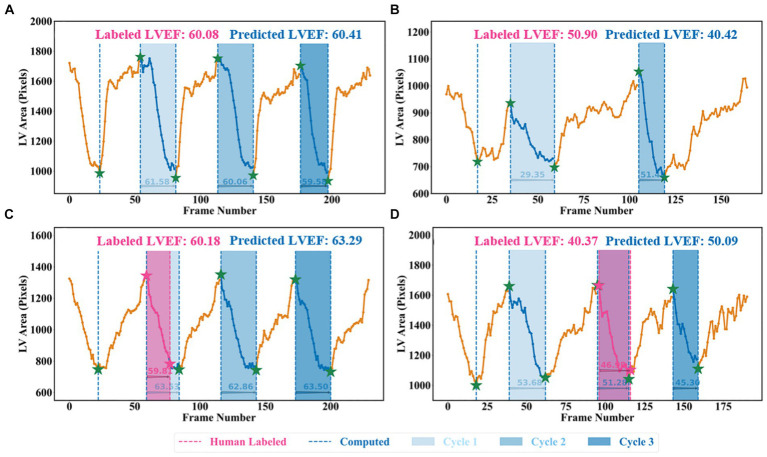
Methods: This paper aimed to quantify LVEF automatically and accurately with the proposed pipeline method based on deep neural networks and ensemble learning. Within the pipeline, an Atrous Convolutional Neural Network (ACNN) was first trained to segment the left ventricle (LV), before employing the area-length formulation based on the ellipsoid single-plane model to calculate LVEF values. This formulation required inputs of LV area, derived from segmentation using an improved Jeffrey's method, as well as LV length, derived from a novel ensemble learning model. To further improve the pipeline's accuracy, an automated peak detection algorithm was used to identify end-diastolic and end-systolic frames, avoiding issues with human error. Subsequently, single-beat LVEF values were averaged across all cardiac cycles to obtain the final LVEF.
Results: This method was developed and internally validated in an open-source dataset containing 10,030 echocardiograms. The Pearson's correlation coefficient was 0.83 for LVEF prediction compared to expert human analysis (p < 0.001), with a subsequent area under the receiver operator curve (AUROC) of 0.98 (95% confidence interval 0.97 to 0.99) for categorisation of HF with reduced ejection (HFrEF; LVEF<40%). In an external dataset with 200 echocardiograms, this method achieved an AUC of 0.90 (95% confidence interval 0.88 to 0.91) for HFrEF assessment.
Conclusion: The automated neural network-based calculation of LVEF is comparable to expert clinicians performing time-consuming, frame-by-frame manual evaluations of cardiac systolic function.
Keywords: artificial intelligence; atrial fibrillation; echocardiogram; ejection fraction; heart failure.
Copyright © 2024 Zhang, Liu, Bunting, Brind, Thorley, Karwath, Lu, Zhou, Wang, Mobley, Tica, Gkoutos, Kotecha and Duan.
Conflict of interest statement
The authors declare that the research was conducted in the absence of any commercial or financial relationships that could be construed as a potential conflict of interest.
Figures


References
-
- Cleland JGF, Bunting KV, Flather MD, Altman DG, Holmes J, Coats AJS, et al. . Beta-blockers for heart failure with reduced, mid-range, and preserved ejection fraction: an individual patient-level analysis of double-blind randomized trials. Eur Heart J. (2018) 39:26–35. doi: 10.1093/eurheartj/ehx564, PMID: - DOI - PMC - PubMed
-
- Lang RM, Badano LP, Mor-Avi V, Afilalo J, Armstrong A, Ernande L, et al. . Recommendations for cardiac chamber quantification by echocardiography in adults: an update from the American Society of Echocardiography and the European Association of Cardiovascular Imaging. J Am Soc Echocardiogr. (2015) 28:e14: 1–39.e14. doi: 10.1016/j.echo.2014.10.003 - DOI - PubMed
-
- Lang RM, Bierig M, Devereux RB, Flachskampf FA, Foster E, Pellikka PA, et al. . Recommendations for chamber quantification: a report from the American Society of Echocardiography's guidelines and standards committee and the chamber quantification writing group, developed in conjunction with the European Association of Echocardiography, a branch of the European Society of Cardiology. J Am Soc Echocardiogr. (2005) 18:1440–63. doi: 10.1016/j.echo.2005.10.005, PMID: - DOI - PubMed
Grants and funding
LinkOut - more resources
Full Text Sources
Research Materials
Miscellaneous